
Since the last blog post on January 6th, there have been new state-level polls in New Mexico, Iowa, Arizona, Michigan (x2), Georgia, Nevada, Wisconsin (x2), Connecticut, Florida, and West Virginia.
These polls have, in general, shown mixed results. Some move toward Trump, some step toward the Democrats. For some, it depends which Democrat you are watching.
Add everything in from all the states, and you end up with a pretty neutral update on the probabilistic view, with no massive moves, and the changes we do have going in different directions.
Let's look first at the median margins in the Monte Carlo simulations:
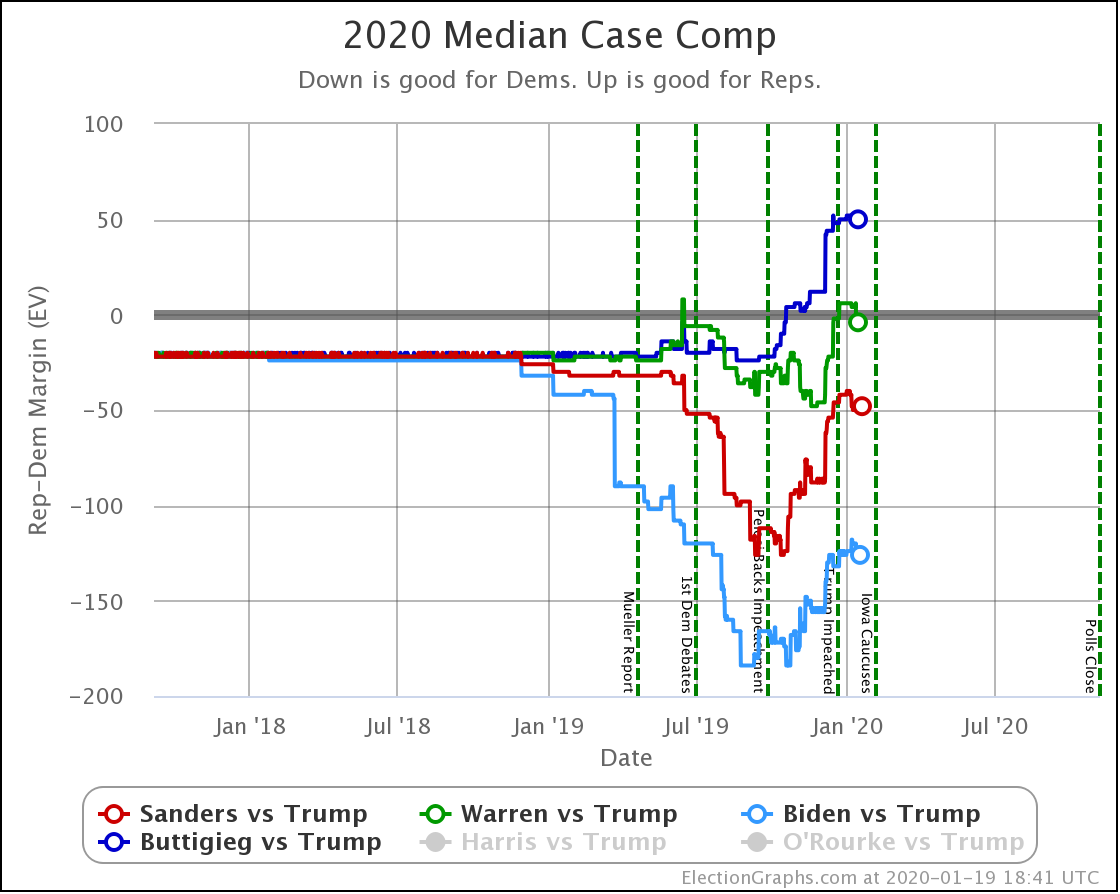
| Dem | 6 Jan | 19 Jan | 𝚫 |
| Biden | +132 | +126 | -6 |
| Sanders | +46 | +48 | +2 |
| Warren | +2 | +4 | +2 |
| Buttigieg | -48 | -50 | -2 |
Two Democrats improve against Trump, two diminish. But none of these move very much from where they were.
It is worth noting that between the last update and this one, Warren vs. Trump did briefly flip to the median being a six electoral vote Trump win. But then that reversed and ended up with Warren being slightly better off than she was.
When you look at the four curves, it seems POSSIBLE that we have hit an inflection point. After several months of the curves moving towards Trump, have we now changed direction?
I would urge caution on that interpretation. It is premature. Notice that there was a similar "bump" back toward the Democrats in November. But it was short-lived, and the longer-term trend continued.
So, on the whole, no big moves this update.
Now in terms of win odds:
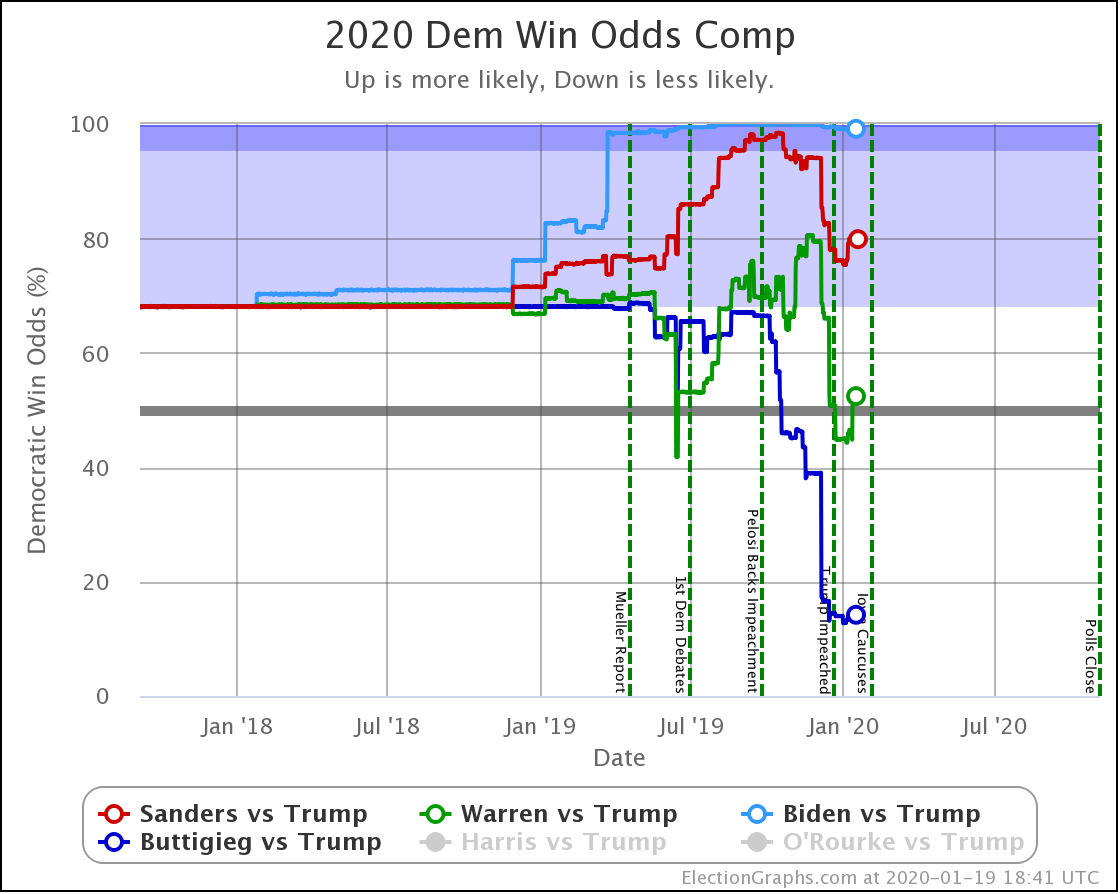
| Dem | 6 Jan | 19 Jan | 𝚫 |
| Biden | 99.5% | 99.2% | -0.3% |
| Sanders | 78.0% | 79.9% | +1.9% |
| Warren | 50.8% | 52.4% | +1.6% |
| Buttigieg | 14.4% | 14.2% | -0.2% |
Between these updates, Biden had briefly dropped below 99%. But he rebounded up to 99.2%. Not quite the 99.9%+ he had back in September, but still very strong.
Sanders and Warren both improve a little bit here, with Sanders continuing to be weaker than Biden, but much stronger than Warren, who is barely better than a coin toss.
And Buttigieg, well, at the moment he continues to look like cannon fodder for Trump if that was the matchup.
Looking at the older categorization view, in terms of straight-up changes to the categories I put states in, four changes were good for the Democrats, and three changes were good for Trump.
Moves toward the Democrats:
- Sanders: New Mexico moved from Strong Sanders to Solid Sanders
- Warren: Iowa moved from Strong Trump to Weak Trump
- Warren: Michigan moved from Weak Trump to Weak Warren
- Buttigieg: Arizona moved from Strong Trump to Weak Trump
Moves toward Trump:
- Sanders: Georgia moved from Weak Sanders to Weak Trump
- Biden: Michigan moved from Strong Biden to Weak Biden
- Buttigieg: Iowa moved from Weak Buttigieg to Weak Trump
With the categorization view, we're simplifying and only say how the electoral college would look if every candidate won every state where they lead the average, rather than noting how often close states could flip to the underdog. But with that view, things look like this:
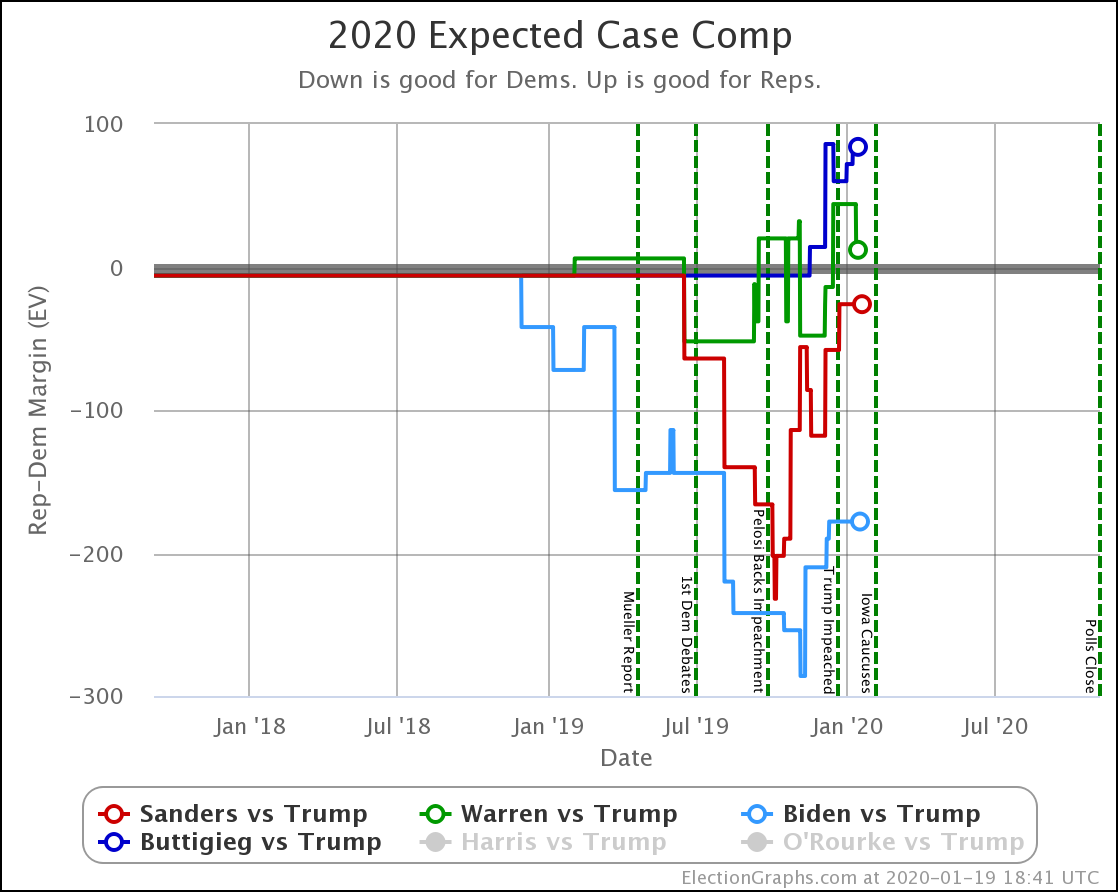
| Dem | 6 Jan | 19 Jan | 𝚫 |
| Biden | +178 | +178 | Flat |
| Sanders | +58 | +26 | -32 |
| Warren | -44 | -12 | +30 |
| Buttigieg | -60 | -84 | -24 |
The changes here are more significant than in the probabilistic view because when a state goes from just barely one side, to just slightly on the other, it makes a huge and immediate difference.
Here only Warren actually improves from where we were at the last update, but she still loses to Trump.
Then the tipping points:
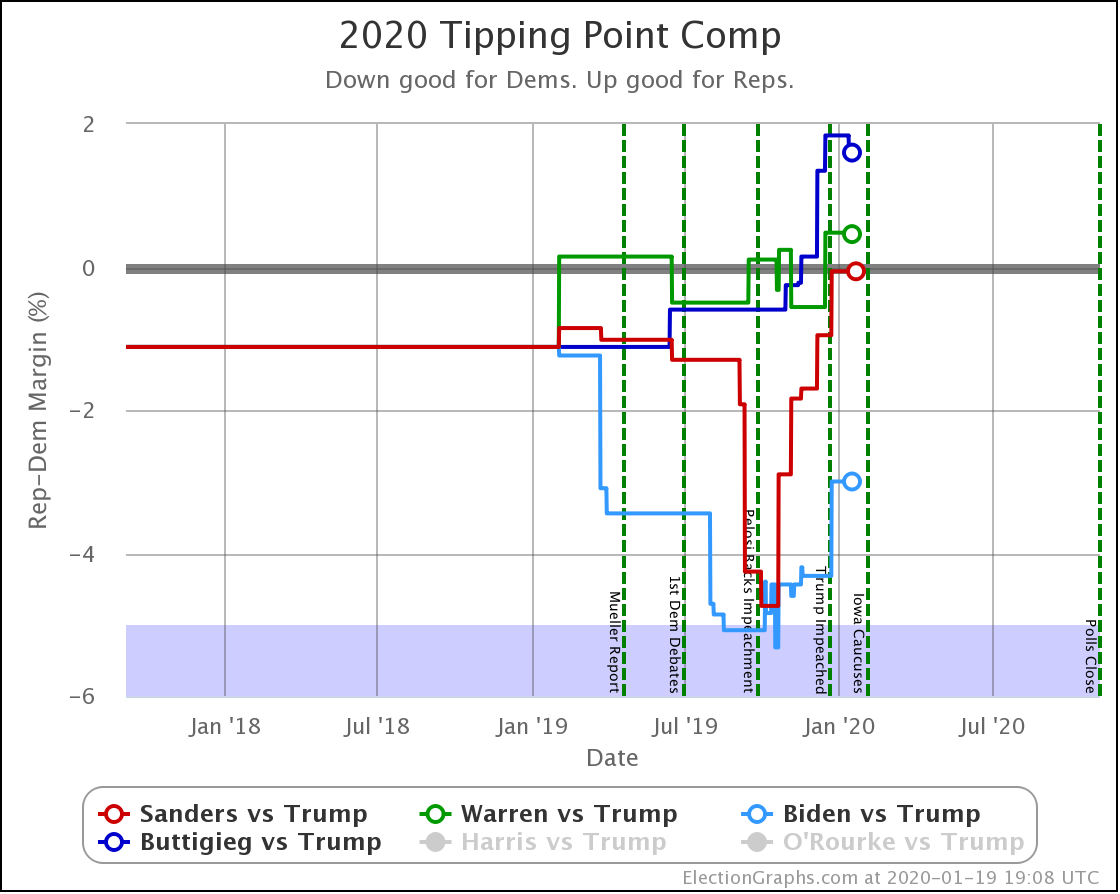
| Dem | 6 Jan | 19 Jan | 𝚫 |
| Biden | +4.3% | +3.0% | -1.3% |
| Sanders | +1.0% | +0.1% | -0.9% |
| Warren | -0.5% | -0.5% | Flat |
| Buttigieg | -1.8% | -1.6% | +0.2% |
On this view, only Buttigieg improves, and just barely. Because while another state flipped to Trump, the margin in the state needed to flip the balance back to him is less than it was before.
Each of these views shows a different way of looking at the race. If I had to pick one at the moment, I'd choose the probabilistic win odds, because it best incorporates all of the various factors at play. But all of them still show something worth tracking.
Now, a quick review of trends in each of the swing states with updates this time around. (I'll skip the states that are not really in contention.)
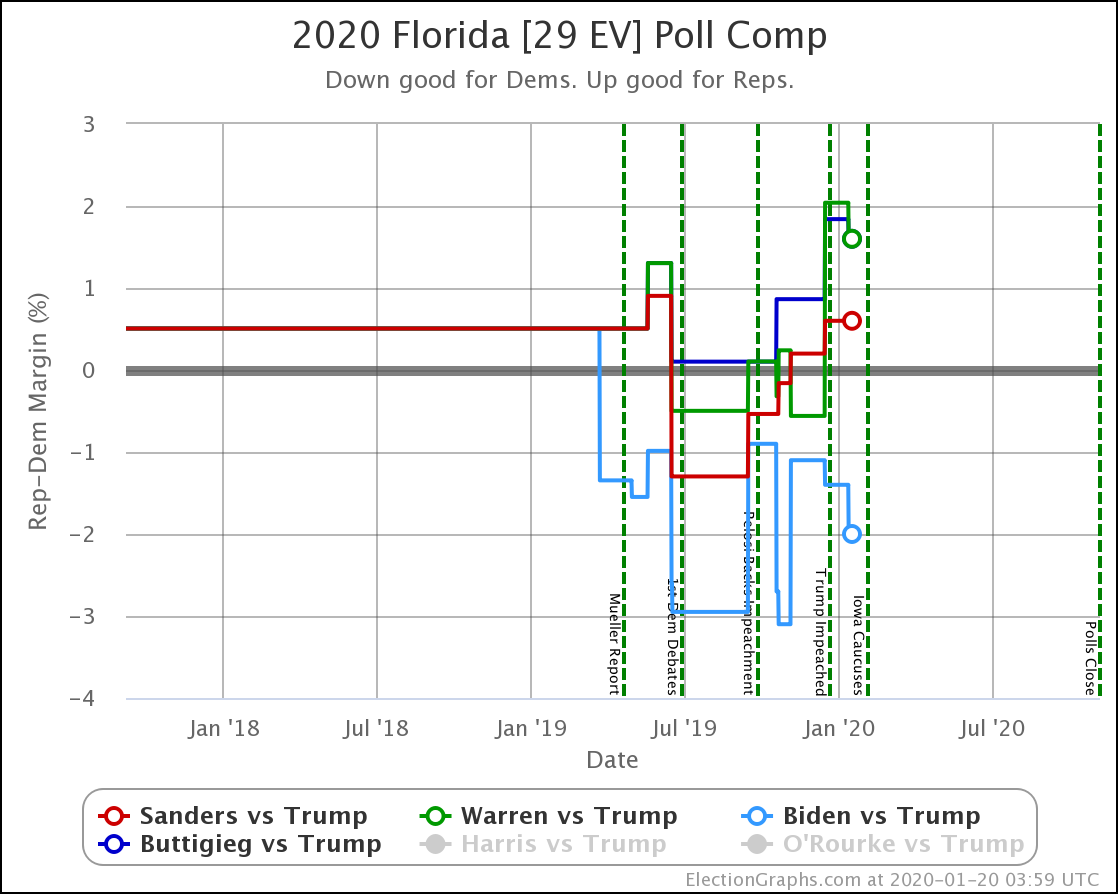
There is no real clear direction to the movement in Florida. The last updates have been good for the Dems, but all four of these candidates are neck and neck with Trump in Florida. Florida can't get enough of being a state living right on the knife's edge.
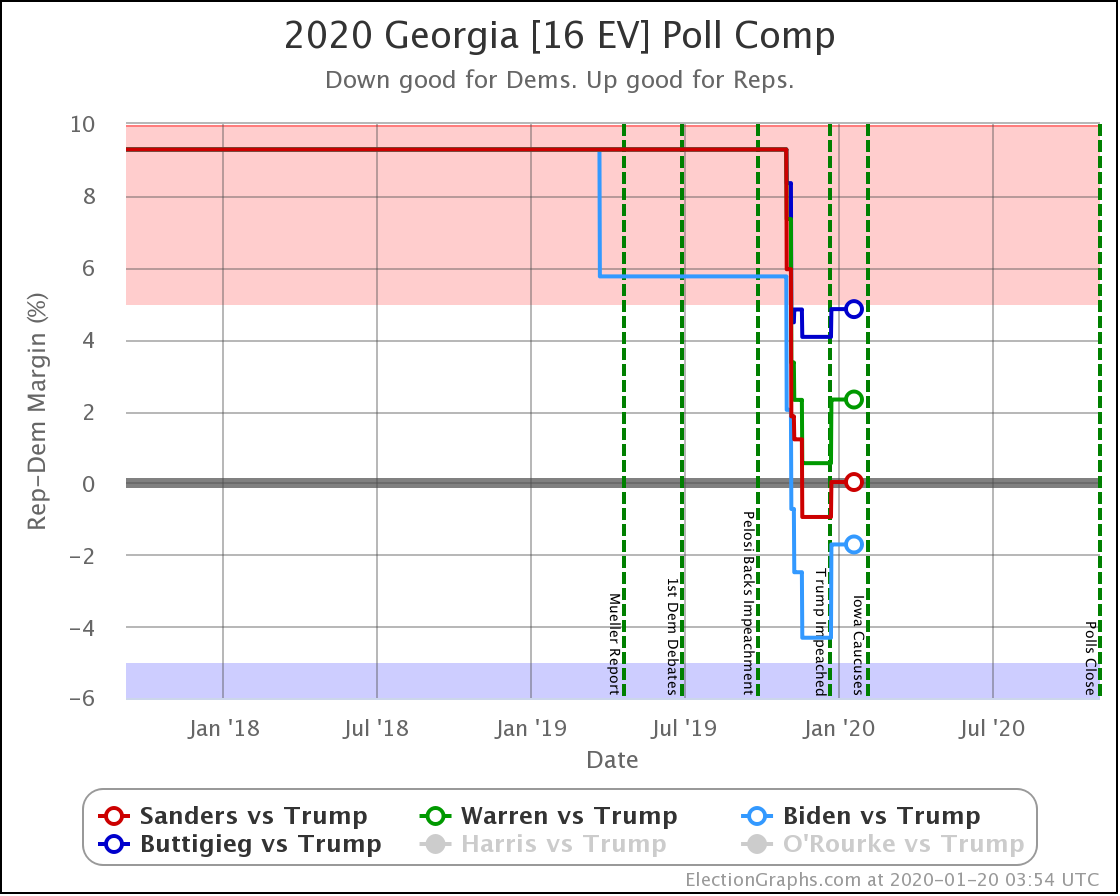
Georgia has been very sparsely polled.
The first few polls showed it moving much further in the Democratic direction than the historical average. The latest results inch back toward the red. But Georgia is a state to keep a careful eye on. At the moment, it is clearly in contention.
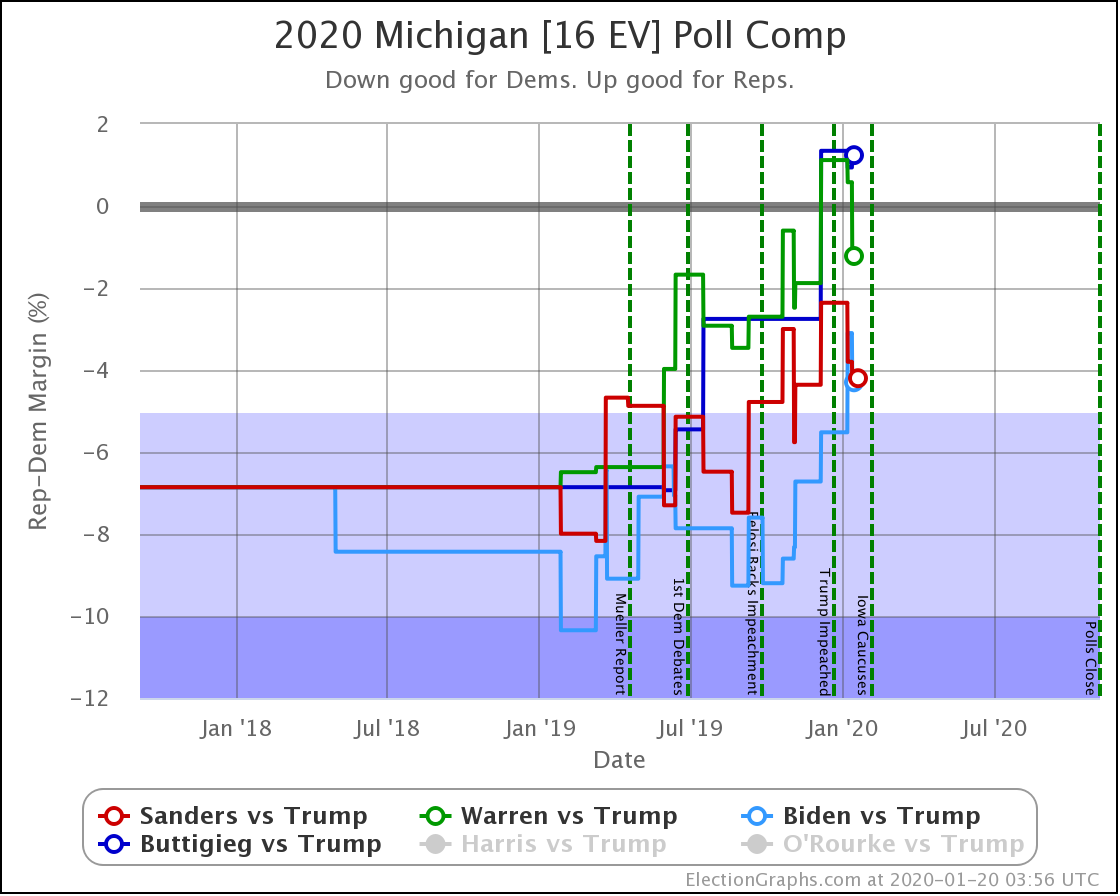
The historical average in Michigan has been pretty blue, but the most recent polls have shown that 2016 (a narrow 0.2% Republican win) may not have been an aberration. All four of these candidates are showing close races at the moment, with Buttigieg losing to Trump, and the other Democrats holding on to narrow leads.
The trends since the summer have been toward the Republicans, but the most recent polls have gone the other way, so the next releases will be critical to watch, as we will see if the state starts moving back to the blue, or stays in swing-state territory.
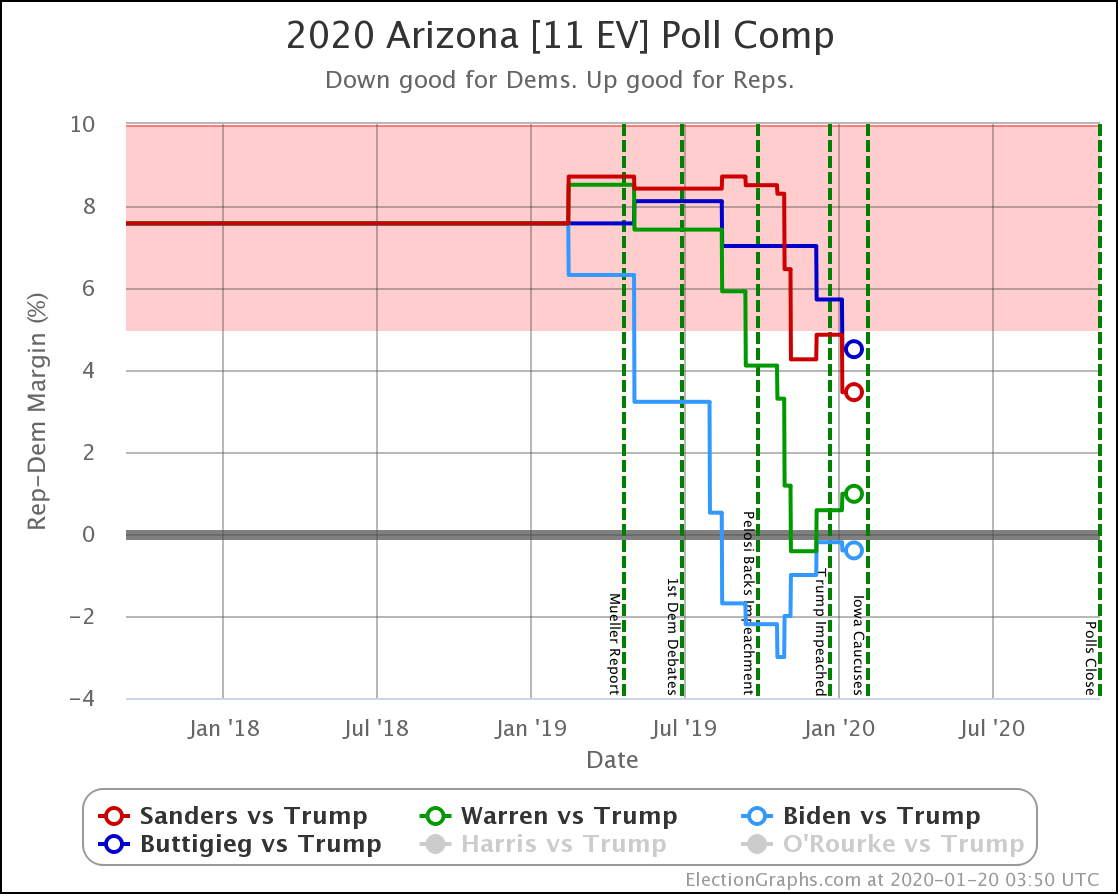
Arizona is almost the opposite of Michigan. A historically red state, where the early polls pulled things into the disputed zone, but some of the more recent results have started to move the averages back, at least for Sanders and Biden. This is another state to watch very carefully.
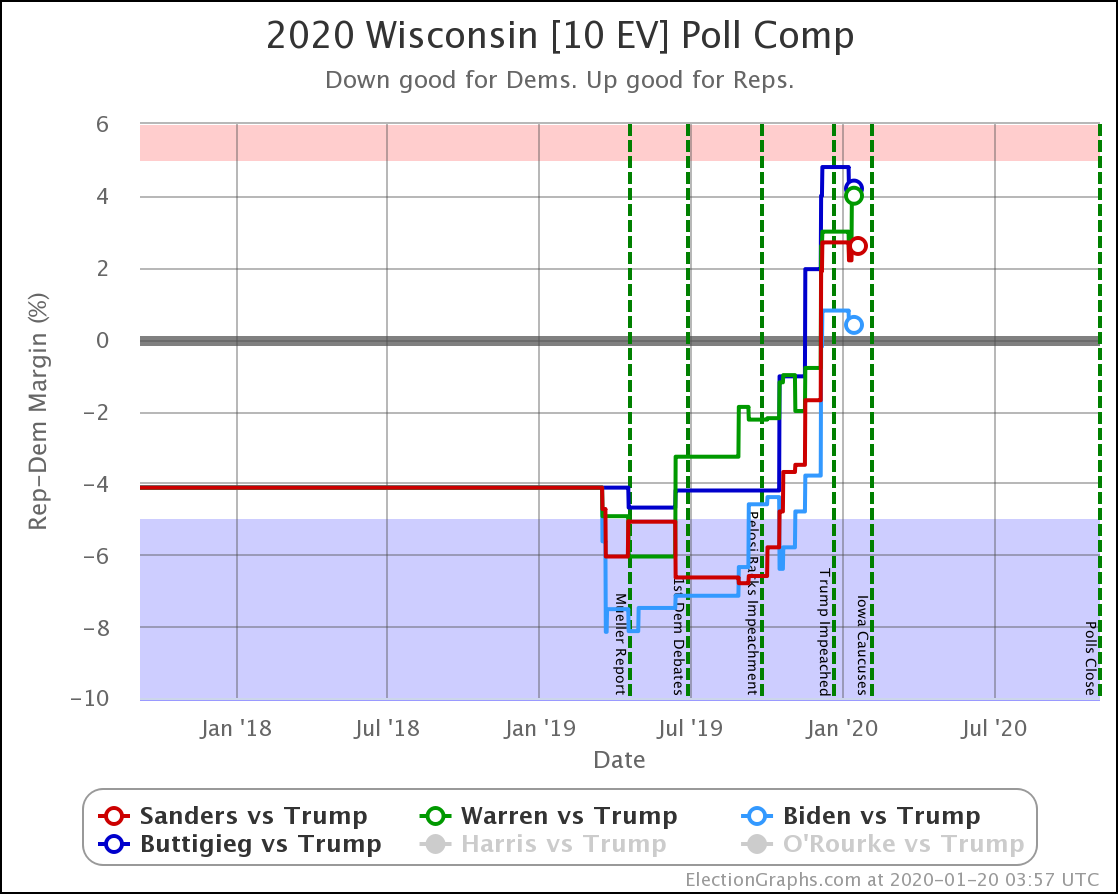
Wisconsin started out with a historical average of Weak Democrat. 2020 polls have shifted this to Weak Trump for all four of these Democrats. The most recent polls make it look like this movement may have plateaued, but it is too early to tell.
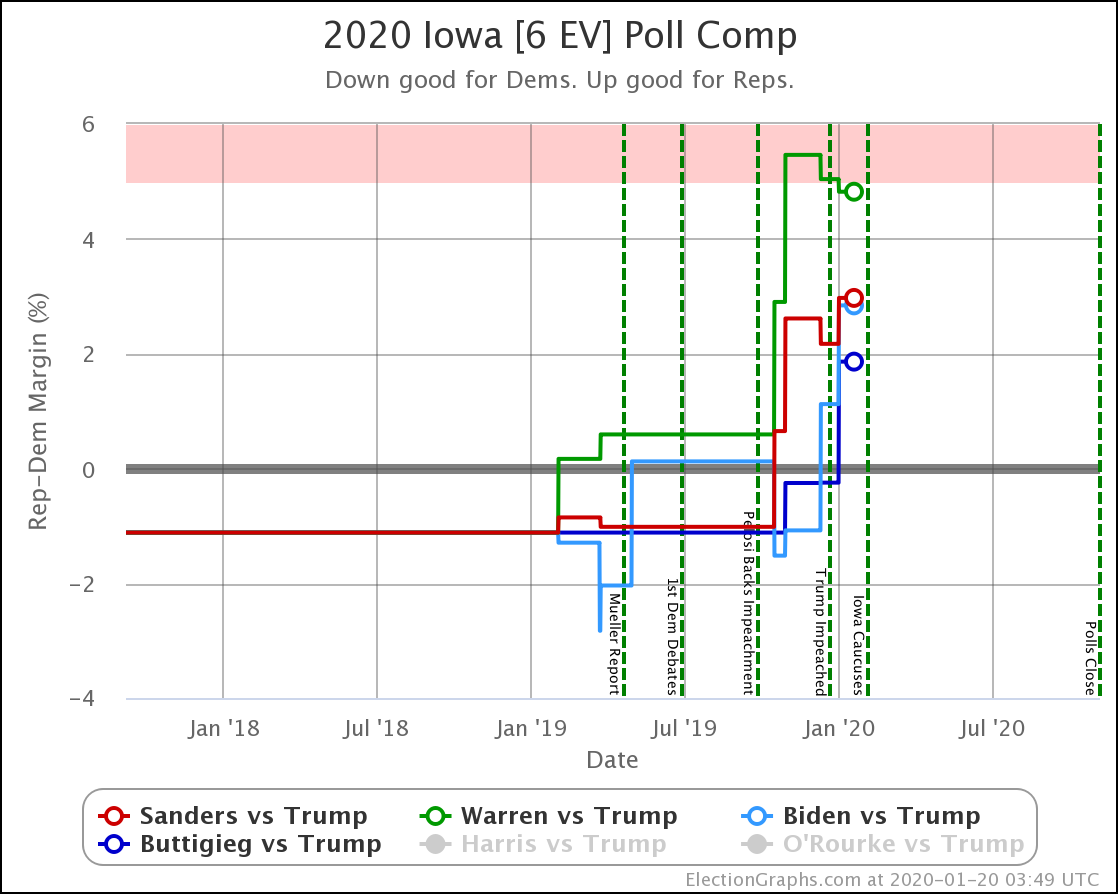
Iowa's historical average was Weak Democrat, now it looks like Weak Trump, but it is still close enough to be in contention.
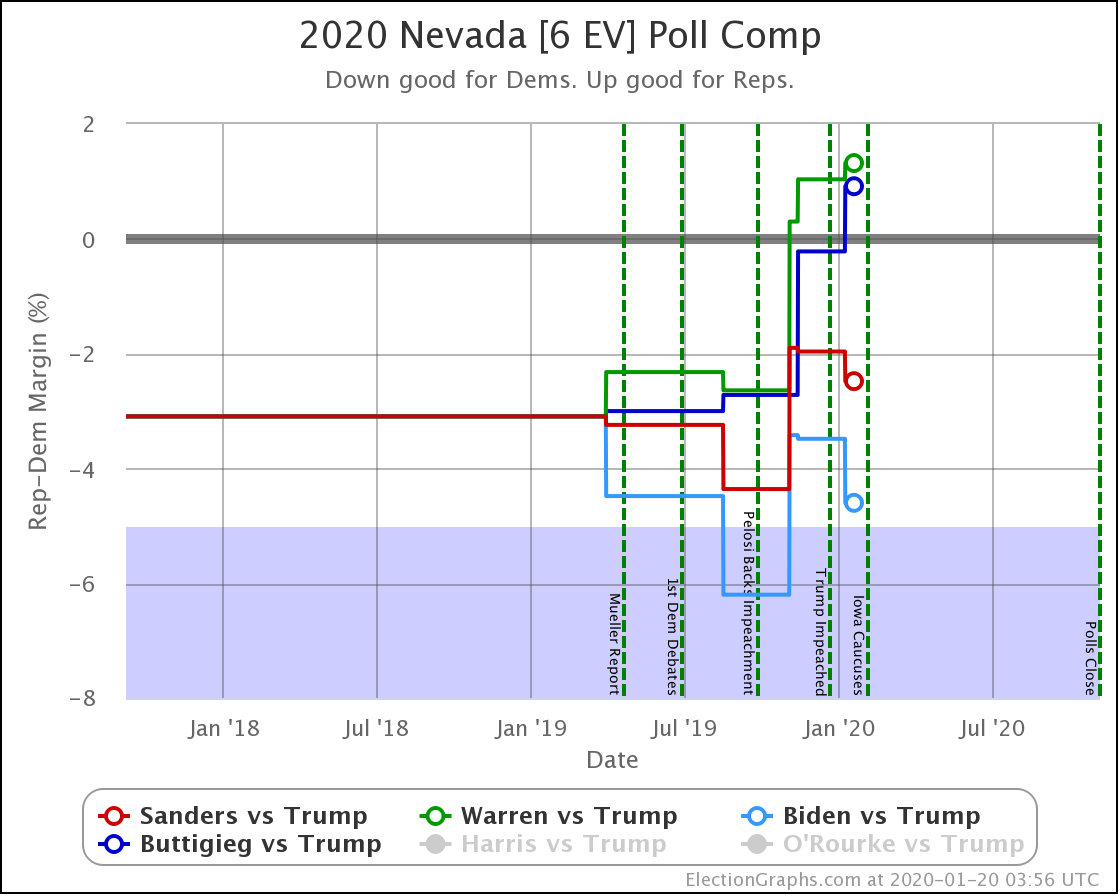
And Nevada. Warren and Buttigieg are just barely losing to Trump. Sanders and Biden are winning by a bit larger margin, but still close.
That's it for the state by state updates this time.
Finally, I have one more thing to highlight before closing.
As I write this, there are just over two weeks until the Iowa caucuses, which are traditionally the start of the delegate race for both parties. I was planning on opening up the 2020 Delegate Race part of Election Graphs with the Iowa caucuses. But surprise surprise, as I was cleaning things up there and getting it ready for launch, I discovered that some delegates are already in motion.
No, it isn't superdelegates on the Democratic side. Due to rule changes this time around, they can't vote on the first ballot unless they mathematically can't make any difference to the outcome, so we aren't tracking them this time.
It is on the Republican side.
It turns out that on December 11th, the Hawaii Republican Party voted on delegate selection rules that just went ahead and bound their 19 delegates to Trump, bypassing any possible primaries or caucuses.
Other states have said they will do this, but Hawaii is the first state to make it official.
So Trump already has 19 of the 1277 delegates he needs to win the Republican convention.
Now, nobody expects any of the Republicans who are running against Trump to get much of anywhere. It currently seems unlikely they will even get any delegates at all.
So the graphs on the Republican side are likely to be very dull, and I probably usually won't even bother to show or mention them in these blog updates. But since this is the very first delegate update, here you go:
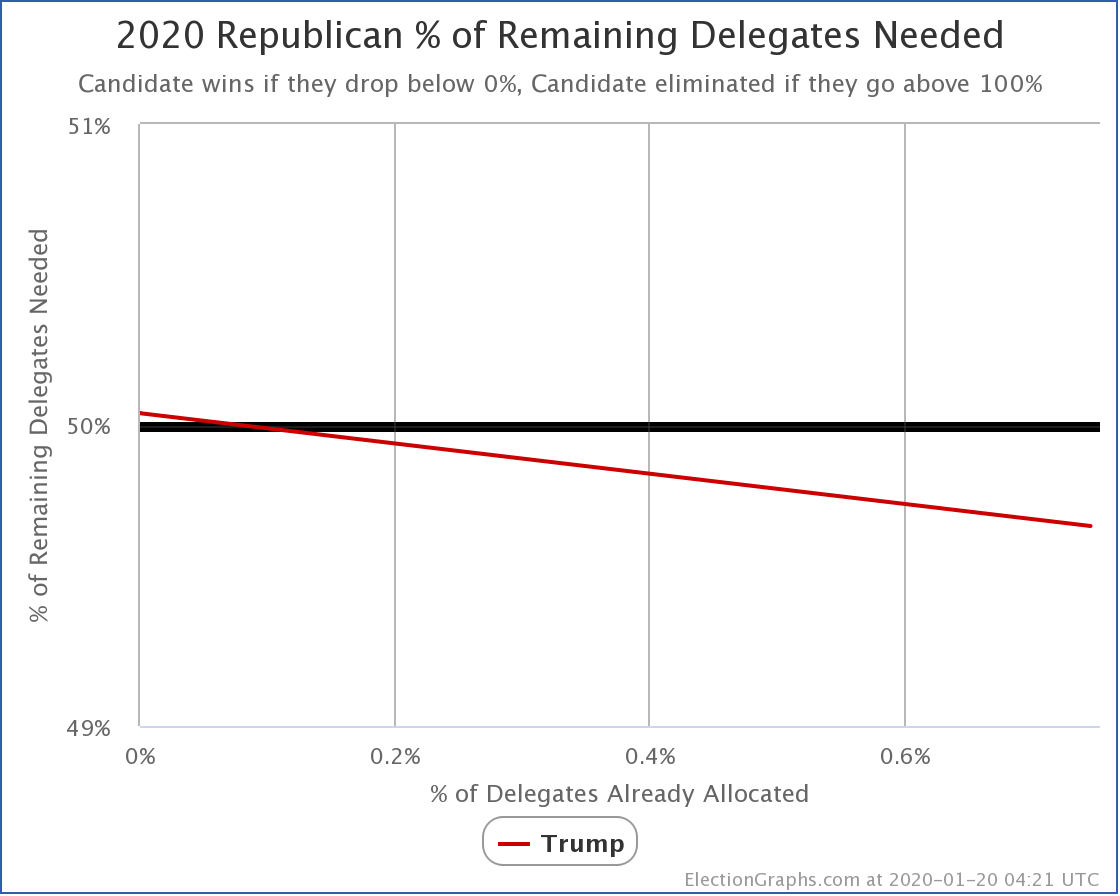
So out of 2552 Republican delegates, 19 have already been allocated. That is 0.74% of the delegates. Given that all 19 went to Trump, that means Trump needs 49.66% of the remaining delegates to clinch the nomination.
The next expected delegate allocation is actually also before Iowa. The Kansas Republicans will decide how to allocate their delegates at their convention which runs from January 31st to February 1st. I'm sure their choice will be a huge surprise to everyone.
And with that, the 2020 Delegate Race page is open for business!
288.8 days until polls start to close.
For more information:
This post is an update based on the data on the Election Graphs Electoral College 2020 page. Election Graphs tracks a poll-based estimate of the Electoral College. The charts, graphs, and maps in the post above are all as of the time of this post. Click through on any image to go to a page with the current interactive versions of that chart, along with additional details.
Follow @ElectionGraphs on Twitter or Election Graphs on Facebook to see announcements of updates. For those interested in individual poll updates, follow @ElecCollPolls on Twitter for all the polls as I add them. If you find the information in these posts informative or useful, please consider visiting the donation page.
One thought on “Mixed Results”