
It has been about 66 days since my last post about the general election polls.
That was right before the Republican Iowa Caucus kicked off the delegate chasing season.
Earlier this month both Trump and Biden clinched their nominations.
So now is a good time to start getting back to looking at the general election.
The one sentence TLDR:
- In order to win, Biden has got to fix his issues in Wisconsin, Pennsylvania, and Michigan, then pull in at least one more place, but there is still plenty of time to do that.
The slightly longer TLDR:
- Looking at the state by state polls, Trump is still doing very well, and Biden is not.
- Ignoring the ups and downs in between, overall state by state polls have continued to move toward Trump over the past two months. It is possible Trump is near his ceiling, but there has not been a sustained movement back toward Biden yet.
- No states crossed the center line over the last two months though, so the electoral college picture still looks pretty similar to how it did last time.
- Trump is still polling FAR better than he did at the comparable time in either 2016 or 2020.
- This all comes down to the fact Trump is leading in the poll averages for Wisconsin, Pennsylvania, and Michigan. To win, Biden needs to win all three of these states, plus at least one more electoral vote from somewhere else, or get surprise wins elsewhere to make up for losing one of those.
- The leads in all three of these states are small enough (under 5%), and the number of undecideds high enough, that this situation could change very quickly as people start paying attention.
- My "probabilistic views" have Trump at between 96.6% to 99.8% to win depending on how correlated the states are, but it is critical to remember this is conditional on:
- "Polls don't change at all between now and November" (and we all know they will change a lot), and
- "The difference between final EG averages and actual election results is similar in 2024 to what we saw from 2008-2020" (which basically means the averages tend to UNDERESTIMATE the Republican by 1.3% percent in the close states, but there are at least some indications polling may be underestimating the Democrat this time).
In other words, and I added a bunch of disclaimers on the site about this, everything here represents a snapshot of NOW. Interpreting the data on this site as a true prediction of November would be a mistake. Things don't become truly predictive until VERY close to the election. There can be large movements in the scale of weeks.
Instead, the right way to think about the information here is as a gauge of how much work candidates have to do, and where they have to do that work.
Right now that translates into "In order to win, Biden has got to fix his issues in Wisconsin, Pennsylvania, and Michigan, then pull in at least one more place."
I do have some ideas but how to model a probability that actually takes into account how the averages may evolve in the time remaining before the election, but I honestly doubt I will have time to execute on that for the 2024 cycle. Maybe for 2028.
OK, now all the specific charts and graphs for those who want to dig in. You should of course also feel free to just explore all the data on the site yourself.
I'm going to restructure how I do these update posts a little bit. As we get closer to the election, I'm going to need to put them out more often, which means I need to make them easier for me to do. Which means more "here is the snapshot from the site" with a little less narrative.
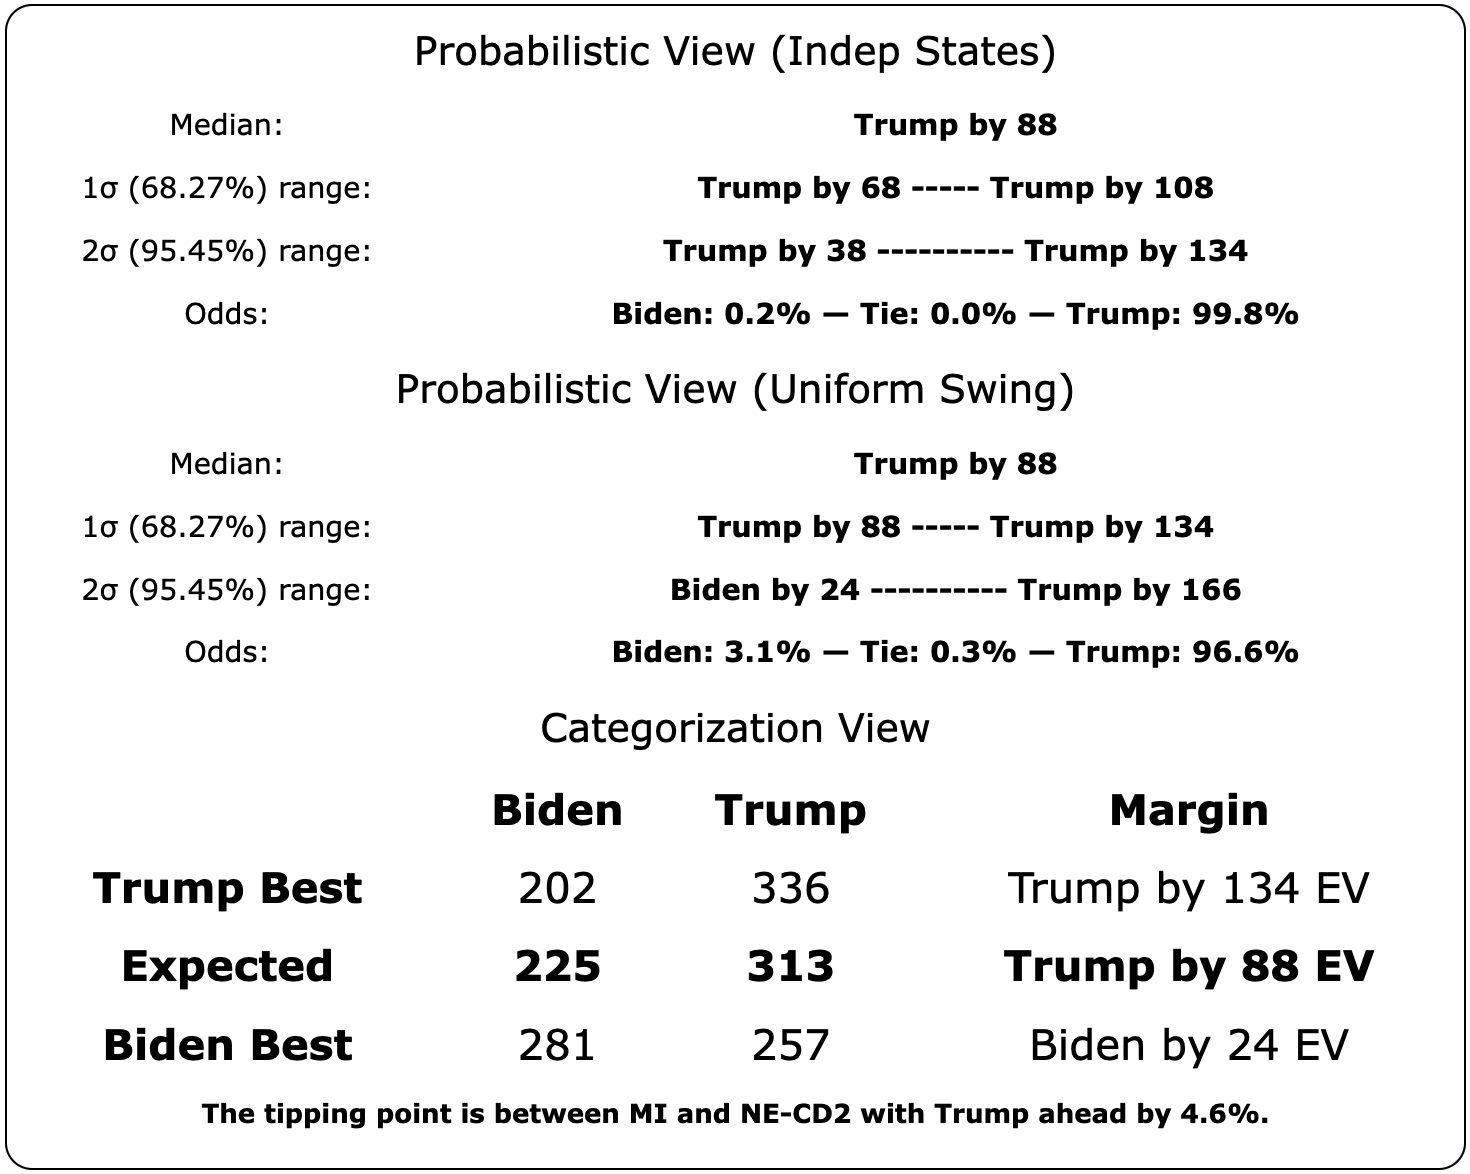
This is the overall summary of all the main stats. Keep in mind all the disclaimers I gave at the top of this post. All three views show Trump heavily favored based on current polling, with a Biden win just barely in the range of possibility. It would be a major upset, and representative of huge polling errors if it looked like this in November and Biden won.
But as I said, and will emphasize once again, we have a long way until the election yet, and things can change quickly.
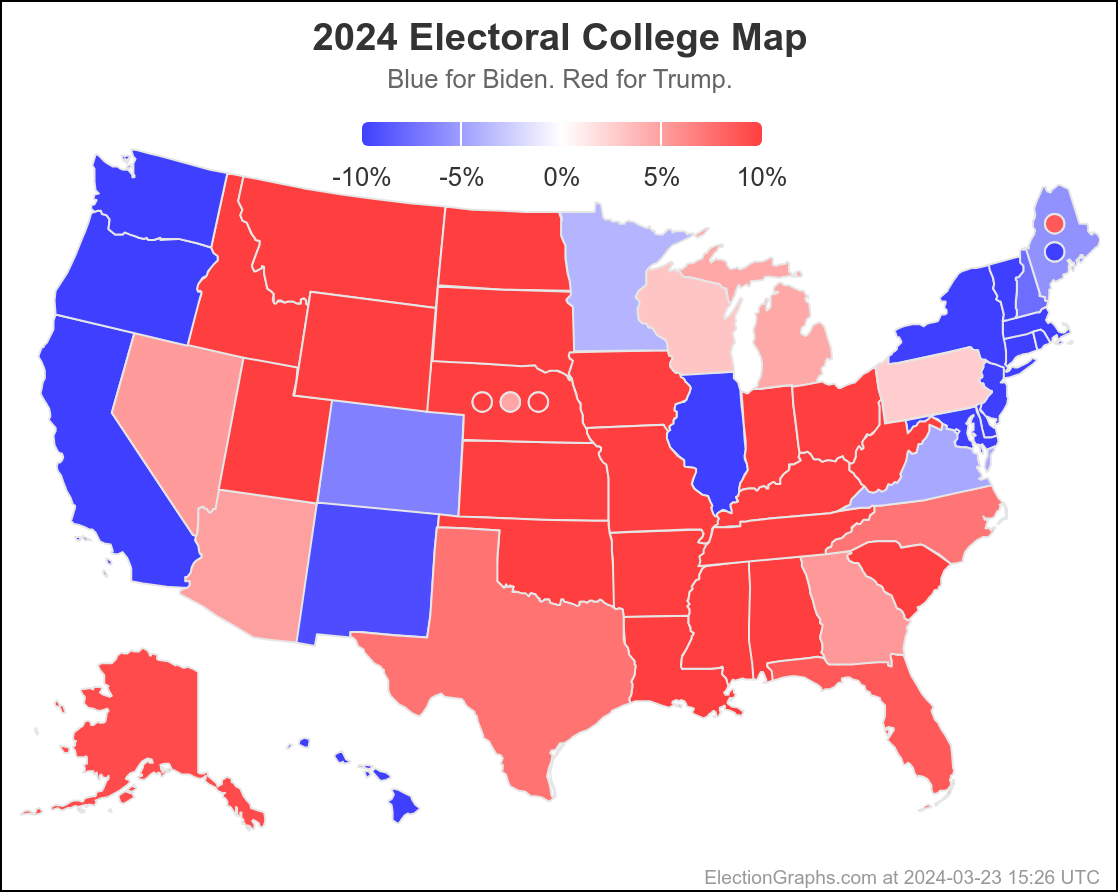
That's a lot of red. Of course land area doesn't correspond to either population or number of electoral votes. (And Alaska doesn't represent its true area anyway.) But this still gives you an at a glance view. There are only a small number of states with light pastels indicating a really close race at the moment. As usual, the battle will only be in a handful of states.
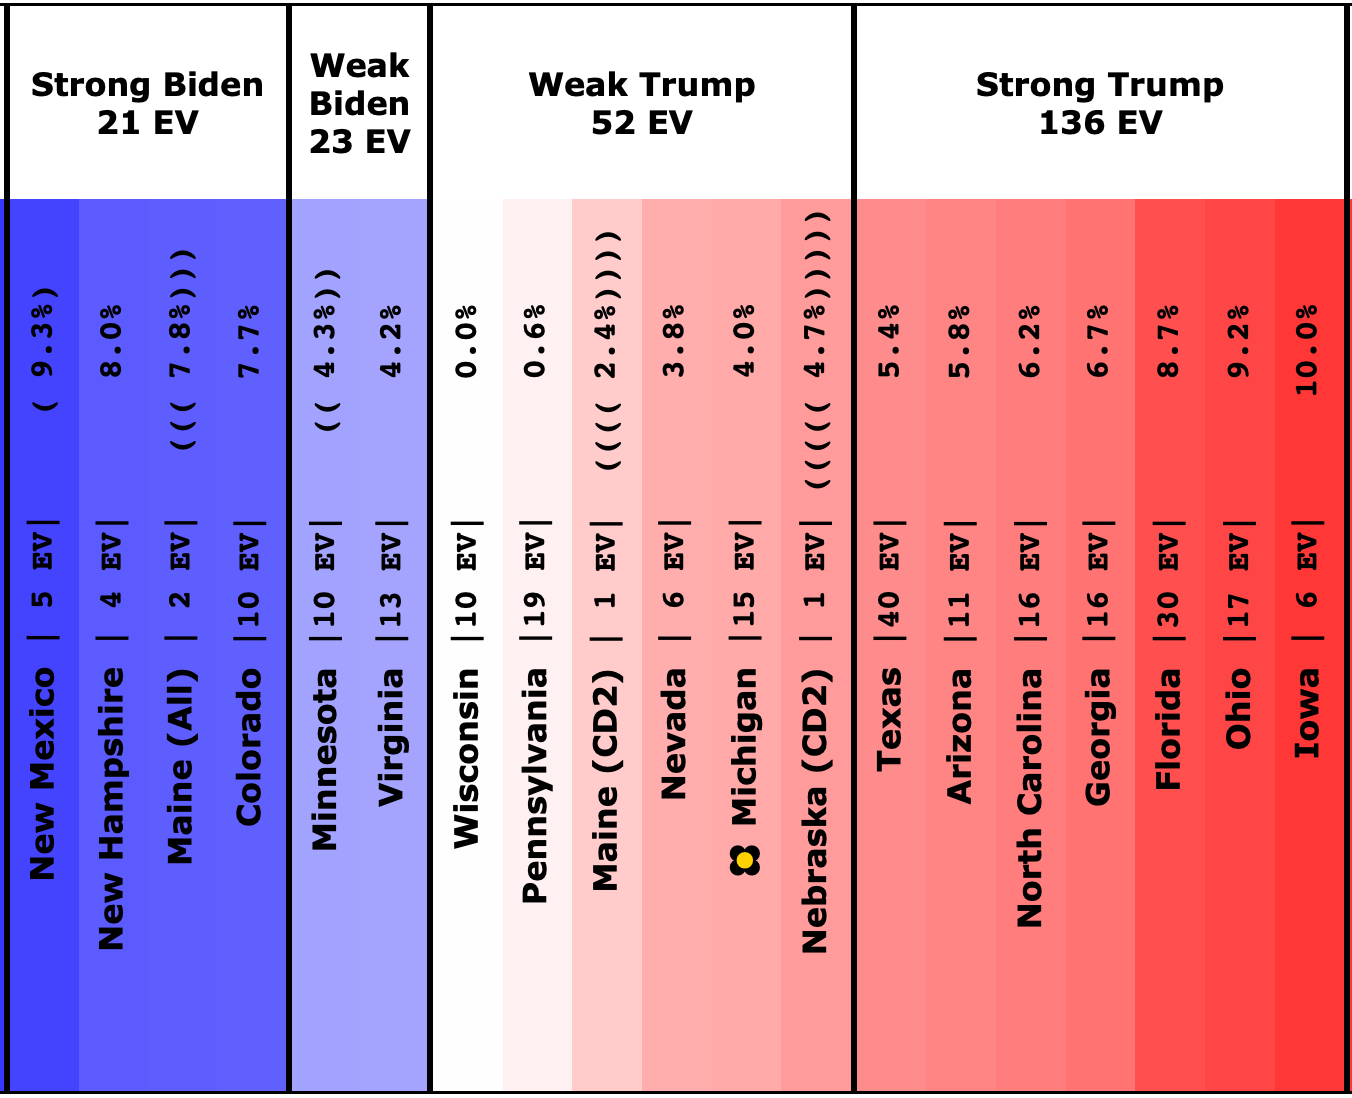
Looking at the numbers for the subset of the states that are even remotely in contention (margin less than 10%), including how they have changed since last time:
As of January 15th:
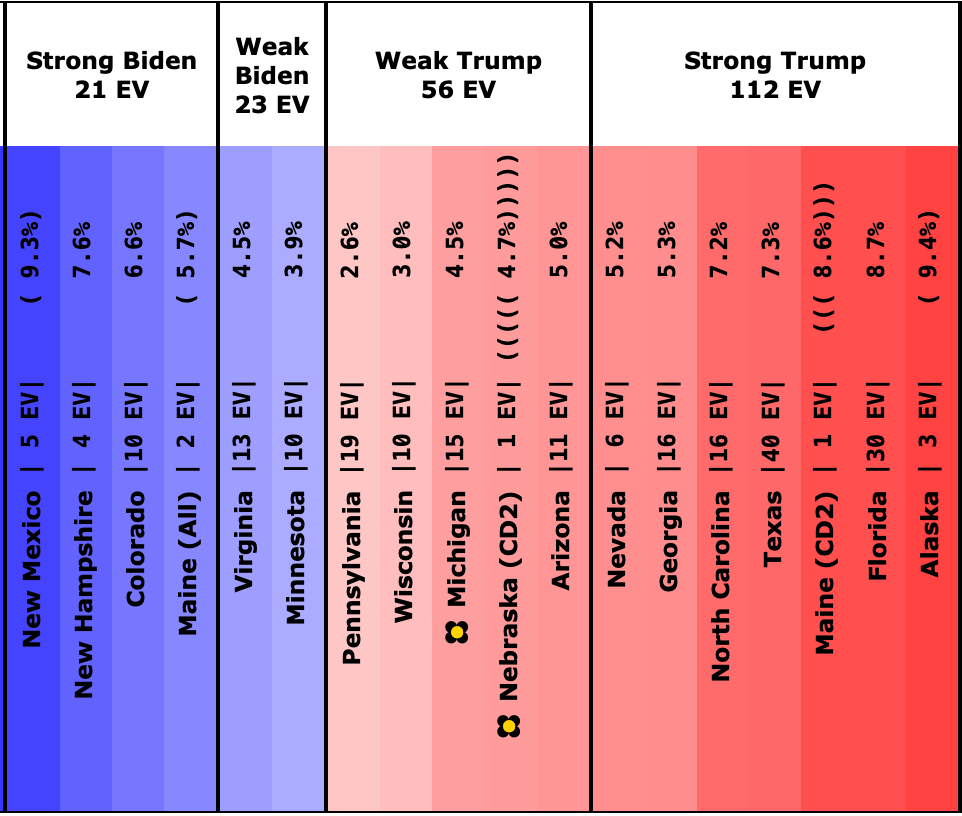
As of March 23rd:
Net movement toward Trump:
- Maine-CD2 (1 EV): Trump by 2.4% -> Trump by 8.6% (Trump+6.2%)
- Wisconsin (10 EV): Trump by 0.0% -> Trump by 3.0% (Trump+3.0%)
- Maine-All (2 EV): Biden by 7.8% -> Biden by 5.7% (Trump+2.1%)
- Pennsylvania (19 EV): Trump by 0.6% -> Trump by 2.6% (Trump+2.0%)
- Texas (40 EV): Trump by 5.4% -> Trump by 7.3% (Trump+1.9%)
- Ohio (17 EV): Trump by 9.2% -> Trump by 10.8% (Trump+1.6%)
- Nevada (6 EV): Trump by 3.8% -> Trump by 5.2% (Trump+1.4%)
- Colorado (10 EV): Biden by 7.7% -> Biden by 6.6% (Trump+1.1%)
- Iowa (6 EV): Biden by 10.0% -> Biden by 11.1% (Trump+1.1%)
- North Carolina (16 EV): Trump by 6.2% -> Trump by 7.2% (Trump+1.0%)
- Michigan (15 EV): Trump by 4.0% -> Trump by 4.5% (Trump+0.5%)
- Minnesota (10 EV): Biden by 4.3% -> Biden by 3.9% (Trump+0.4%)
- New Hampshire (4 EV): Biden by 8.0% -> Biden by 7.6% (Trump+0.4%)
No net movement:
- New Mexico (5 EV): Biden by 9.3%
- Nebraska-CD2 (1 EV): Trump by 4.7%
- Florida (30 EV): Trump by 8.7%
Net movement toward Biden:
- Virginia (13 EV): Biden by 4.2% -> Biden by 4.5% (Biden+0.3%)
- Arizona (11 EV): Trump by 5.8% -> Trump by 5.0% (Biden+0.8%)
- Georgia (16 EV): Trump by 6.7% -> Trump by 5.3% (Biden+1.4%)
- Alaska (3 EV): Trump by 10.8% -> Trump by 9.4% (Biden+1.4%)
No states crossed the center line at all, so the electoral college picture is very similar to what it was two months ago, but Trump has gotten stronger in states he already was ahead in, and Biden has gotten weaker in states where he was ahead.
There are four exceptions listed above, so there are a few places where Biden has improved, but everywhere else, including the key battleground states, Trump has improved.
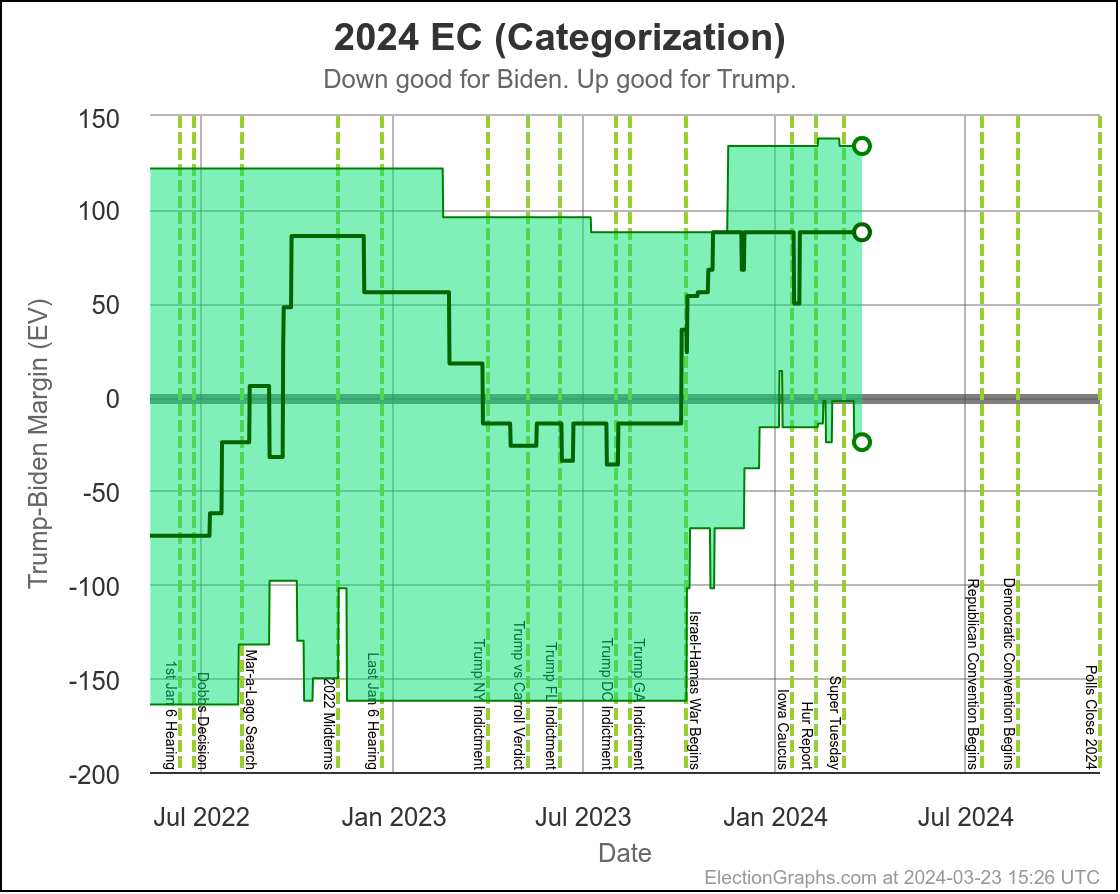
Sticking to the categorization view for now, so just taking the poll averages at face value and seeing who leads where, and counting any state where the margin is less than 5% as "in play" we see the chart above.
Basically, the trend from October to December was more and more states moving to a Trump lead margin of more than 5%, putting those states out of reach for Biden as far as this view is concerned, along with a few states where Biden had been ahead by more than 5% dropping to a smaller Biden lead, putting them in reach for Trump.
The range between the Biden best case and the Trump best case narrowed from 250 EV down to 150 EV. Just a lot fewer electoral votes in play, while the "expected" case moved from Biden by 14 to Trump by 88 showing that most of this was movement away from Biden.
Those trends were all about the end of 2023 though.
So far in 2024, there has been limited movement between the categories. A little jittering here and there as various states have crossed category boundaries (often temporarily) but no big lasting directional moves. Most of the changes we looked at earlier on a state by state basis stayed within the broad categories. Thus Trump is stronger when you look at individual states, but the overall electoral college picture hasn't changed too much.
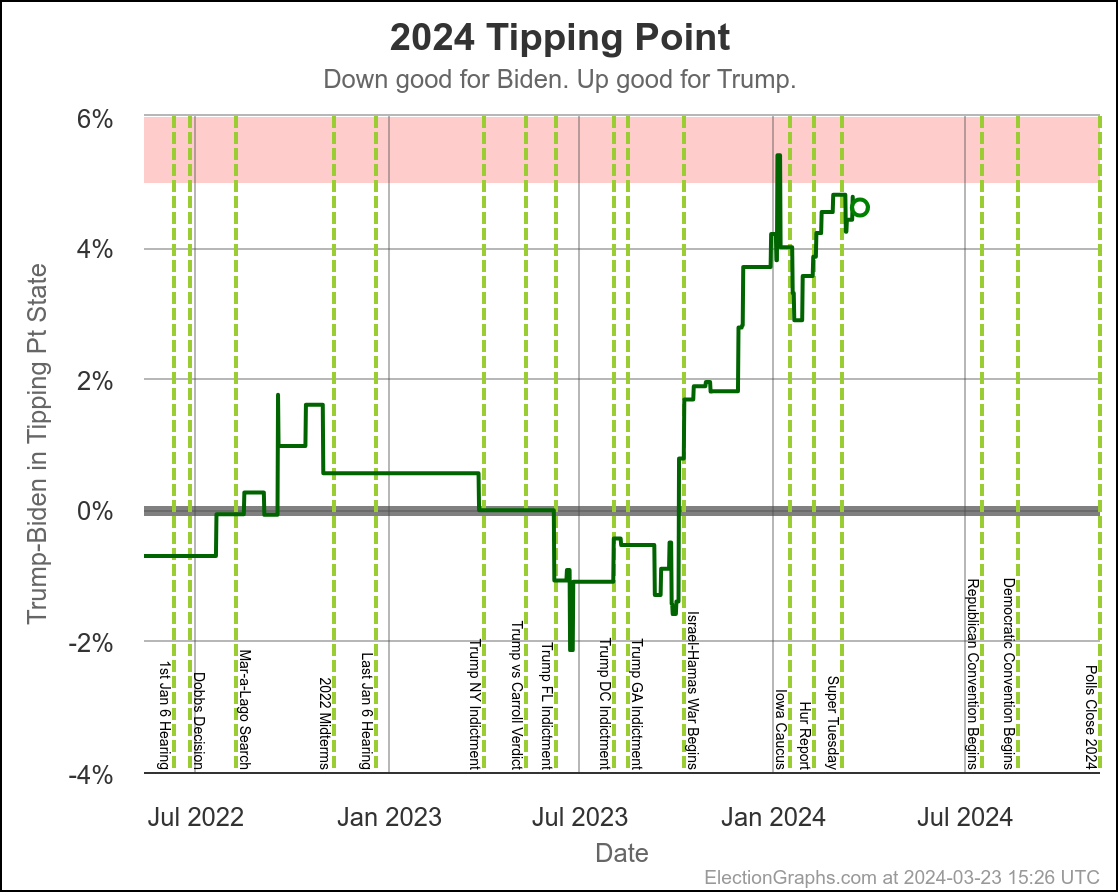
The other way of looking at this, before bringing in the probabilistic models, is what I call the "tipping point". This is the margin in the state that puts the winning candidate over the edge of you order the states by margin. (Or the average of the margins in the two states in the middle if the states are ordered in such a way that there could be a 269-269 tie.)
Basically, this is like looking at a popular vote margin, but adjusted for the structure of the electoral college. In this view you can also see the Biden collapse starting in October, but the time since the new year shows a bit more back and forth, with a bit of improvement for Biden in January, followed by a trend back toward Trump again in February. Then just some jiggling around in March, with no clear trend.
The tipping point shows us that at the moment Biden needs almost a 5% swing to take the lead again in the categorization view. That is a lot, but not out of the question, especially since polls are still showing significantly more than that 5% in all the close states still answering with 3P candidates or "undecided" when asked about the general election.
Now that both candidates have clinched their nominations, the closer we get to November, the smaller that "neither" category should get. Both 3P and "undecided" tend to collapse as elections approach. And how those people end up splitting between, Trump, Biden, sticking with their 3P, or just not voting will probably end up being the deciding factor in the election, more so than Biden or Trump supporters actually changing their minds and flipping to the other side.
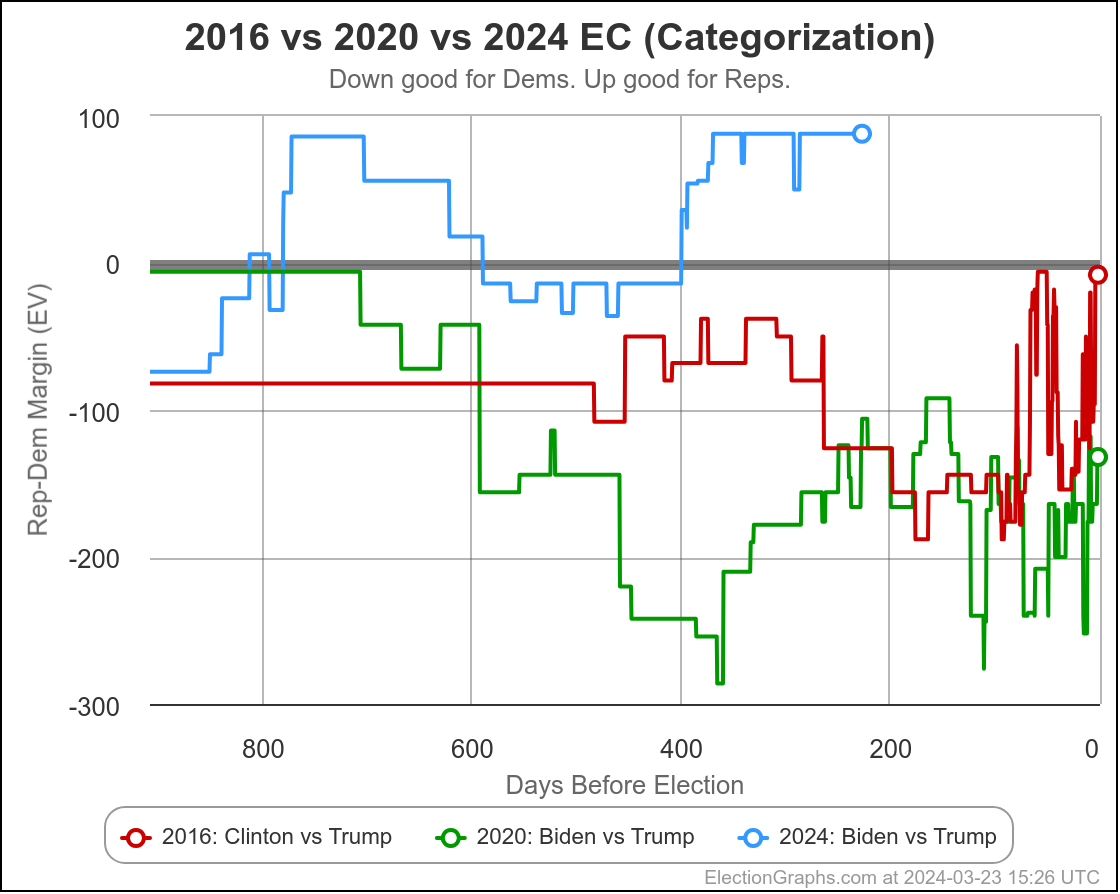
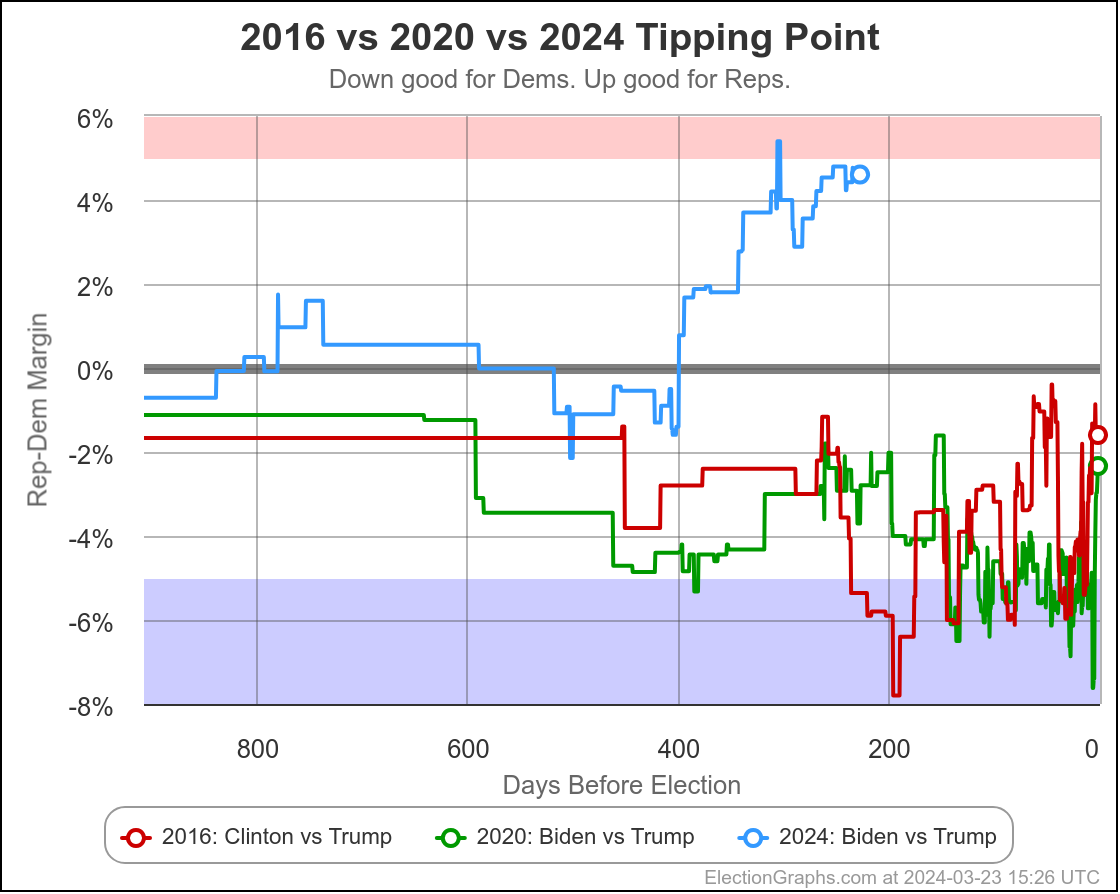
These two are the same as the previous two charts, but with the added context of 2016 and 2020.
For Biden supporters, these should be the scariest charts on my site. They show just how much better Trump is doing in polling so far this cycle than he did in either 2016 or 2020.
He was always behind in the polling in both those cycles. He won in 2016. He came close in 2020. The fact that he has been outperforming both of those years consistently, and has been straight up ahead most of the time should be very concerning.
For all the reasons I gave at the beginning of the post, there are lots of reasons to think the situation might be very volatile, and that Trump may be near his ceiling. But the Biden folks would surely feel a lot better if the polling started looking more like 2020, or ideally better than 2020 for them. The fact that they instead look considerably worse than 2016 has to be worrying.
You either have a real situation where Biden is behind and has to make up a lot of ground, or polls are massively underestimating the Democrat this time around, unlike the last two cycles, where they underestimated the Republican.
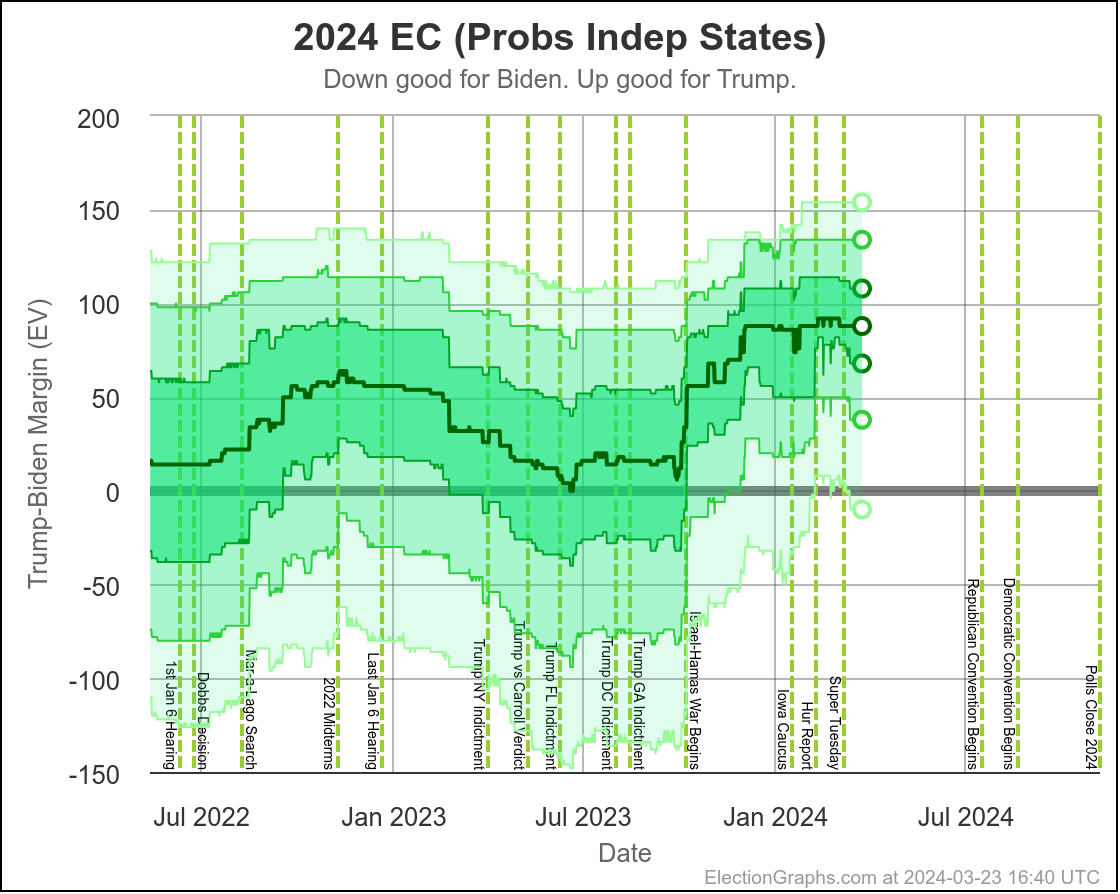
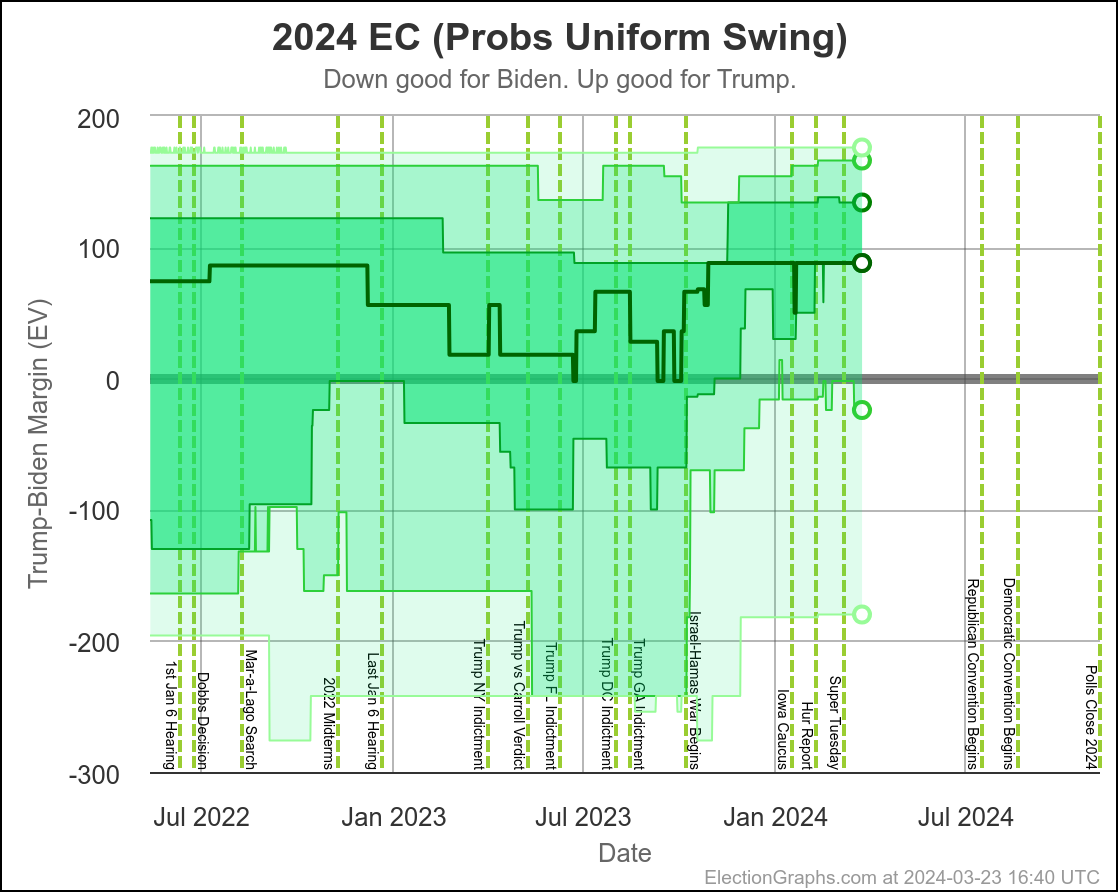
These views show the range of possibilities for the electoral college margin in the two probabilistic models. These look at the odds in each state, based on assuming the distribution of the difference between the final election graphs average and the actual election results looks similar to the aggregate deltas from 2008 to 2020, then I do automated Monte Carlo simulations to see what the overall general election looks like based on all those state results.
The "Independent States" one assumes no relation in how far off the actuals are from the averages in one state compared to the other. The "Uniform Swing" one assumes that that delta will be the same in every state. Both of these are extremes. The "truth" is somewhere in between.
The darker the band, the more likely a result in that range. You can easily see that right now all the dark colors are in the "Trump wins" part of both graphs, with only lighter colors stretching over to the "Biden wins" part of the graphs.
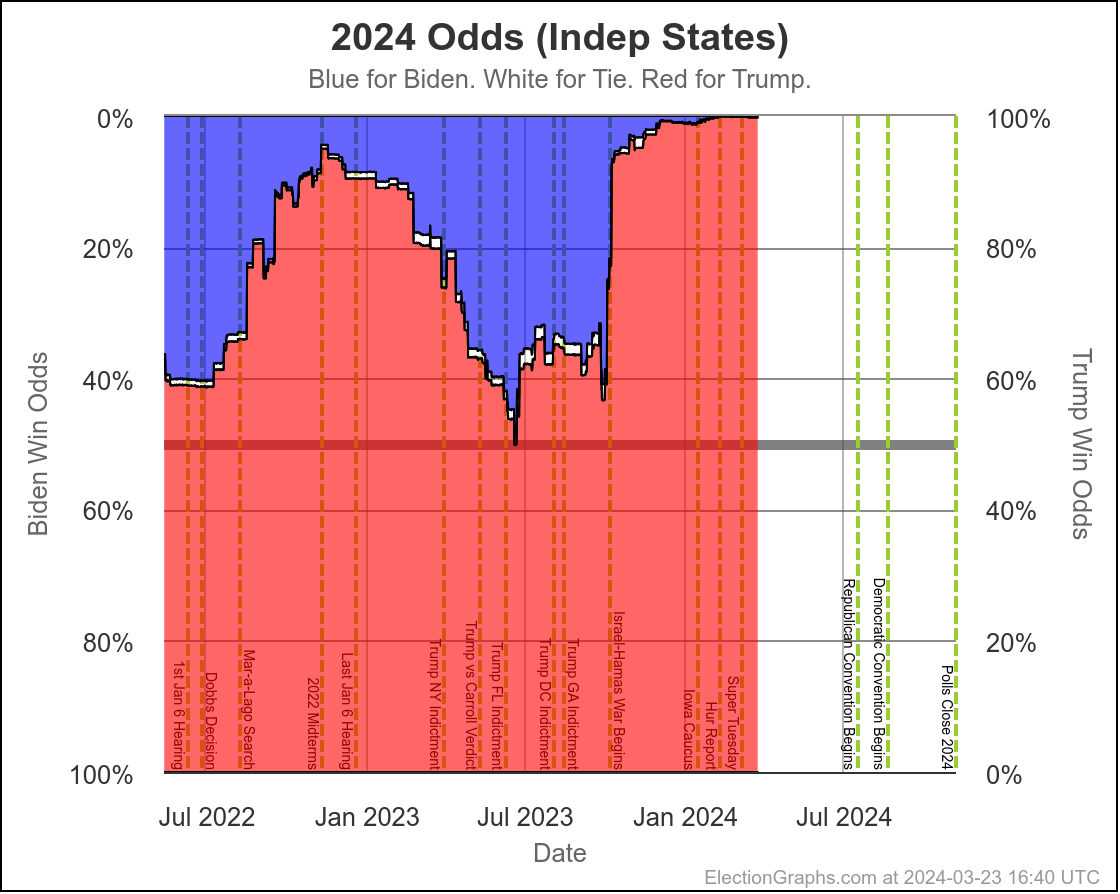
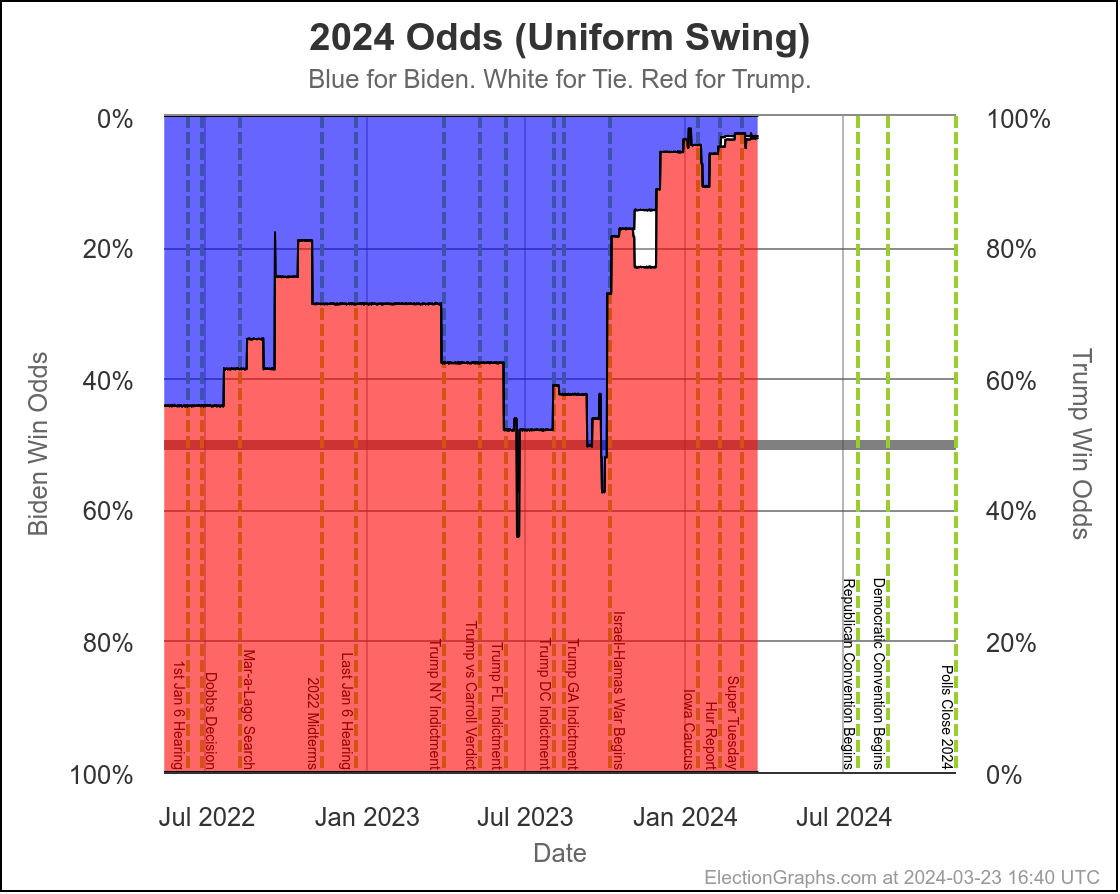
These two graphs translate the green margin bands into straight up "chance of winning".
I'll say again, because this is very important, this is:
- Assuming polls look the same on Election Day that they do right now. (Alternately formulated as "if the election was today".)
- Assuming final poll averages in the close states differ from the actual elections results in a way similar to the aggregate errors in 2008 to 2020. (Alternately formulated as "polls underestimate the Republican again".)
Both of those are big assumptions.
So you shouldn't really read this as "Trump has a 96.6% to 99.8% chance of winning."
Instead read it as "Trump is ahead in all the critical states right now, Biden has a lot of work to do if he is going to catch up and win."
Of course, it might not be Biden doing work, it could also be Trump doing things that hurt himself. You never know. But things have to happen to move things in the Biden direction. If things stay how they are, Trump is heavily favored.
And there we are. That's it for today. Hopefully I don't let it go another 66 days before posting a summary. But I make no promises. I have a lot of things going on and sometimes it is hard to make time to do these posts.
But the site itself is updated pretty promptly whenever new polls come out. Almost always within 24 hours, sometimes a lot less. Right now there are almost always multiple new state level polls every week. By the time we get to September, there will be multiple polls almost every single day. The last three weeks before the election, I'll probably take vacation days off of my day job just to keep up with the deluge of new polls every day. 🙂
So please bookmark and explore the site itself regularly, and also follow ElectionGraphs on Mastodon for daily summaries and posts whenever new polls come out.
227.1 days until polls start to close
Hold on tight.