It has only been 3 days since my last post. Absent something unexpected, after this one I will probably only do one more post before actual election results start streaming in. That final one will be on Election Day proper, but before polls start to close, assuming things go as planned.
Also, for anybody interested, my Curmudgeon's Corner cohost Ivan and I will be live streaming our reactions as the situation unfolds on election night over at the CC YouTube channel. We expect to start at 0 UTC on election evening. That's 7 PM Eastern, 4 PM Pacific.
I'll be doing that instead of live blogging results here as they come in. I will probably also post updates over at @ElectionGraphs@newsie.social on Mastodon if you want to check in on that.
Note as you read this update, this is all based on how things stood as of 0 UTC on November 3rd when I started this blog post. Polls have been coming in fast and furious, so things may have changed by the time I finish this post, let alone by the time you read this. As usual, go to the Election 2024 main page for all the most up to date data.
OK. Lets do that TL;DR and try to keep it actually short this time:
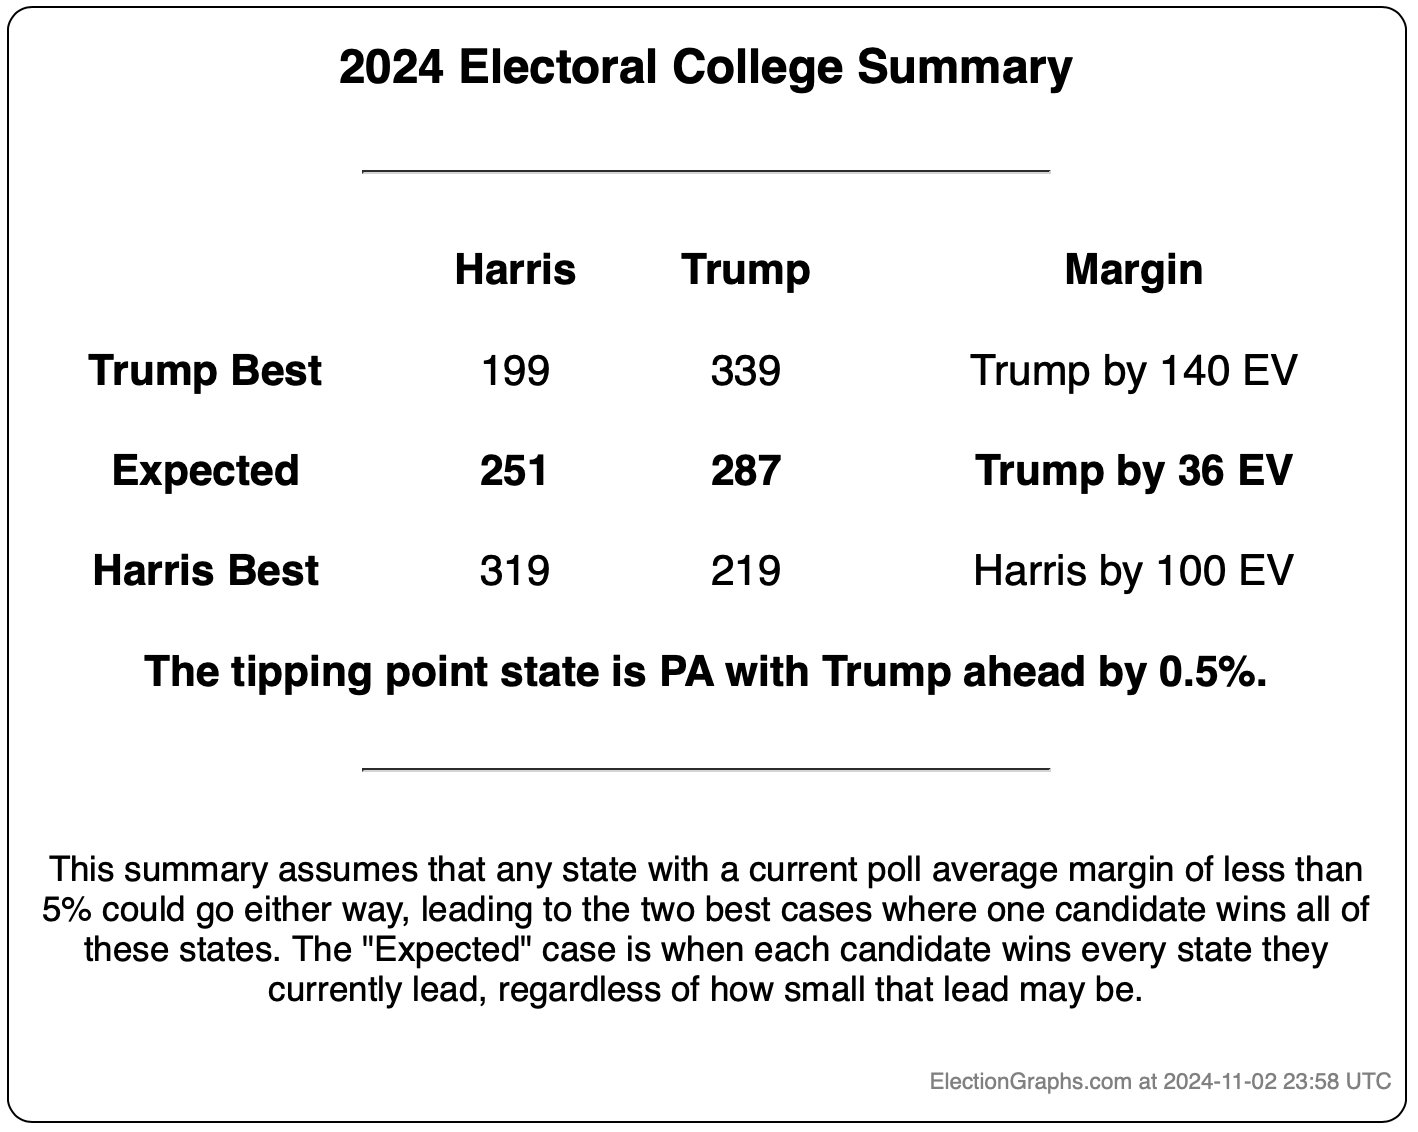
Harris's position overall has improved a little bit since three days ago (the tipping point went from Trump by 1.1% to Trump by 0.5%), but the overall situation has not changed.
If the polls are underestimating Trump right now, he wins.
If the polls are underestimating Harris right now, she wins.
If the polls are actually close to right, then it all comes down to Pennsylvania, which could go either way.
Any outcome from Harris winning by 100 electoral votes to Trump winning by 140 should not be considered surprising. There are just that many close states right now.
If you restricted the whole analysis to only the highest quality pollsters, the tipping point would change from Trump by 0.5% to Harris by 0.3%. So the lower quality polls continue to make things look worse for Harris, by about 0.8% this time, and that would flip who is ahead.
The new Selzer poll showing Harris actually ahead in Iowa is a possible indicator that we are in the "polls are underestimating Harris" scenario. Maybe even by a large amount. (Even though it is only a single poll, it is one that has been extremely accurate in the past.) But we won't actually know until the votes are counted.
OK, let's start with how things have moved since last time.
Believe it or not, there have been TONS of new polls in the last few days.
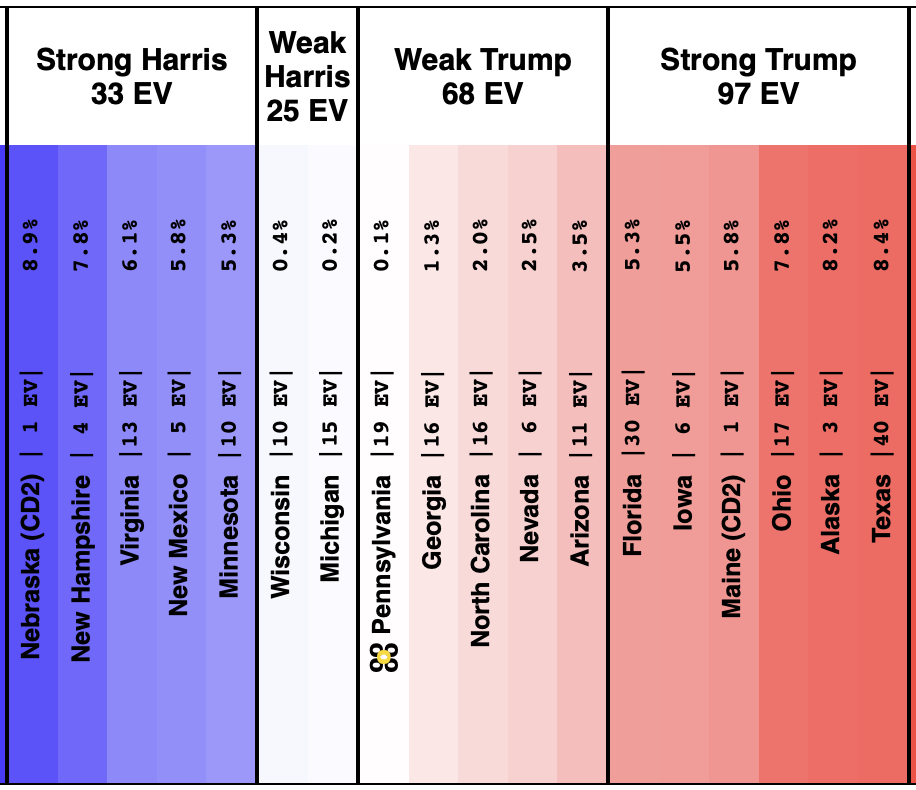
Here is the new spectrum of states with margins under 10%:
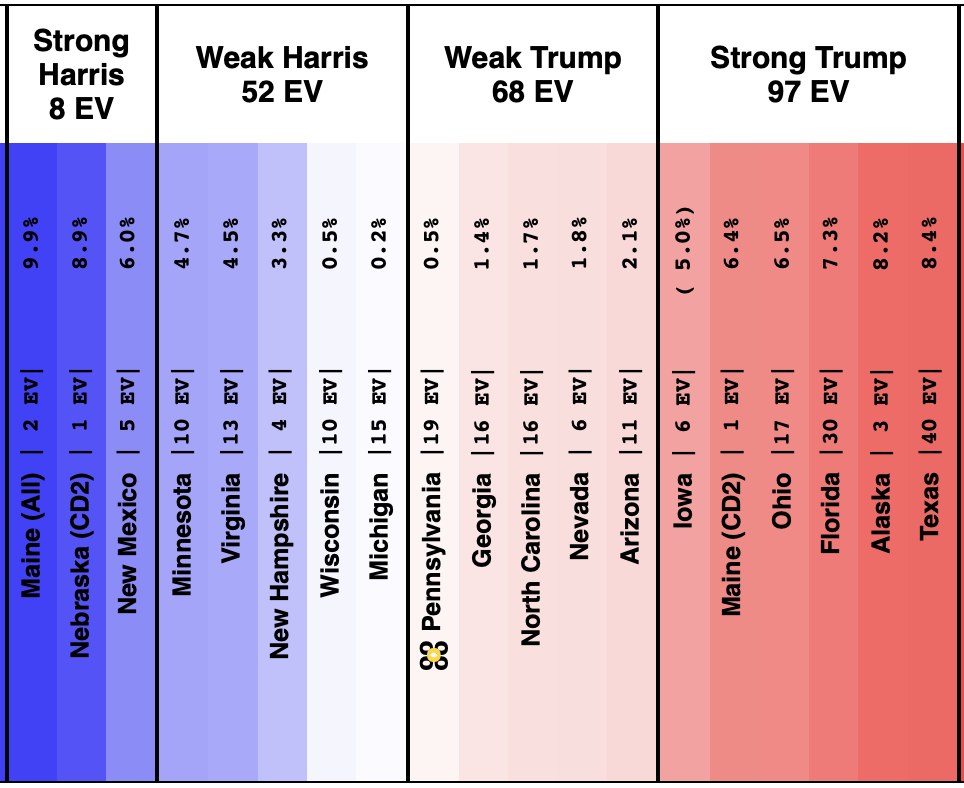
Comparing to the status in the post from 3 days ago:
Moved toward Trump:
- New Hampshire (4 EV): Harris by 8.0% -> Harris by 3.3% (Trump+4.7%)
- Maine-CD2 (1 EV): Trump by 4.4% -> Trump by 6.4% (Trump+2.0%)
- Minnesota (10 EV): Harris by 6.3% -> Harris by 4.7% (Trump+1.6%)
- New Mexico (5 EV): Harris by 7.4% -> Harris by 6.0% (Trump+1.4%)
- Wisconsin (10 EV): Harris by 1.3% -> Harris by 0.5% (Trump+0.8%)
- Virginia (13 EV): Harris by 5.2% -> Harris by 4.5% (Trump+0.7%)
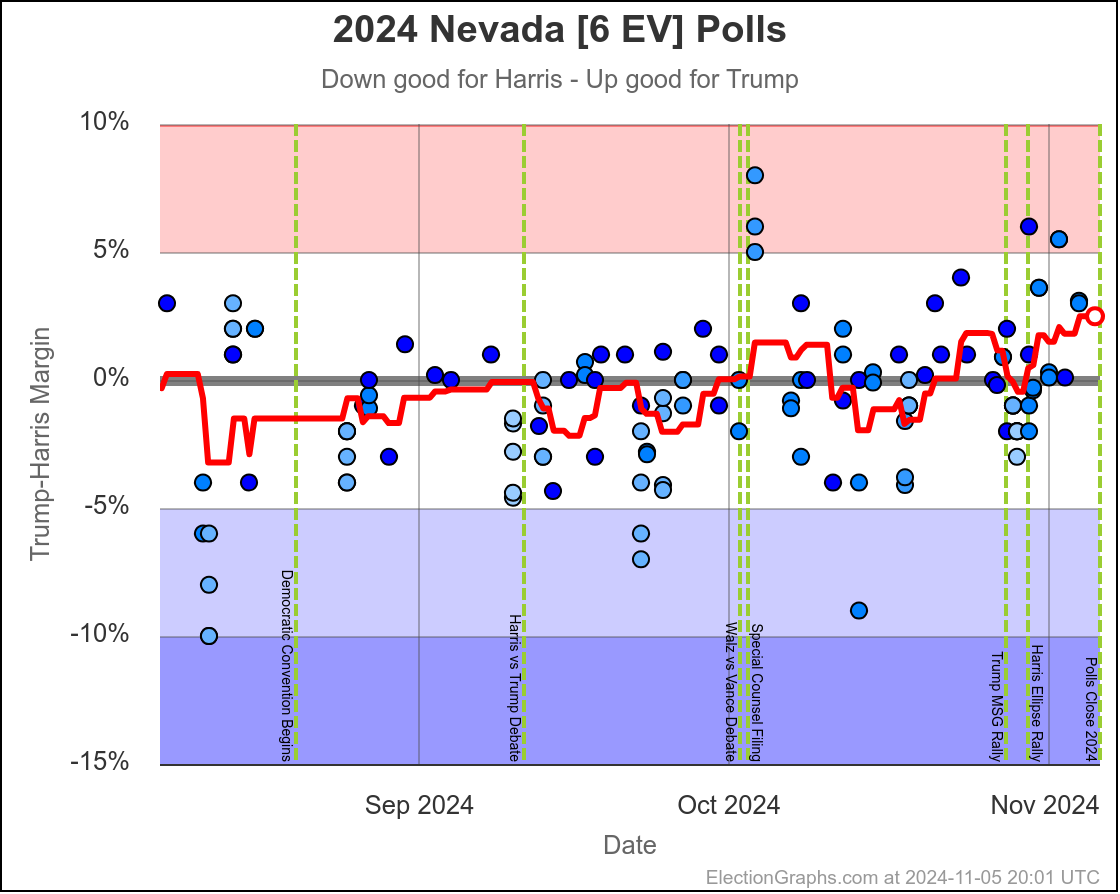
- Nevada (6 EV): Trump by 1.1% -> Trump by 1.8% (Trump+0.7%)
- Iowa (4 EV): Trump by 4.4% -> Trump by 5.0% (Trump+0.6%)
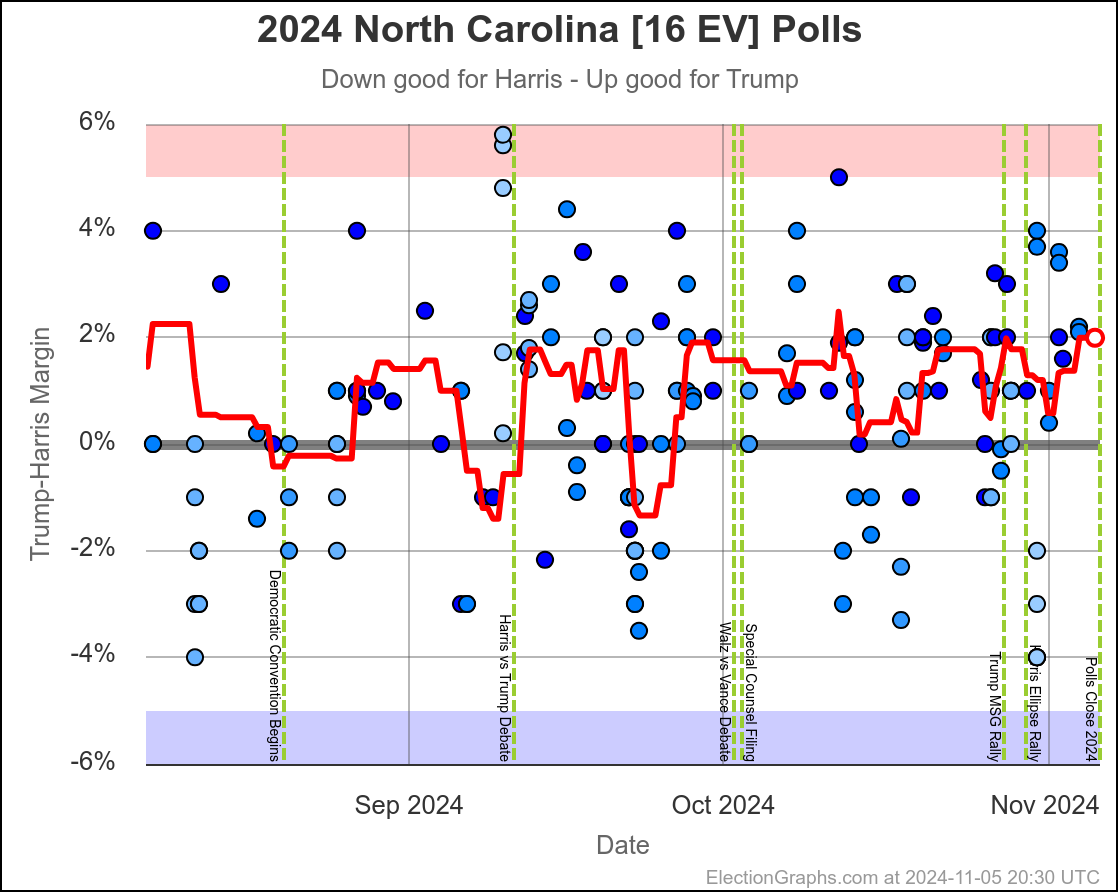
- North Carolina (16 EV): Trump by 1.4% -> Trump by 1.7% (Trump+0.3%)
- Maine-All (2 EV): Harris by 10.1% -> Harris by 9.9% (Trump+0.2%)
No movement:
- Nebraska-CD2 (1 EV): Harris by 8.9%
- Alaska (3 EV): Trump by 8.2%
- Texas (40 EV): Trump by 8.4%
Moved toward Harris:
- Michigan (15 EV): Trump by 0.2% -> Harris by 0.2% (Harris+0.4%)
- Pennsylvania (19 EV): Trump by 1.1% -> Trump by 0.5% (Harris+0.6%)
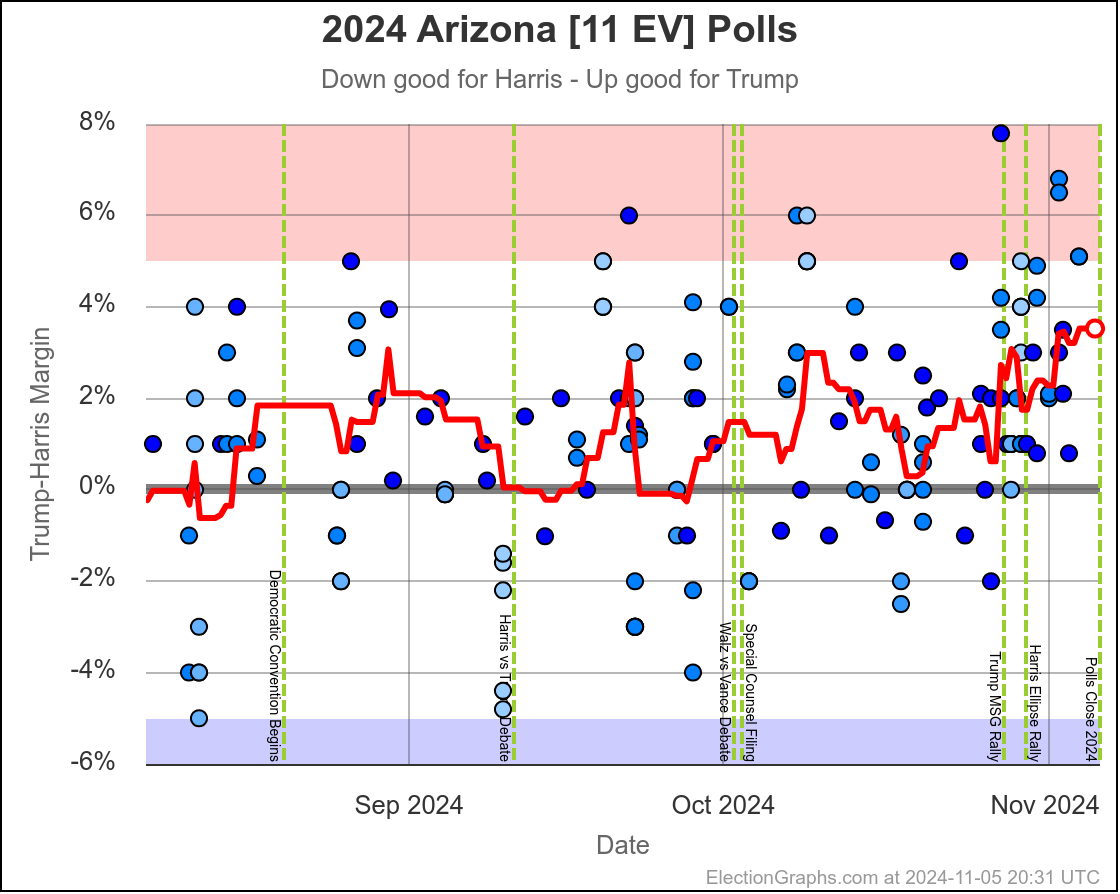
- Arizona (11 EV): Trump by 2.7% -> Trump by 2.1% (Harris+0.6%)
- Florida (30 EV): Trump by 7.9% -> Trump by 7.3% (Harris+0.6%)
- Ohio (17 EV): Trump by 7.3% -> Trump by 6.5% (Harris+0.8%)
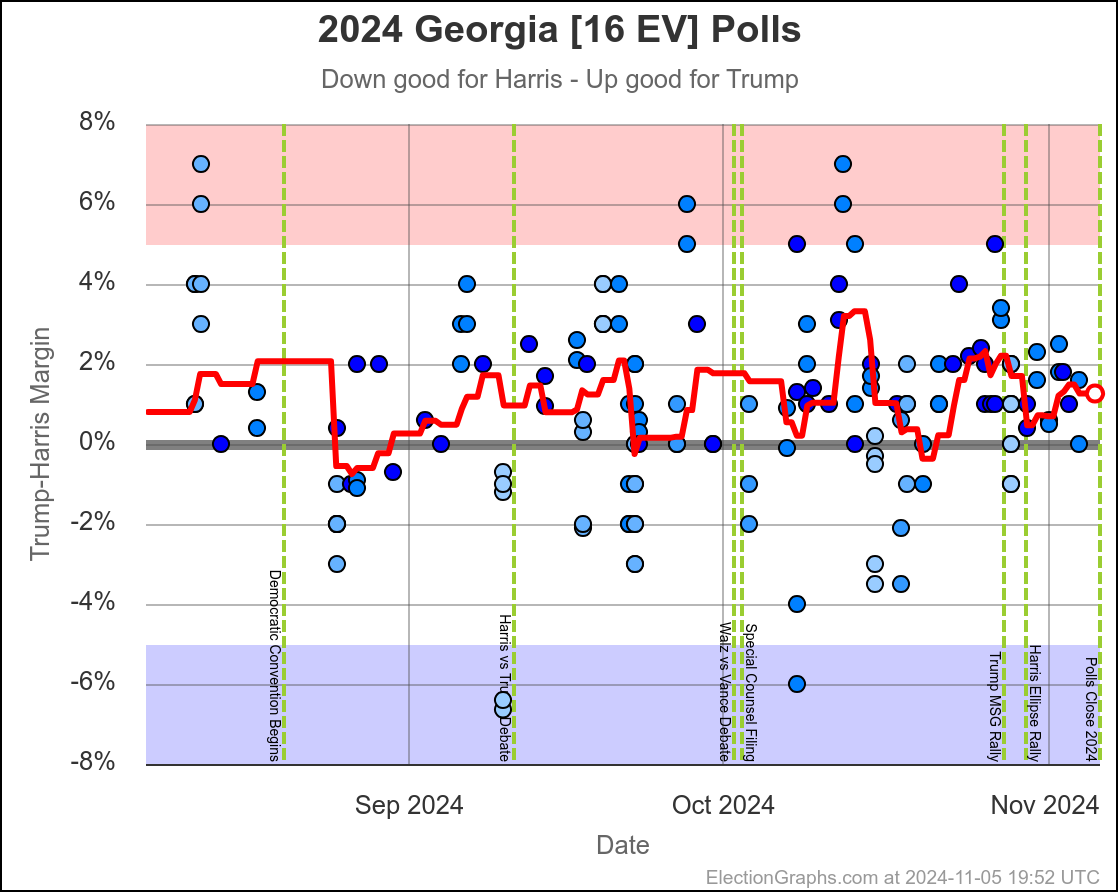
- Georgia (16 EV): Trump by 2.3% -> Trump by 1.4% (Harris+0.9%)
10 moving toward Trump vs only 6 moving toward Harris.
But because of WHICH states were moving in each direction, the tipping point moved from Trump by 1.1% in Pennsylvania to Trump by 0.5% in Pennsylvania, so an 0.6% overall movement toward Harris in the last few days.
But as I mentioned last time, in addition to "real" movement, there is just a lot of jitter as pollsters come in and out of the average. And I didn't do it last time, but this time I'll once again look at how these state by state averages would change if you only looked at pollsters rated 2.5 or more out of 3 on 538's pollster ratings instead of just including everything.
So let's look at that for the 7 key swing states for overall trends, then we'll see how pollster rating change the averages. This is going to look pretty similar to 3 days ago. I don't think my fundamental evaluation of the patterns in any of these states has really changed.
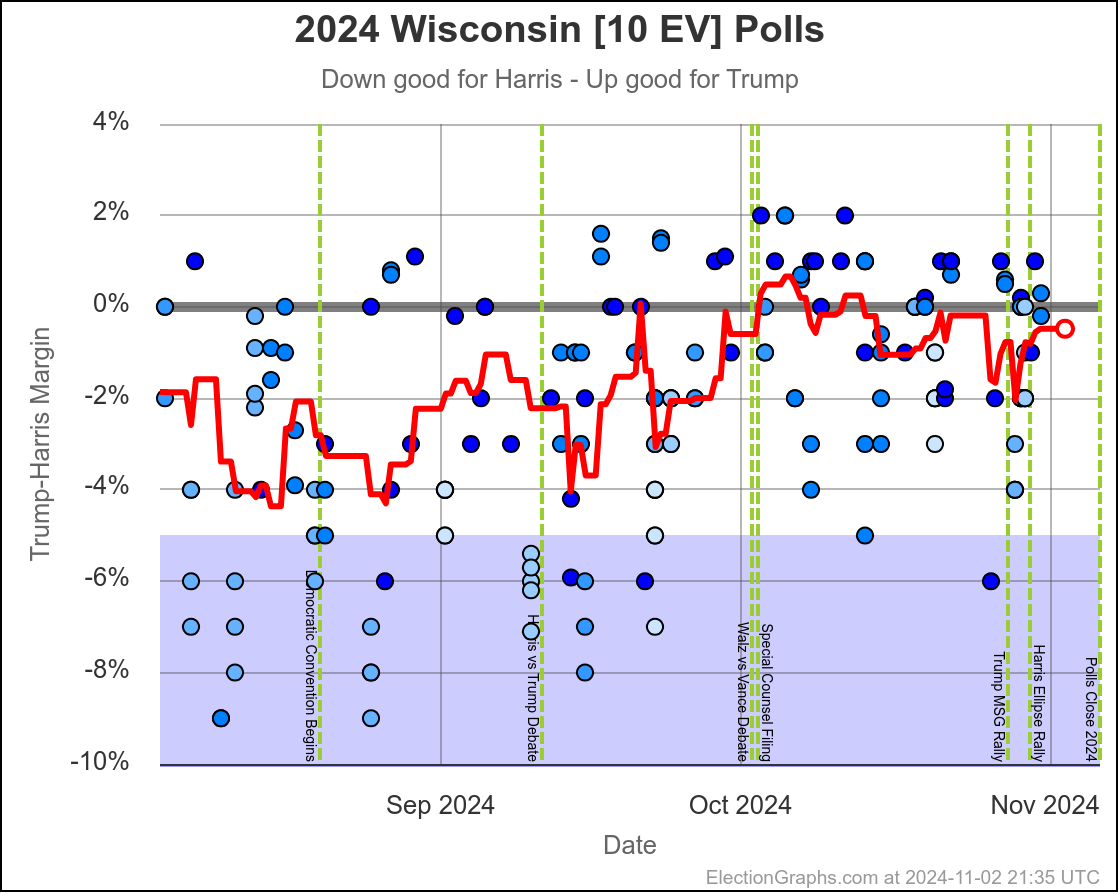
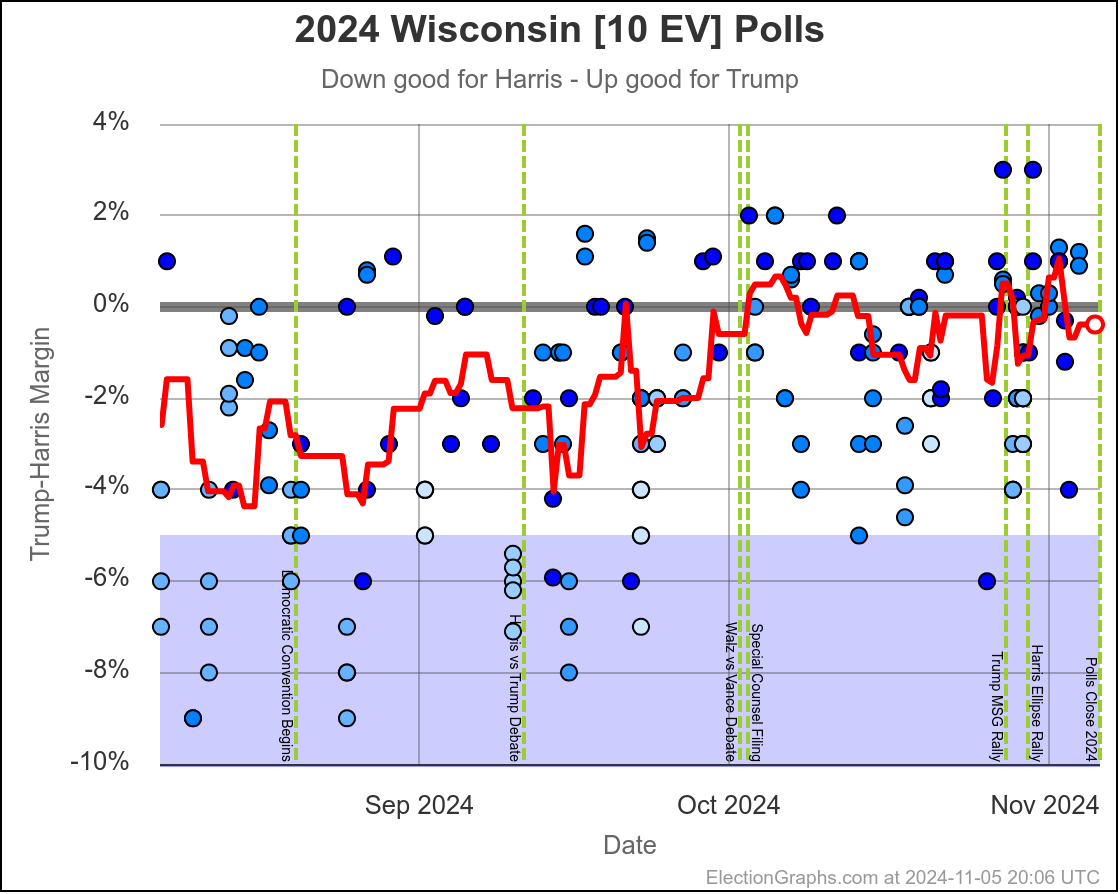
Just eyeballing the trend, absent a systematic polling error, Wisconsin looks like a small but fairly consistent Harris lead over the last month, albeit less of a lead than a couple of months ago.
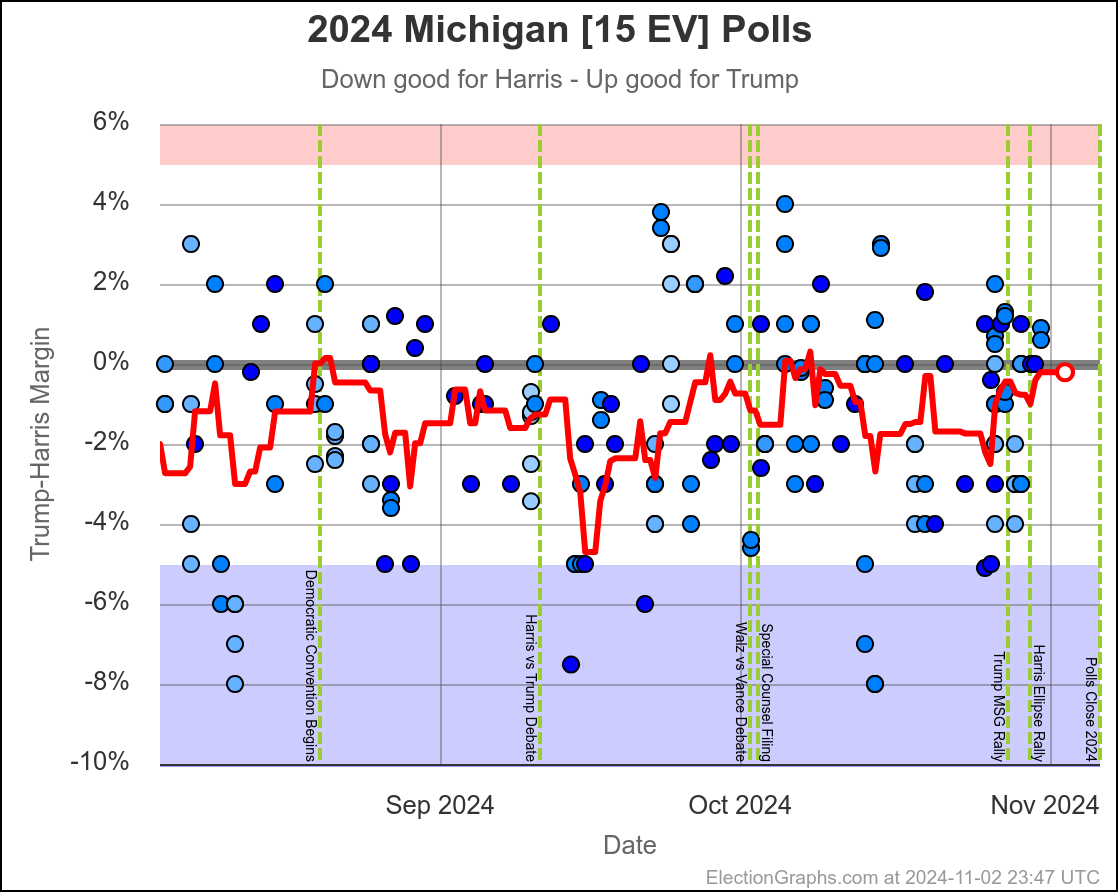
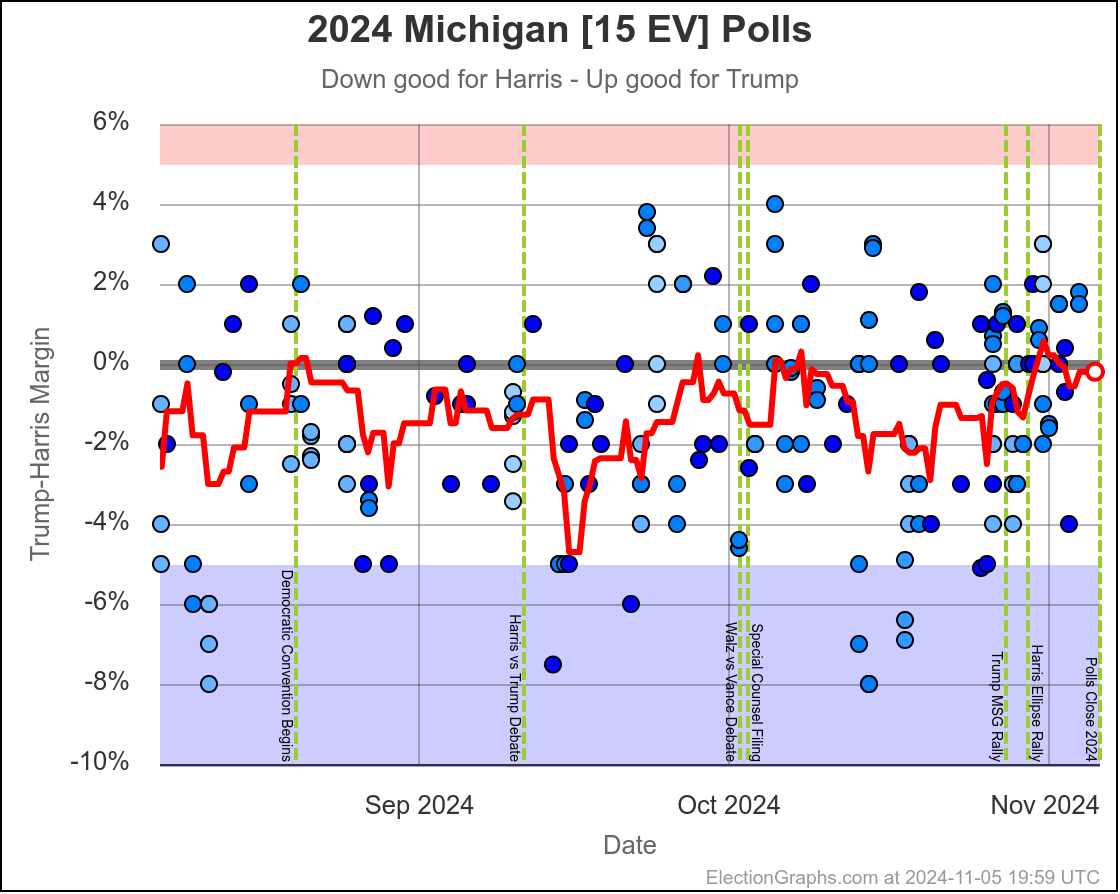
Michigan also looks like it is bouncing around a narrow Harris lead. So I'd put it in her column.
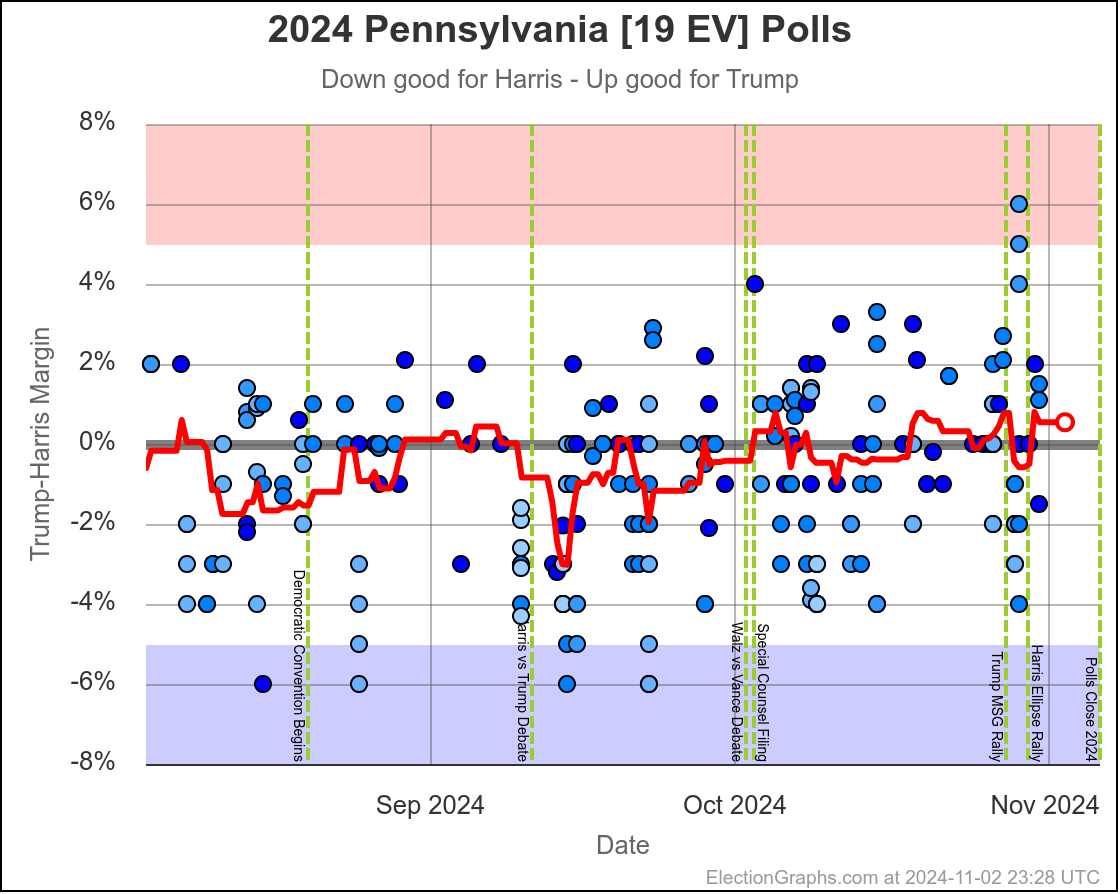
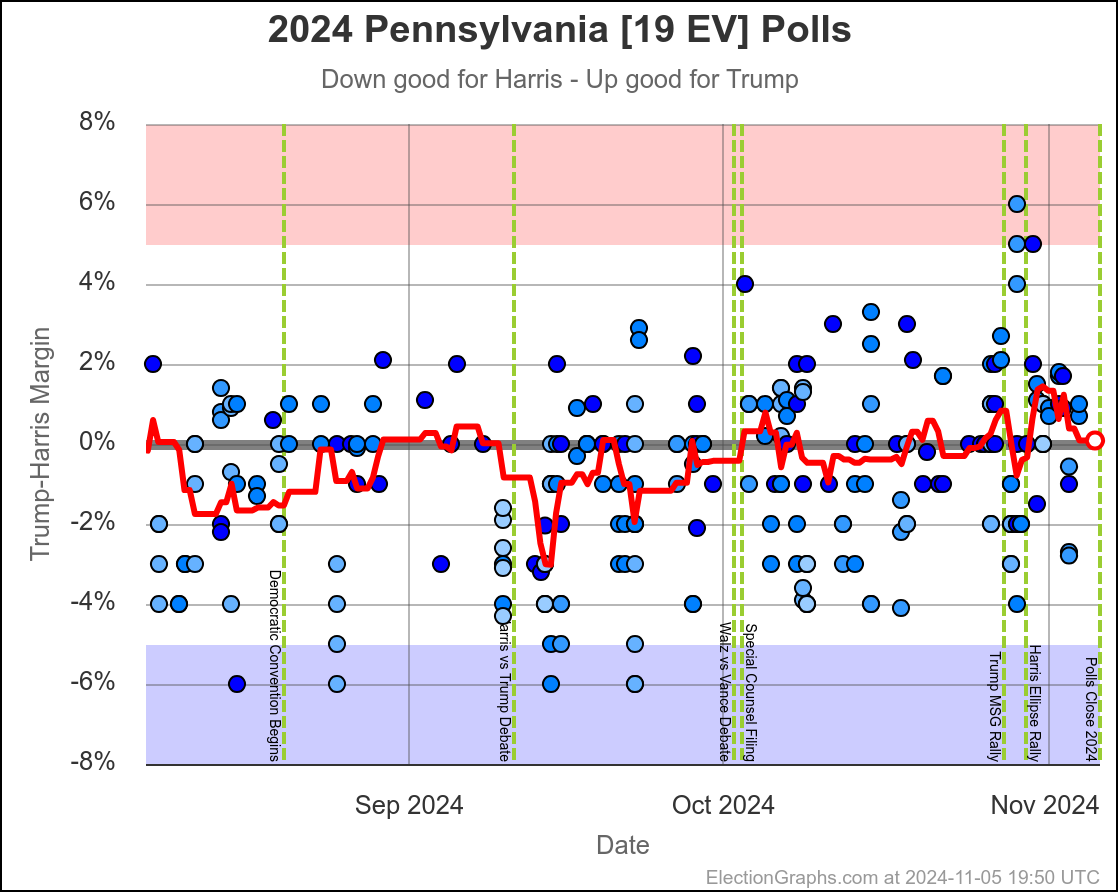
Yup, Pennsylvania still looks like a tossup. It is slightly on the Trump side right now, but just a few days ago it took a dip into the Harris side. It seems to be somewhere between Trump by 1% and Harris by 1%, but where it will end up is anybody's guess.
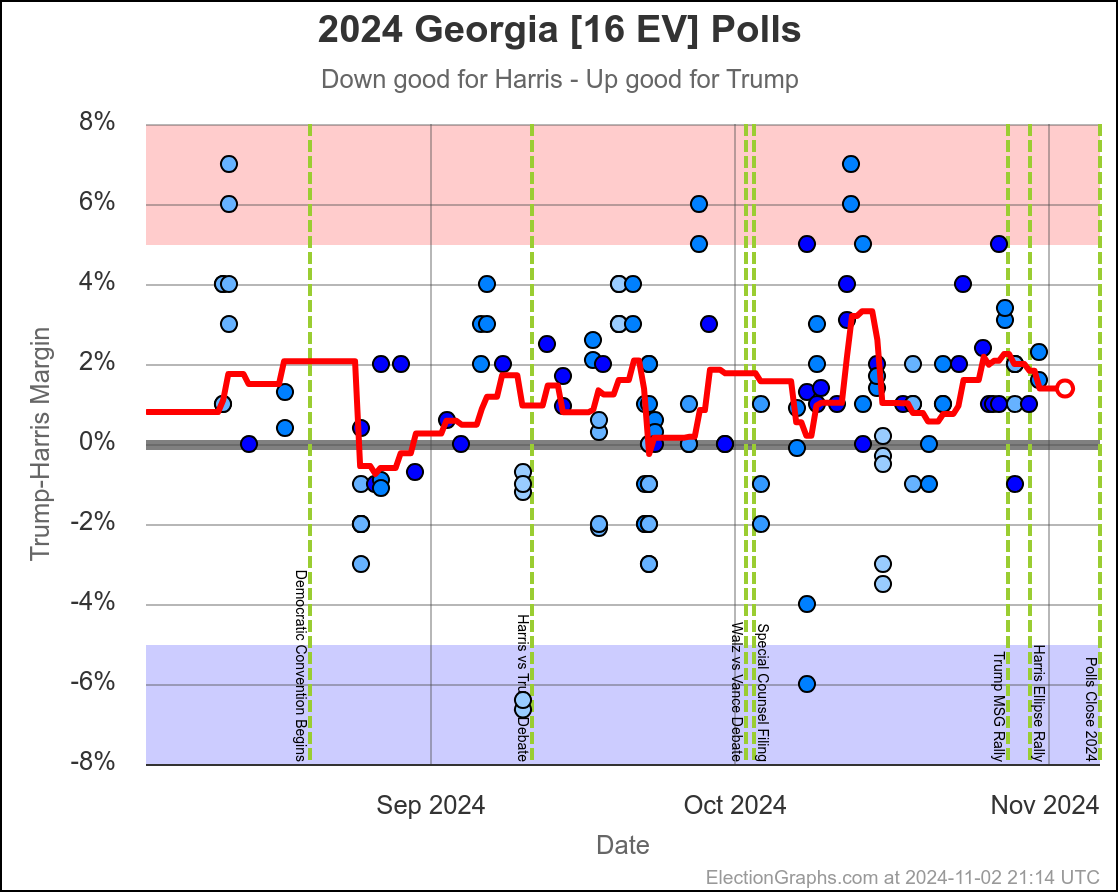
Georgia looks pretty consistently like a narrow Trump lead. Harris needs a consistent poll error to win here.
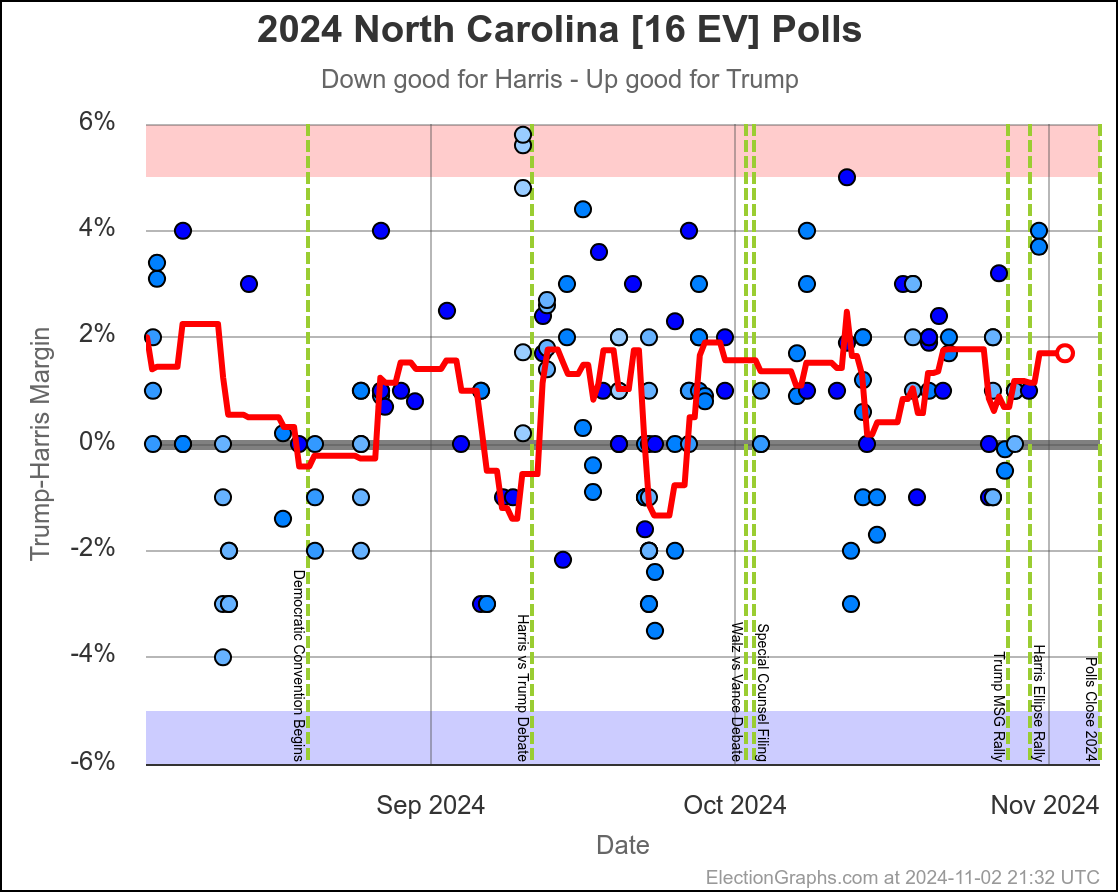
Same with North Carolina.
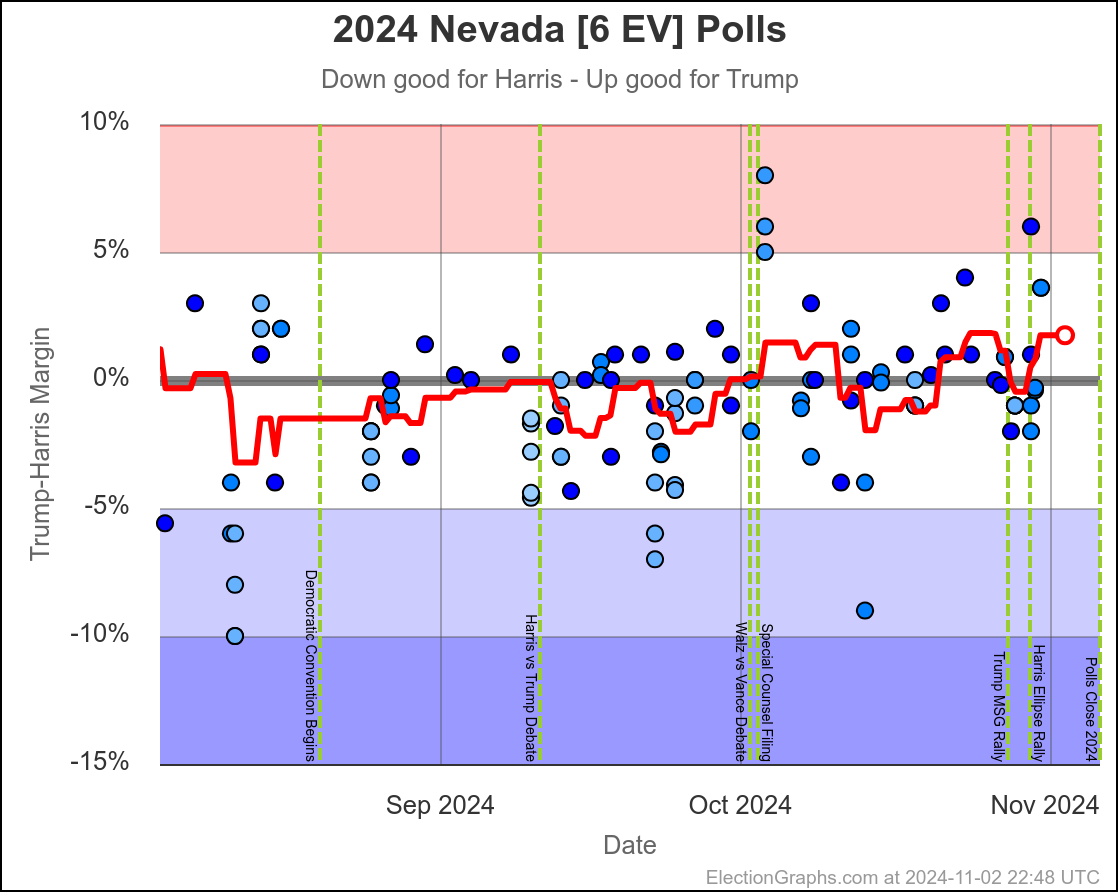
I put this in the true toss up category last time. It is starting too look more like this might be a real move to the Trump side. But it was briefly on the Harris side within the last few days. And there are two points that look like outliers. So still going to consider it a tossup based on the trend. But this may yet change before my final post on Election Day.
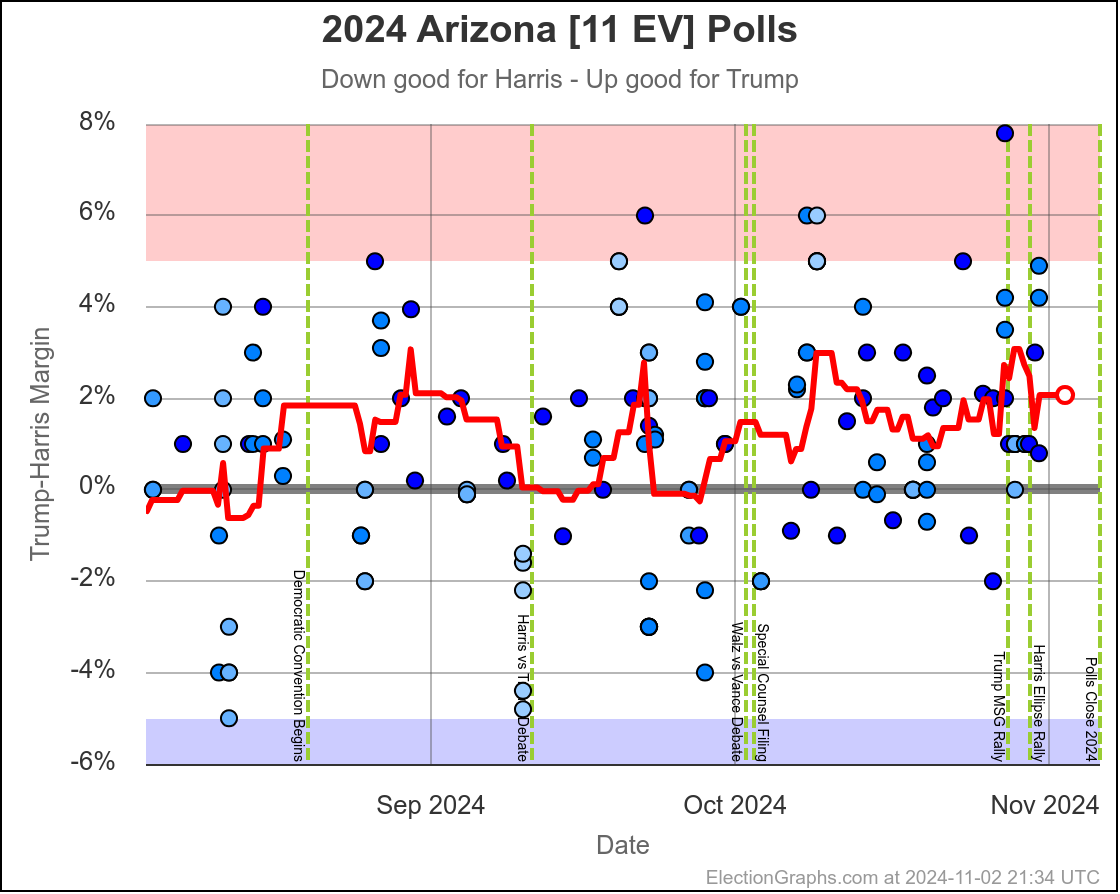
Yeah, this looks like Trump too.
All of the evaluations above are just looking at the trends and assuming you can basically trust the poll average, but are trying to further smooth the curve. (If this is really needed, maybe I should just average over more polls, but we have used the same method for the average itself since 2008, so I'm not changing that at the moment.)
But where this ends up is just if you roughly trust the trends on all of these states, you just end up with the same conclusion as using the averages themselves. Pennsylvania is the tipping point, it could go either way, and the result of the election as a whole will very likely just depend on what ends up happening in Pennsylvania.
OK, now for "what happens if you only include super highly rated pollsters" question.
|
All Polls |
Rating>2.5 |
Delta |
| Wisconsin |
D+0.5% |
D+1.2% |
D+0.7% |
| Michigan |
D+0.2% |
D+0.8% |
D+0.6% |
| Pennsylvania |
R+0.5% |
D+0.3% |
D+0.8% |
| Georgia |
R+1.4% |
R+1.1% |
D+0.3% |
| North Carolina |
R+1.7% |
R+0.9% |
D+0.8% |
| Nevada |
R+1.8% |
R+0.2% |
D+1.6% |
| Arizona |
R+2.1% |
R+3.6% |
R+1.5% |
So the "junk pollsters" improve Trump's numbers in 6 out of 7 states. On average restricting to only the highest quality pollsters moves things toward Harris by 0.5%.
But looking specifically at the tipping point, this moves it from Trump by 0.5% to Harris by 0.3%, so the lower quality pollsters are boosting Trump's apparent position by 0.8%, slightly more than the 0.6% effect when we were at the 12 day mark.
And in this case, this would move the "expected case" from a Trump win to a Harris win. In either case though, we're talking about a tiny margin. The tipping point is close either way. And in either case the result comes down to which side of the line Pennsylvania ends up on.
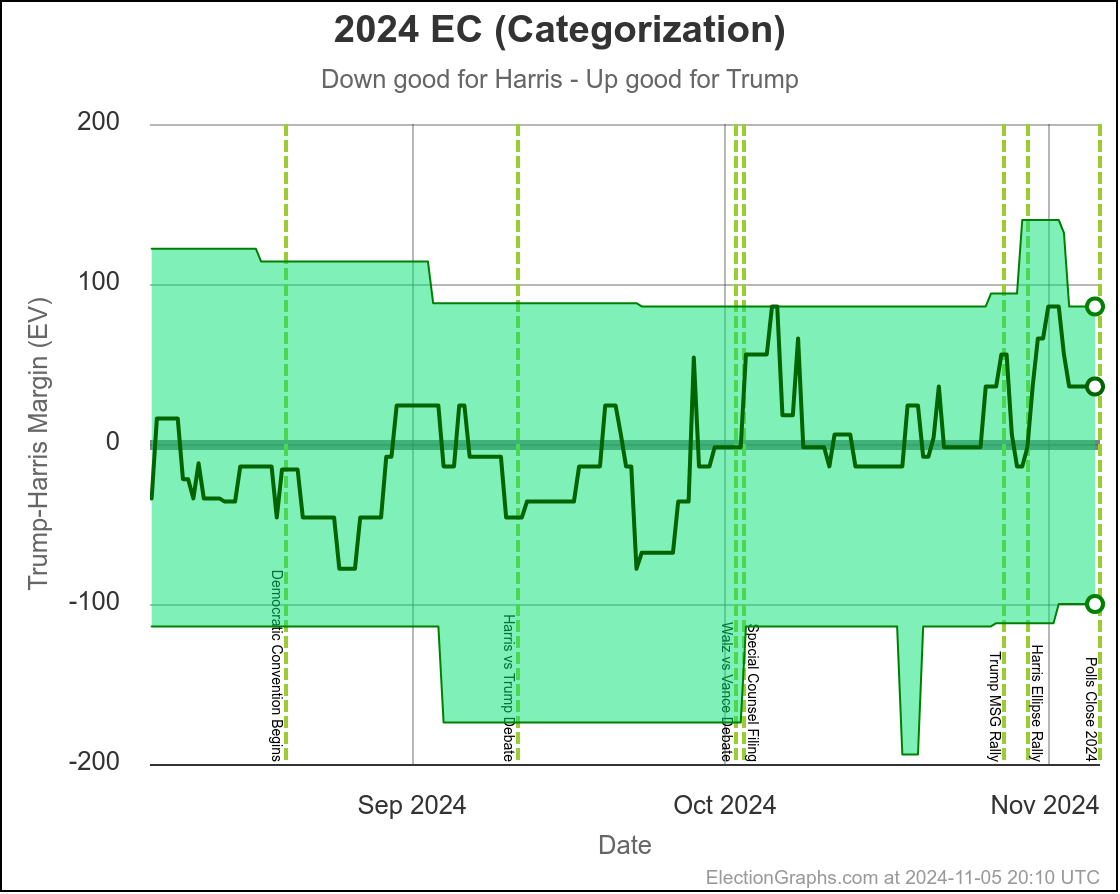
Going back to the averages as they are, the envelope of possibilities has evolved like this:
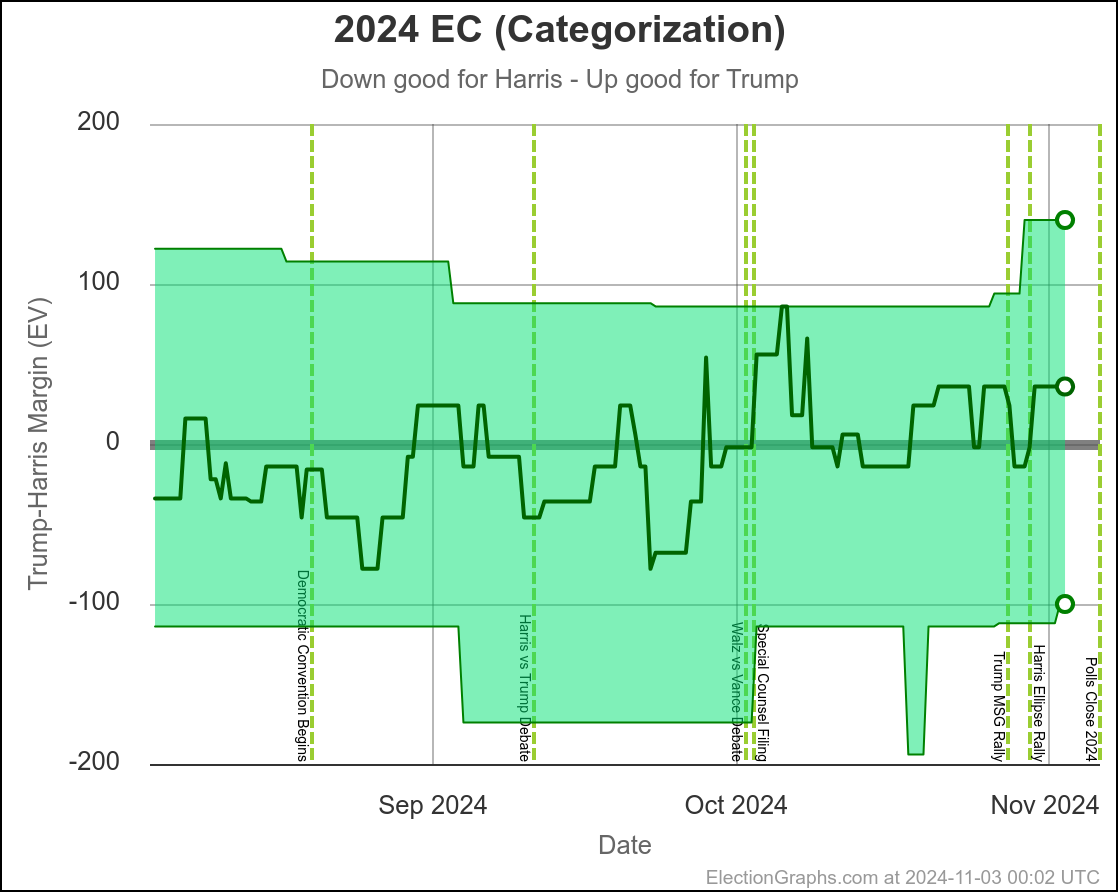
The main things to note that have changed since last time are that New Hampshire, Virginia, and Minnesota have all had Harris's lead fall under 5%, so they are now included in the Trump best case.
Also Trump's leads in Iowa and Maine-CD2 both increased to over 5%, so they have been removed from Harris's best case.
You'll also note that for a brief time between Trump's closing argument event at Madison Square Garden and Harris's closing argument event at the Ellipse Harris took the lead in the "expected case" where each candidate wins every state they lead for even a small amount of time. This seemed to potentially be a negative reaction to the MSG event, but then balanced by a move back in the other direction a couple of days later.
This may change again. But of course there are only a couple more days left for any additional changes.
In any case, the range of "don't be surprised" possibilities now stretches from Harris by 100 EV to Trump by 140 EV.
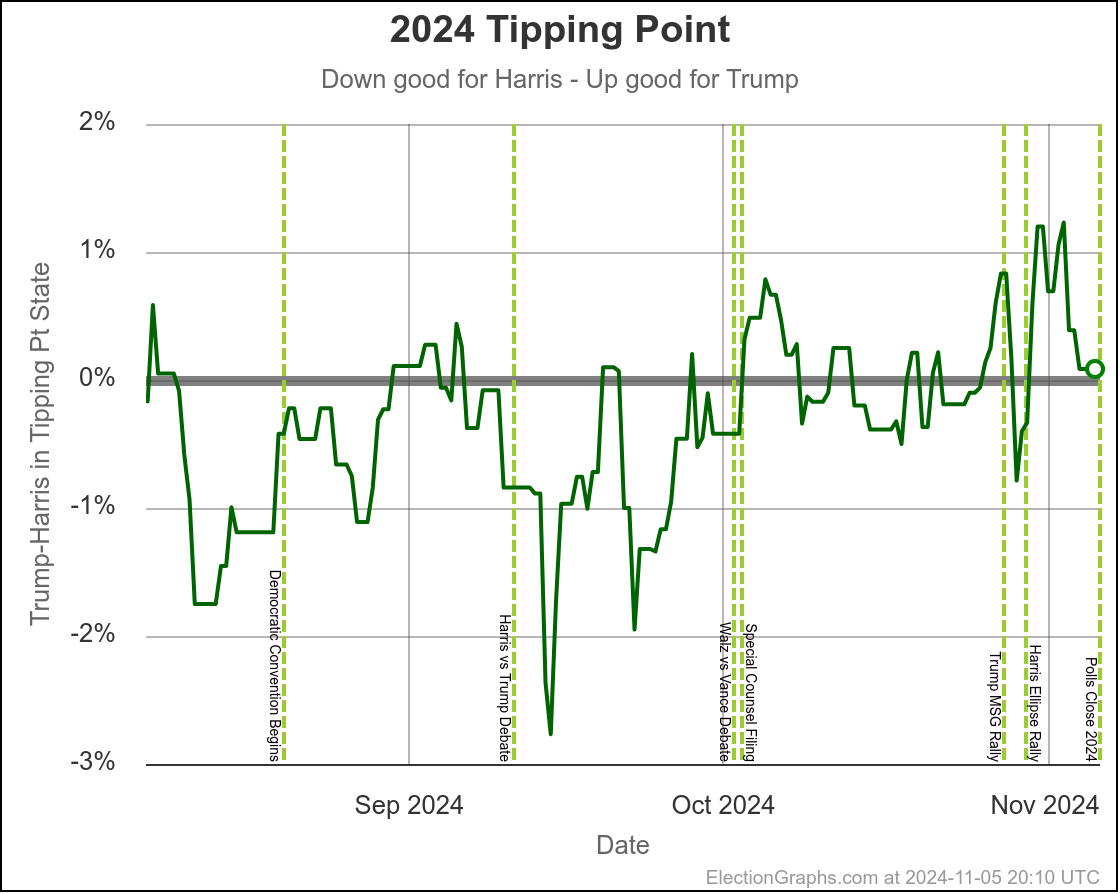
Looking at the tipping point:
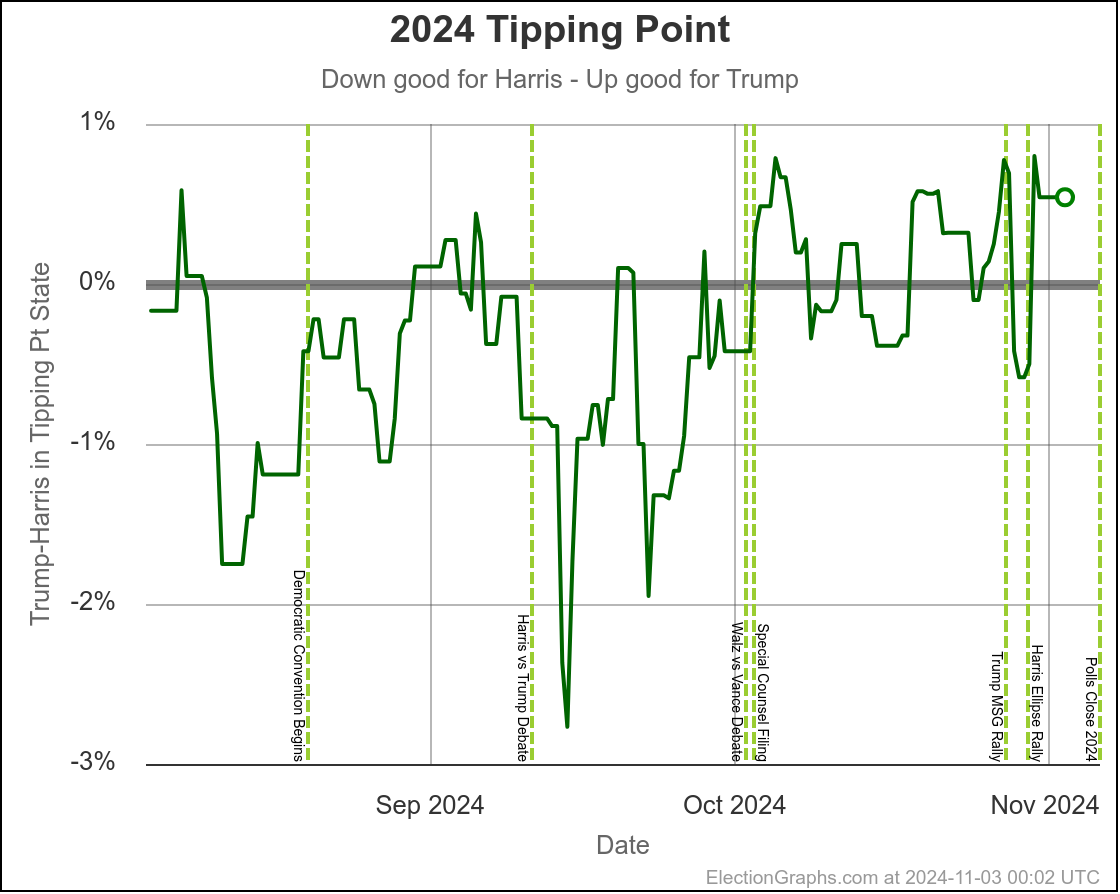
Not bothering to compare with 2016 and 2020 again. Harris is still nowhere near where either Biden or Clinton were 4 and 8 years ago.
But doing the same sort of thing we did with the state charts, ignoring the jitters up and down and looking at the overall trend, this has just been bouncing roughly between Harris by 0.5% and Trump by 0.5% since the start of October. Before that we seemed to have a consistent Harris lead. But now, we're just hugging the center line, and have been for weeks.
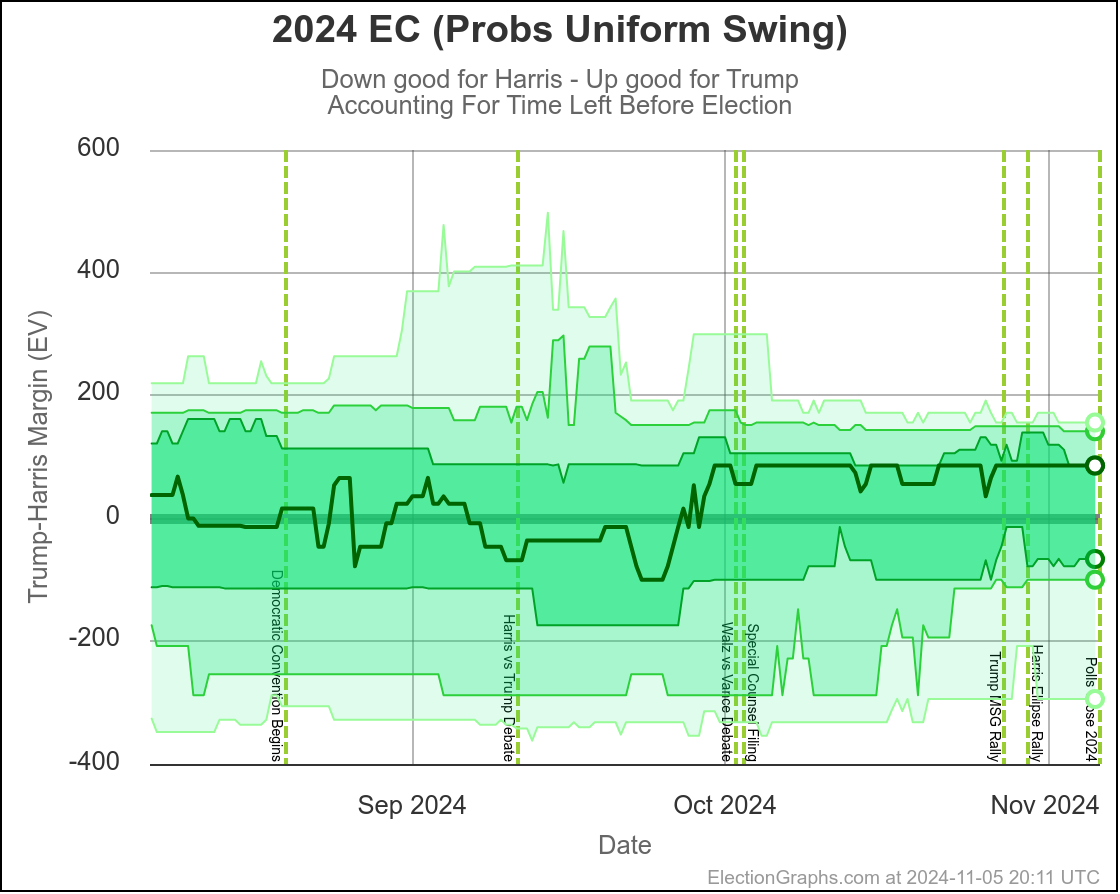
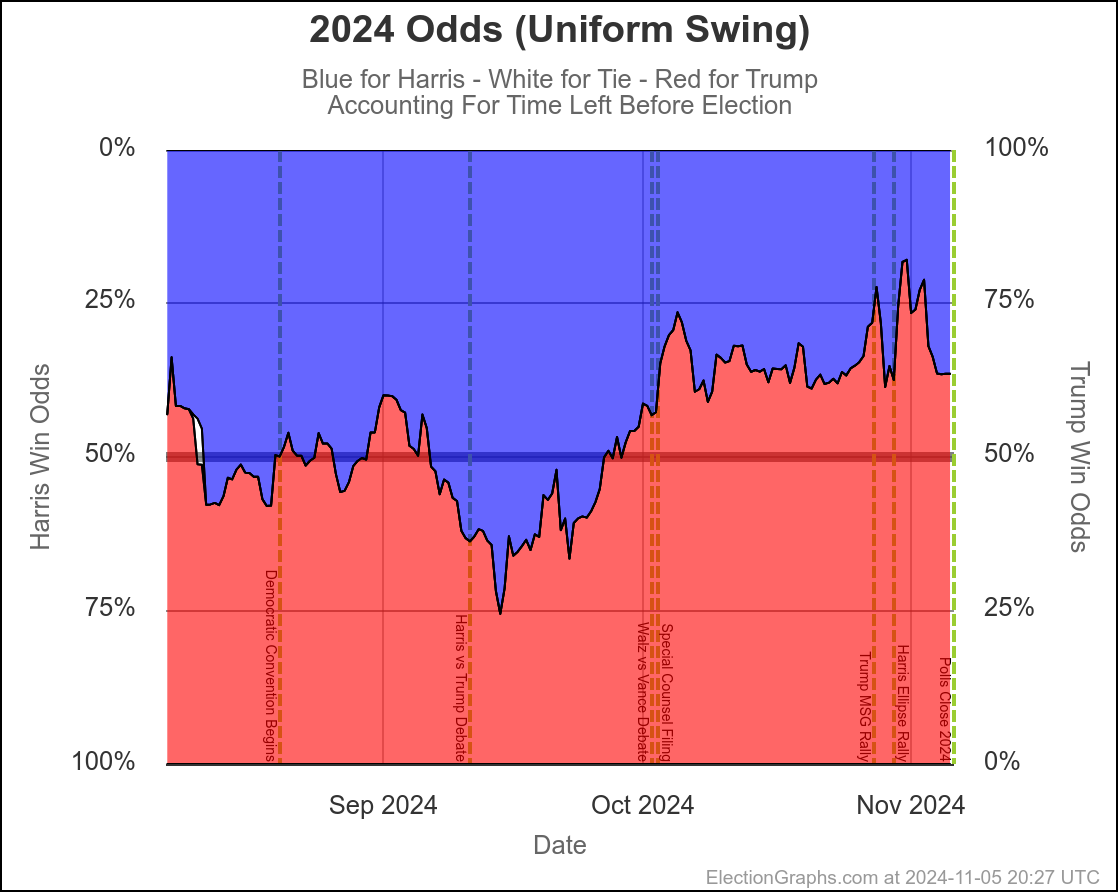
OK. Time for the probabilistic view. I've said in previous posts that while the "true value" is somewhere between my Independent States and Uniform Swing views, it is closer to Uniform Swing because it is very likely that if the big pollsters are underestimating once side or another, the same type of error will show itself across all the close states. So lets just look at the Uniform swing view today:
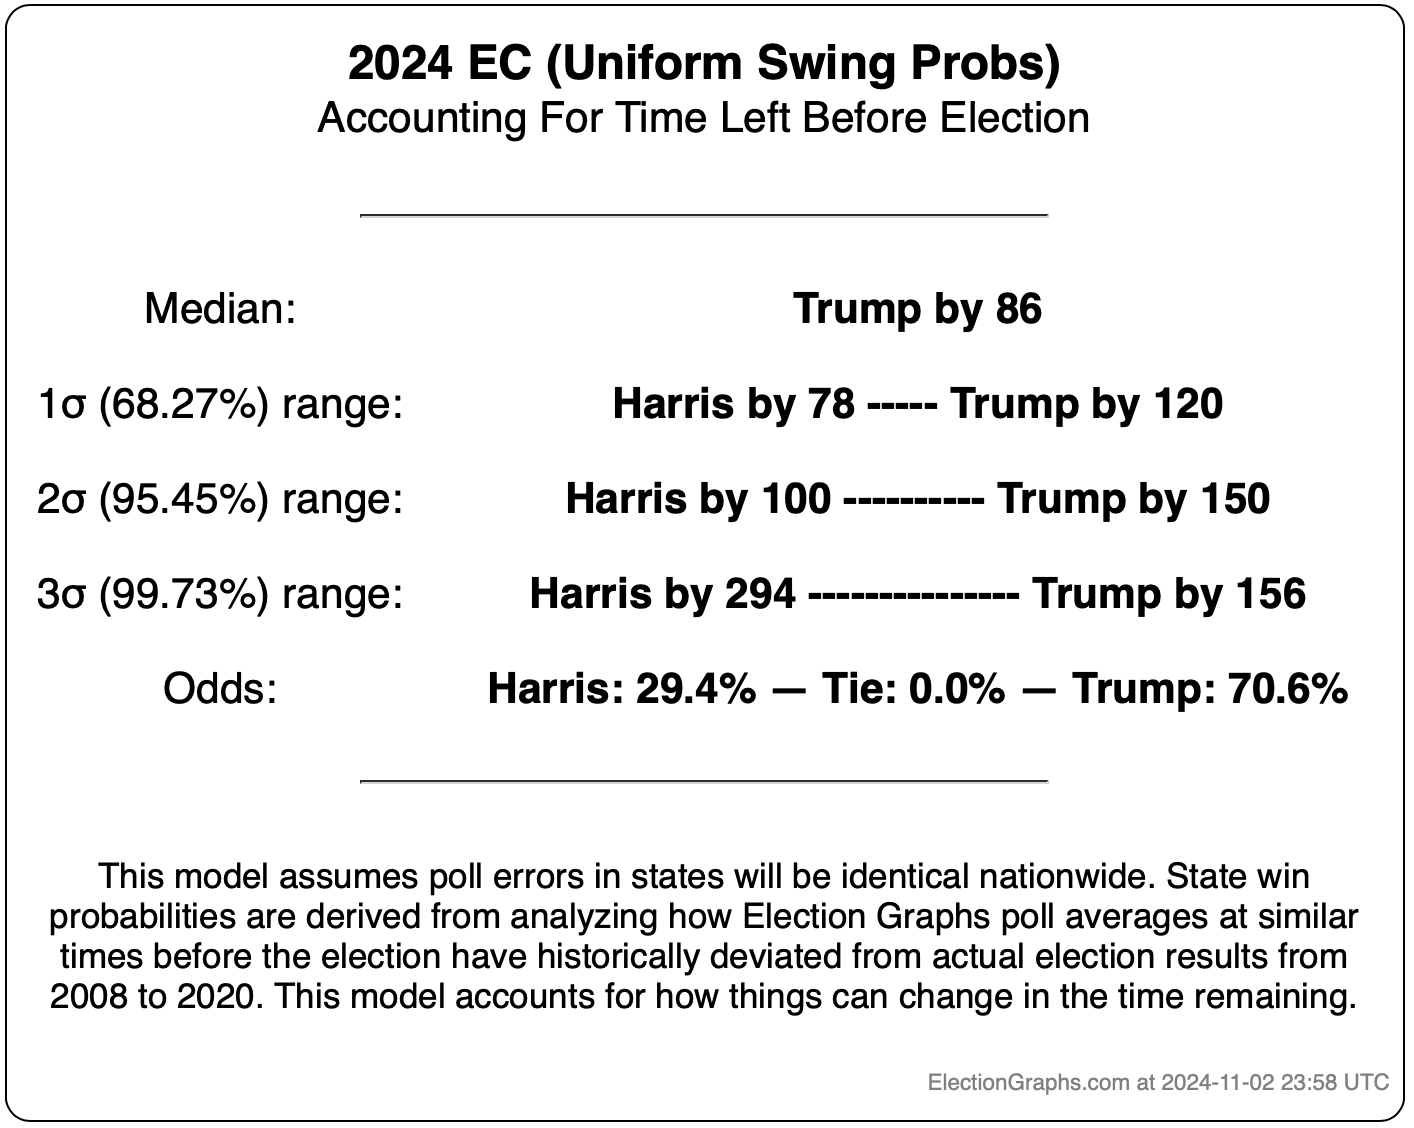
Notice that the 95% confidence interval is very similar to the bounds of the categorization model envelope. In any case, this shows EG giving Harris a 29.4% chance of winning at the moment.
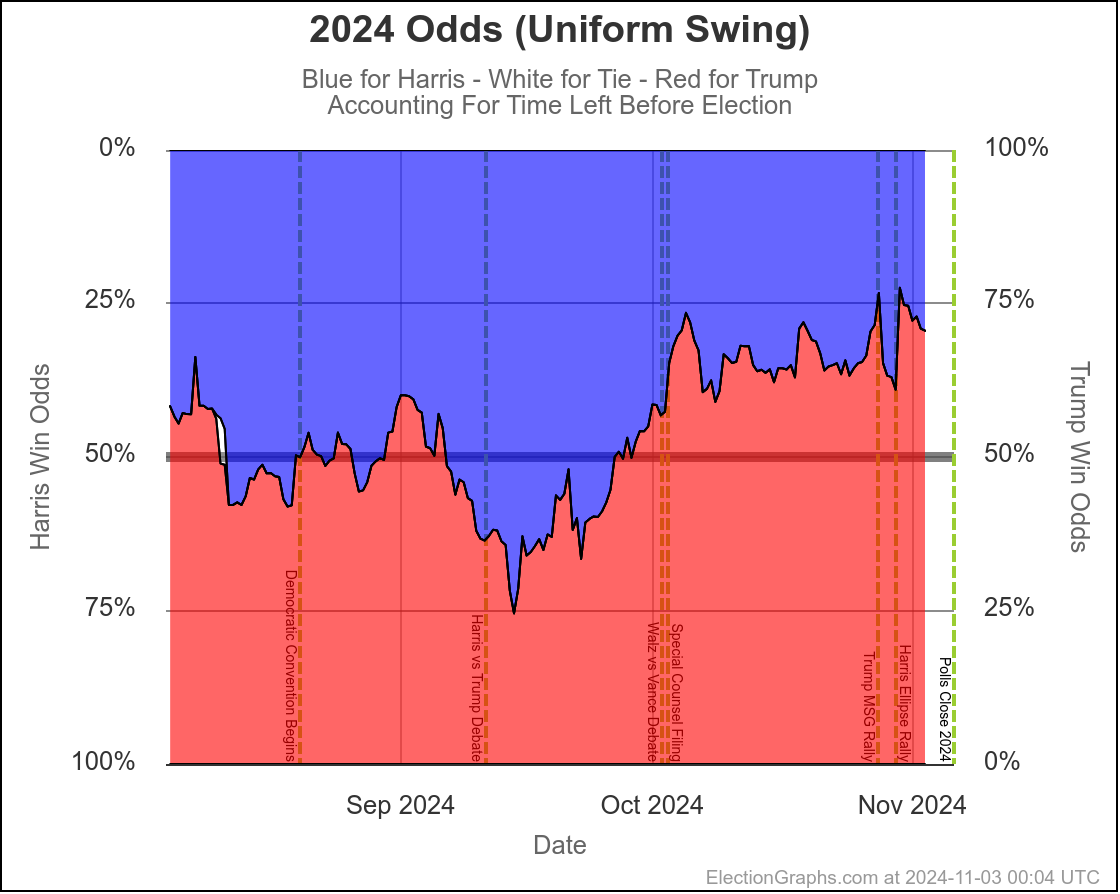
By comparison, here are what some of the other sites have right now:
I'll add that Election Betting Odds (not based on polls, but on aggregating betting sites) currently has her at 47.2%.
Why am I so much lower for Harris? Basically because my models look at the past polling misses from 2008 to 2020 and concludes that on average polls have tended to underestimate the Republican in the close states over that time period, so it is more likely than not to happen again. To give her even odds, the EG model would need to see Harris leading in the tipping point by about 1.2%. And of course that is not where things are.
I believe the other sites basically assume there will be polling error, but that it is equally likely to favor either candidate.
In fact, there seem to be signs that the polling error might go the other way and be underestimating Harris this time.
For instance early vote numbers showing disproportionate numbers of women voters for instance, along with polling showing a large gender gap with women favoring Harris and men favoring Trump, and polling showing an enthusiasm gap favoring Harris.
The most recent thing along these lines hit the news right before I started this blog post though, and that is Iowa:
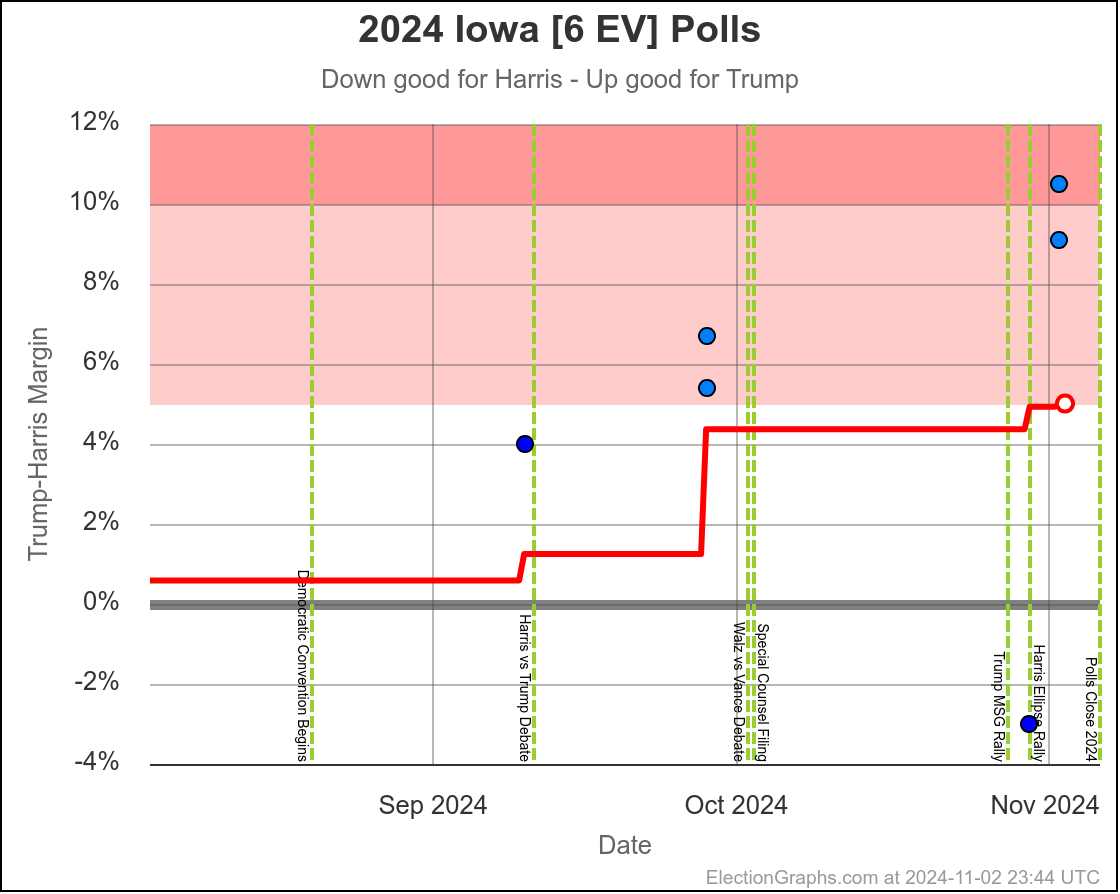
Iowa has been very sparsely polled this cycle, and the EG poll average has been tending toward Trump as the actual polling washed out the 2008 and 2012 Obama wins there, and replaced them with polls showing the much redder version of Iowa that people expected these days.
And in fact there was an Iowa poll by Emerson released Saturday that showed Trump ahead by about 10% in Iowa.
But see that one point in the bottom right hand corner? That is Selzer.
Late on Saturday afternoon, Selzer released their Iowa poll and it seems like the internet exploded. That poll shows Harris LEADING by 3%. (This followed a Selzer poll in September showing her behind by 4%, which was already closer than expected.)
The average still has Trump ahead by 5.0% though, and with an upward trend, so why does anyone care?
Well, just because of Selzer's track record. They are considered the gold standard poll in Iowa
From 2012 to 2022 in races for President, Senator, and Governor in Iowa, Selzer's final poll has been 2% or less off from the actual result five out of seven times. (The other two were 3% and 5% off.) This is an amazing level of accuracy for a pollster. When Selzer has looked like an outlier from other polls in the past, they have turned out to be the ones that were right.
And the thing is, if Iowa is CLOSE, let alone if Harris is actually winning in Iowa, it would be almost impossible to believe that scenario unless Harris were already ahead in most if not all of the other swing states, and probably making other red states like Ohio, Florida, Alaska, and Texas competitive too.
(I'll note that while they have not been from pollsters with a reputation like Selzer, there have been recent isolated one off polls showing Harris behind by 5% or less in Ohio, Florida, Texas, and even Kansas.)
Now, it may be that this time is the time that Selzer is actually going to have a big outlier and just be flat out wrong. That could happen.
But if Selzer is right… then it would imply that a lot of the other pollsters are wrong. If Selzer is right, then we may be seeing a situation close to… or maybe even beyond, what I have as Harris's best case of a 100 EV win based on the categorization model.
If Selzer is right, it essentially predicts not just an Iowa win, but a Harris landslide nationwide.
That is why everybody's head spun when they saw the Selzer poll numbers.
Even if it doesn't portend a landslide, it may indicate that other polls are underestimating Harris, and that would be an indicator that maybe she's actually ahead, and maybe it isn't going to be a nail biter after all.
Or maybe Selzer is just wrong.
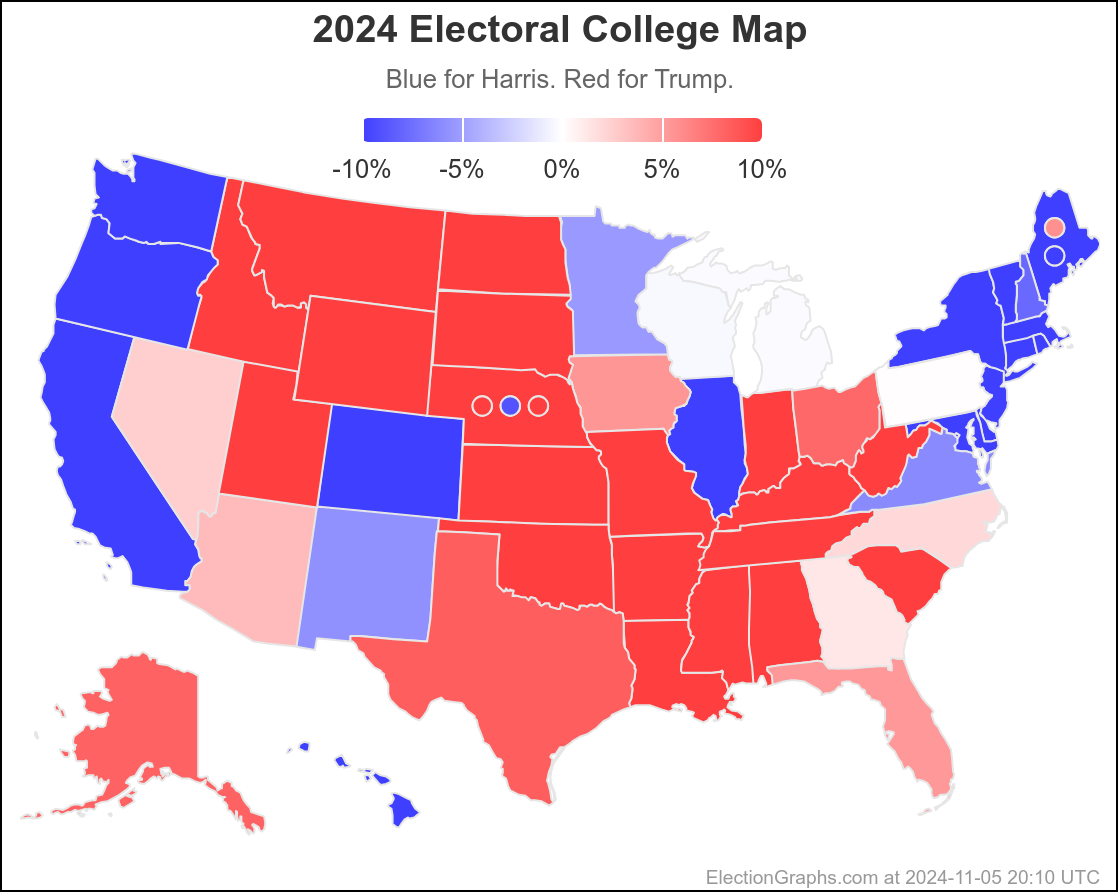
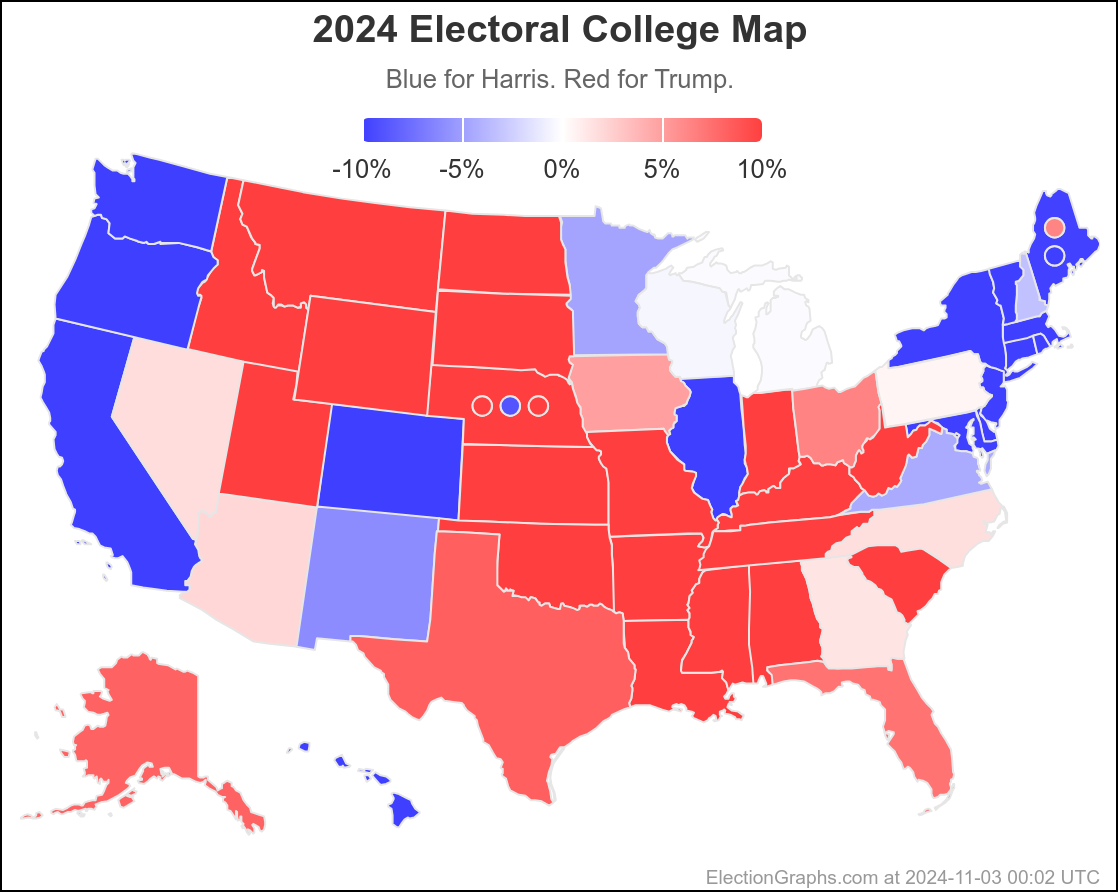
Anyway, that's about it for the analysis this time around, so here is the new map:
I'll do one more blog post once we are under 1.0 days left. In the mean time, check the Election 2024 main page for updates.
And yeah, as I predicted at the start of this post, a whole bunch of new polls were released while I was writing this, so it is already out of date.
And so it goes. (Shout out to Linda Ellerbee.)
2.7 days left.
Almost done.

