
It has been 7 days since my last post. The time remaining is flying by fast. These posts will become more frequent as we approach the end. At least once a week now, but more if something interesting happens.
As usual, here is the TL;DR for those who just want the summary:
It is still too close to call, although with recent polling in swing states, EG currently favors trump by about 70/30.
There has been some talk of low quality partisan pollsters making poll averages look redder than they should, but mainstream pollsters are showing the same thing in key states.
The race is right on the edge if you trust the polling, but a lot will depend on if the polls are systematically underestimating Trump again, as EG implicitly assumes, or if this time they are underestimating Harris.
But we won't know that until the votes are counted.
Either side could still easily win.
With that done, as usual, I'll start with how polls have moved in the last week for all the states with a margin under 10%.
As of 2024-10-07 at 01:00 UTC:
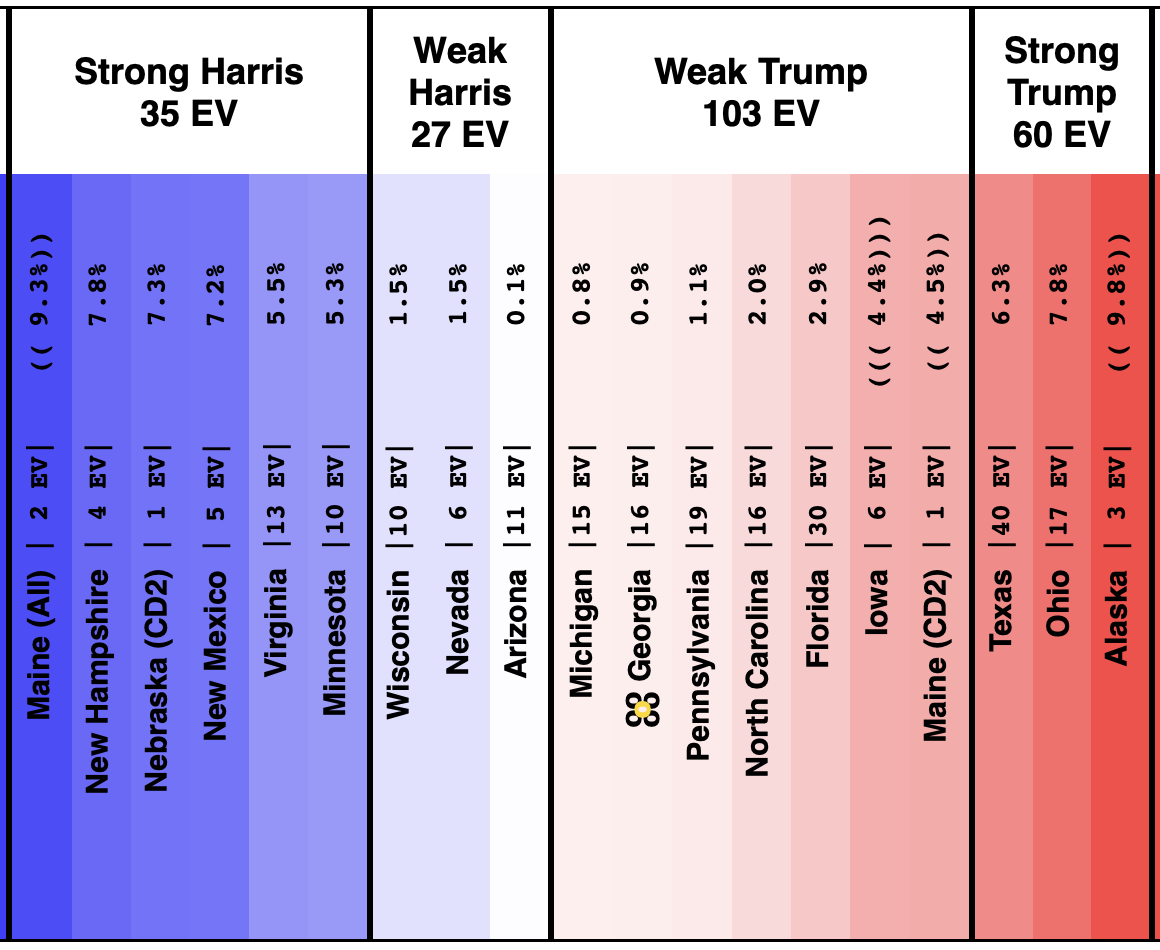
And as of 2024-10-13 20:30 UTC when I started this blog post:

OK, now the changes in the last week:
Movement toward Trump:
- Florida (29 EV): Trump by 2.9% -> Trump by 6.6% (Trump+3.7%)
- Nevada (6 EV): Harris by 1.5% -> Trump by 1.2% (Trump+2.7%)
- Wisconsin (10 EV): Harris by 1.5% -> Trump by 0.3% (Trump+1.8%)
- Arizona (11 EV): Harris by 0.1% -> Trump by 1.5% (Trump+1.6%)
- New Hampshire (4 EV): Harris by 7.8% -> Harris by 6.8% (Trump+1.0%)
- Georgia (16 EV): Trump by 0.9% -> Trump by 1.5% (Trump+0.6%)
No Movement:
- Maine-All (2 EV): Harris by 9.3%
- Nebraska-CD2 (1 EV): Harris by 7.3%
- New Mexico (5 EV): Harris by 7.3%
- Michigan (10 EV): Trump by 0.8%
- Iowa (6 EV): Trump by 4.4%
- Maine-CD2 (1 EV): Trump by 4.5%
- Alaska (3 EV): Trump by 9.8%
Movement toward Harris:
- Minnesota (10 EV): Harris by 5.3% -> Harris by 5.4% (Harris+0.1%)
- Texas (40 EV): Harris by 6.3% -> Harris by 5.8% (Harris+0.5%)
- Ohio (17 EV): Trump by 7.8% -> Trump by 7.1% (Harris+0.9%)
- Virginia (13 EV): Harris by 5.5% -> Harris by 6.3% (Harris+0.8%)
- North Carolina (16 EV): Trump by 2.0% -> Trump by 1.1% (Harris+0.9%)
- Pennsylvania (19 EV): Trump by 1.1% -> Trump by 0.0% (Harris+1.1%)
Six states moving toward Trump, six states moving toward Harris.
Unfortunately for Harris, three of the states moving toward Trump moved across the center line. This moved the "expected case" where every candidate just wins the states where they lead the EG average, even by the tiniest amount, from Trump winning by 32 EV, to Trump winning by 86 EV.
For the first time in one of these updates, one of the candidate has no "weak" states, meaning states that favor them, but by a margin less than 5%. At the moment ALL of the close states are on the Trump side of the center line, although many of them just barely.
The tipping point though stays pretty flat, moving from Trump by 0.9% in Georgia, to Trump by 0.8% in Michigan.
So lets look in detail at the tipping point state and the three on either side:
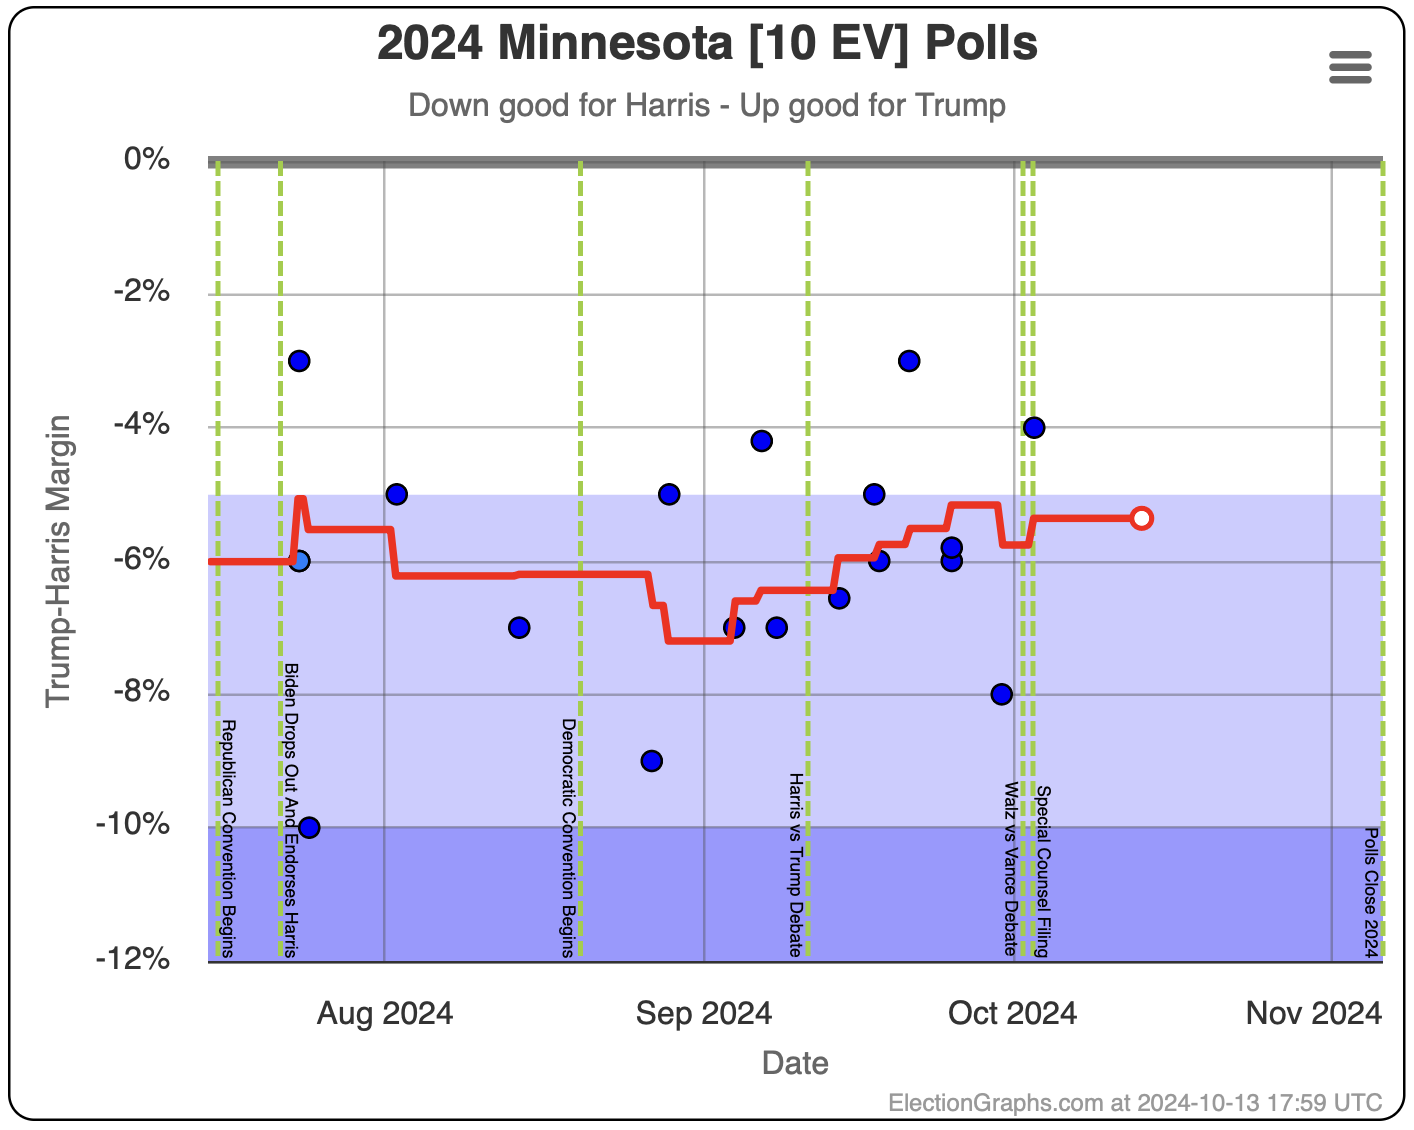
This time Minnesota is included in the 7 we are looking at, because Nevada and Arizona moved to the Trump side of the tipping point. But Minnesota still looks pretty blue, and there has not really been a trend in the polling average. It has been pretty stable this whole time.
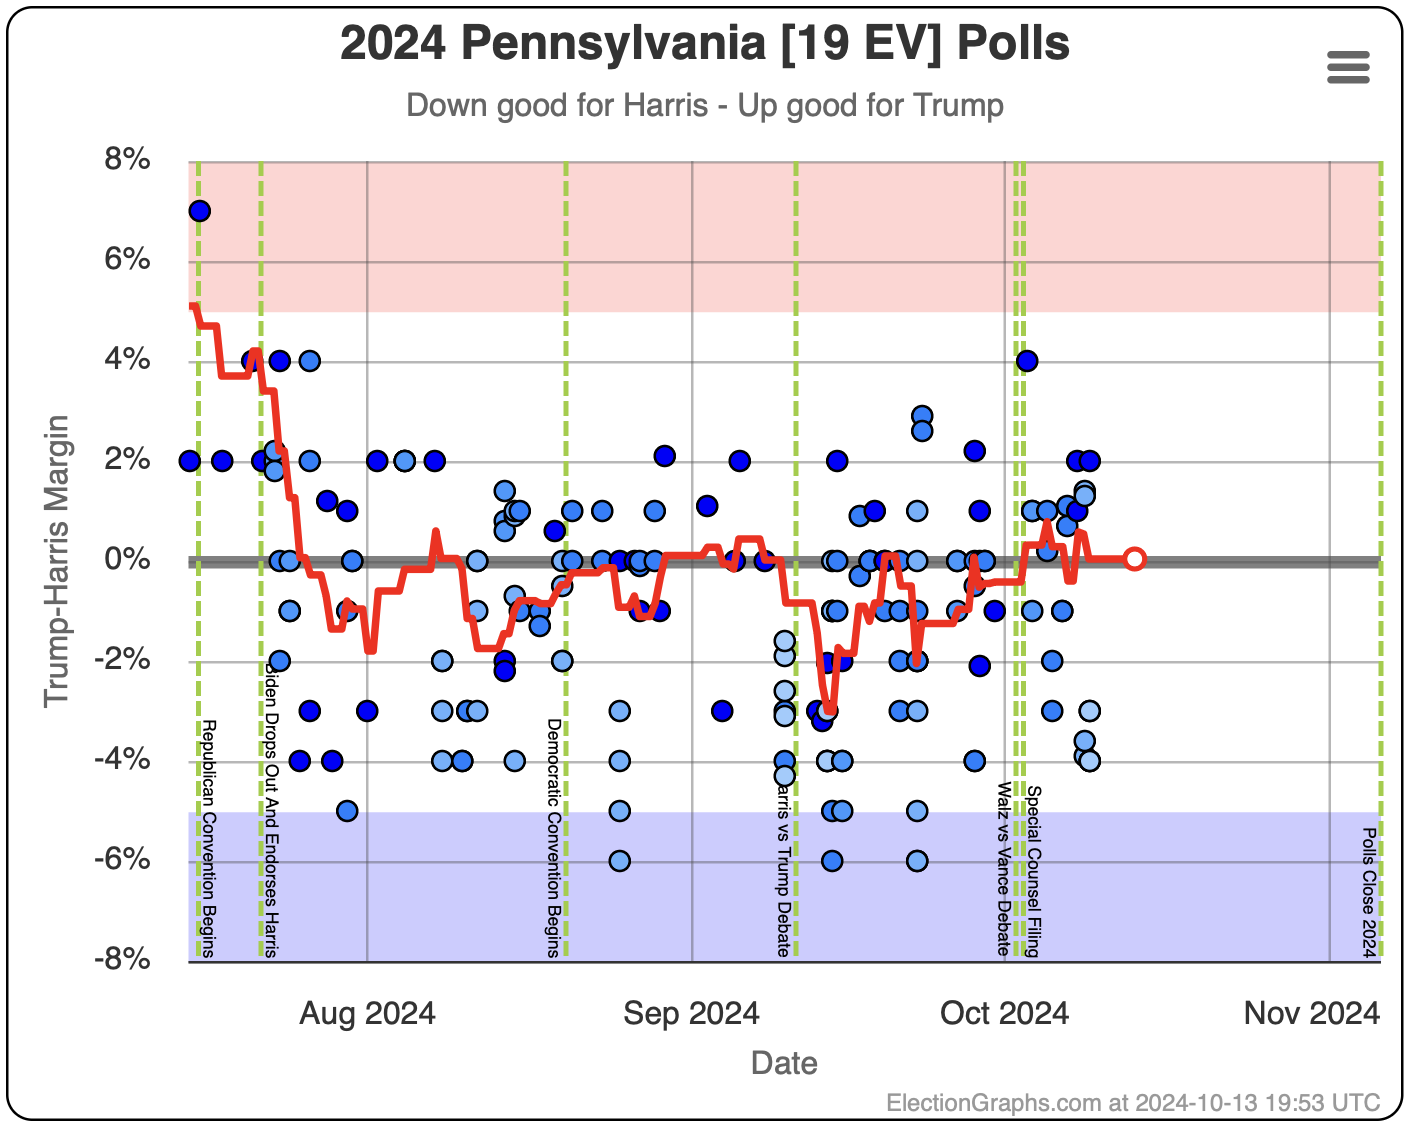
Pennsylvania has spent most of the time as the actual tipping point state, but not right now, since other states that had looked bluer than PA, are now looking redder than PA. Most of the time, this state has been just barely Harris. Right now on the Election Graphs site, it says "Trump by 0.0%". But if it is 0.0%, why is it Trump? Well because the display is rounded. The actual average right now is Trump by 0.04%.
Looking at the full history from August to today though, it looks like the average is just bouncing around in a range, usually between the tie line and a 2% Harris lead with just occasional forays outside of that zone. Right now the average is at the very high end of that range, but there is no clear trend over the last couple of months, so if you had to bet, you'd probably bet that this will revert to the mean, and end up with Harris having a lead in the poll average… barely.
Having said that, if the polls are underestimating Trump like they did in 2016 and 2020, then having a slight lead in the polls won't be good enough for a Harris win.
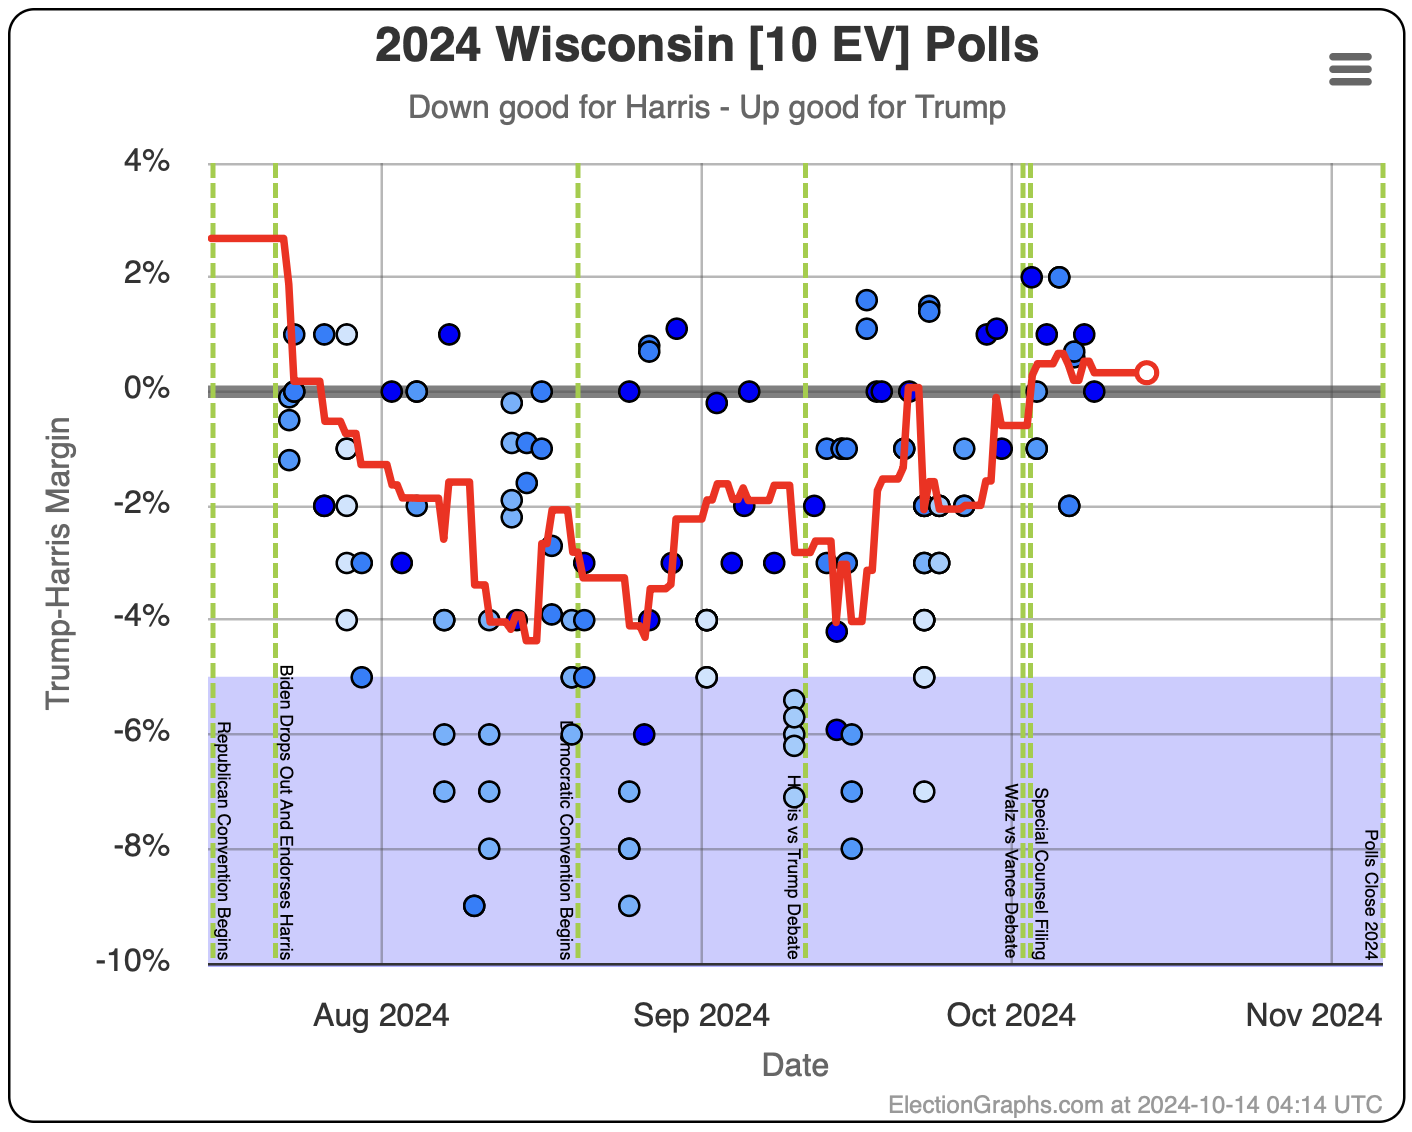
Unlike Pennsylvania, Wisconsin does seem to have a bit of a trend toward Trump over the last month ago, and is now just barely on the Trump side of the line. Will this last? Is it real? Is it just low quality conservative pollsters trying to sway the averages?
Well, in terms of the last question, Election Graphs uses an "include everything we can find" philosophy, so that does include some potentially questionable pollsters sometimes. For instance the Wisconsin average currently includes Fabrizio McLaughlin, for which 538 doesn't even have a rating. But Quinnipiac and Emerson are also in there, which are both near the top of 538's ratings. And if you only included those two, Trump's lead would actually be MORE, not less.
There has been a lot of talk lately about conservative pollsters "flooding the zone" to try to influence polling averages. Maybe they are. But there are so many new polls coming out every week at this point, that these wash in and out of averages like the Election Graphs averages pretty quickly. But more importantly, the mainstream pollsters seem to be showing the same thing. At least in the case of Wisconsin.
Of course that still doesn't tell you if the recent trend is going to last. We'll just have to wait and see. But the Harris team should be concerned about the trend in Wisconsin and doing everything they can to reverse it.
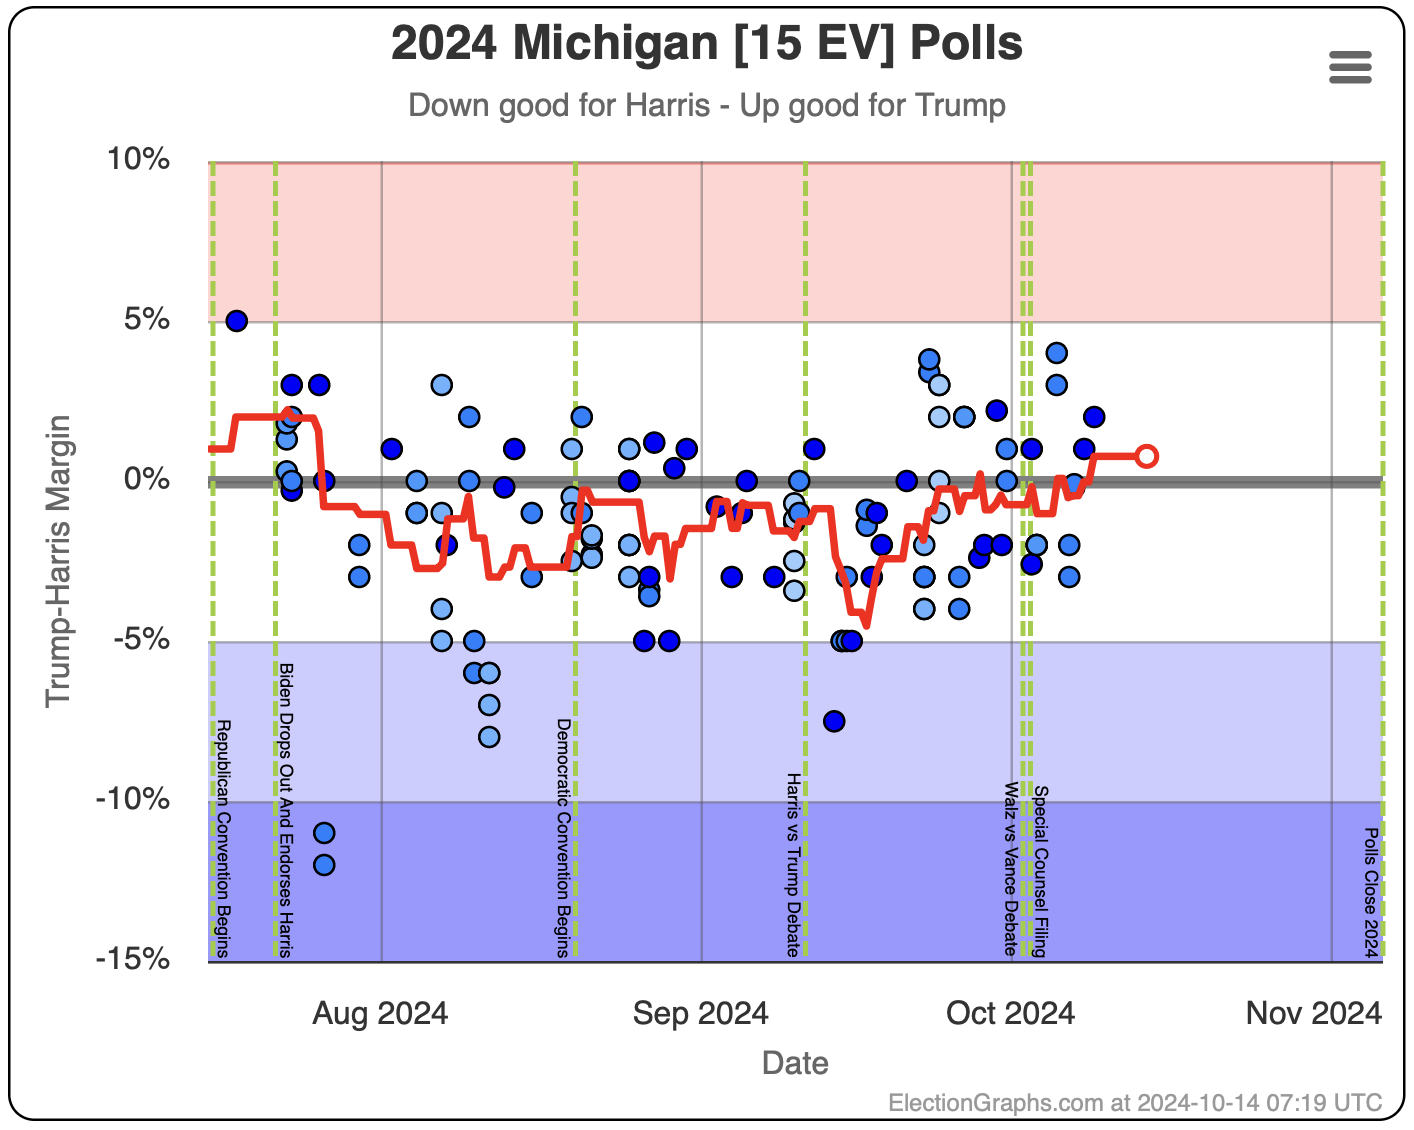
Michigan is currently the tipping point. This means that to win overall, Harris would have to win all the states we have talked about so far, plus Michigan.
Here in Michigan, the longer term trend is less clear than in Wisconsin, but the average has definitely broken out of its previous range onto the Trump side of the line.
Once again, there are no clear outliers, and if you restricted the average only to the highest quality pollsters (again Emerson and Quinnipiac in recent Michigan polling) Trump's lead would be even wider.
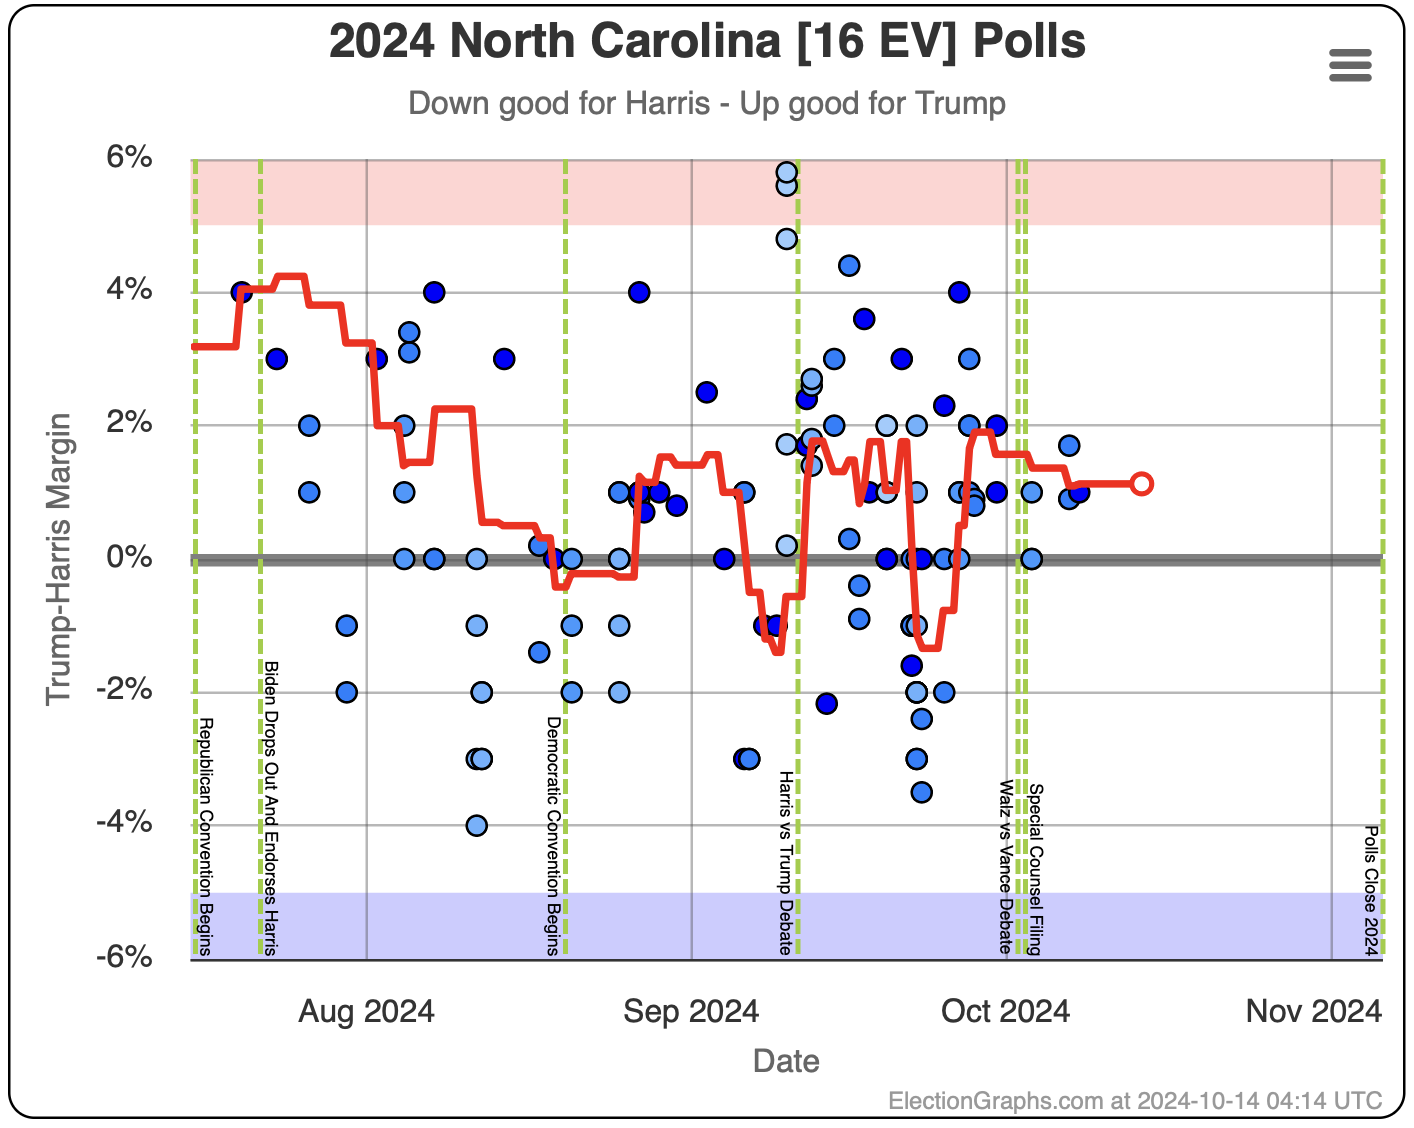
There have been a few isolated moments where North Carolina was on the blue side of the line, but for the most part it has been hovering at about a 1% Trump lead. And we are back there right now.
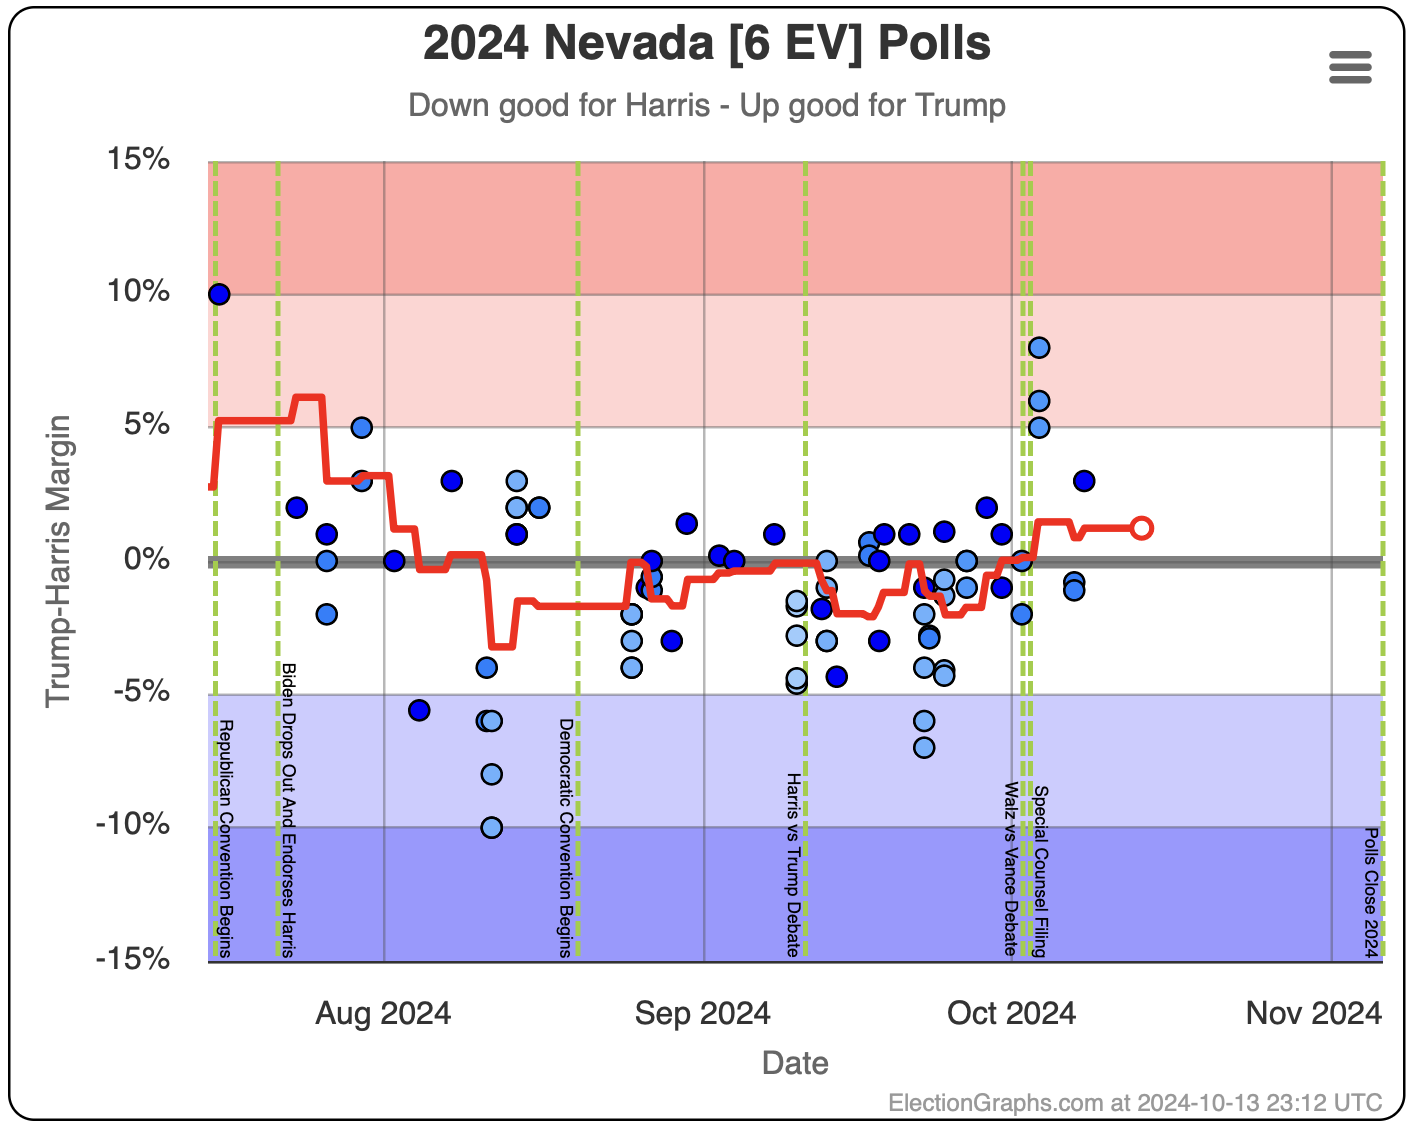
Unlike the other states we have looked at so far, there is at least one poll that look like an outlier in the Nevada average right now.
That would be Fabrizio Lee with a mid-date on October 3rd. They gave three separate results, which average to a 6.3% Trump lead, the best Trump poll result in Nevada since July.
There is also a Fabrizio McLaughlin poll with Trump up by 3%. If it wasn't for the Fabrizio Lee poll, THIS would be the best poll for Trump since the middle of August.
If you take these polls out, Nevada would be back in its "normal" range somewhere between a tie and Harris up by 2%, so it feels likely the poll average will pop back to the Harris side with a few more polls.
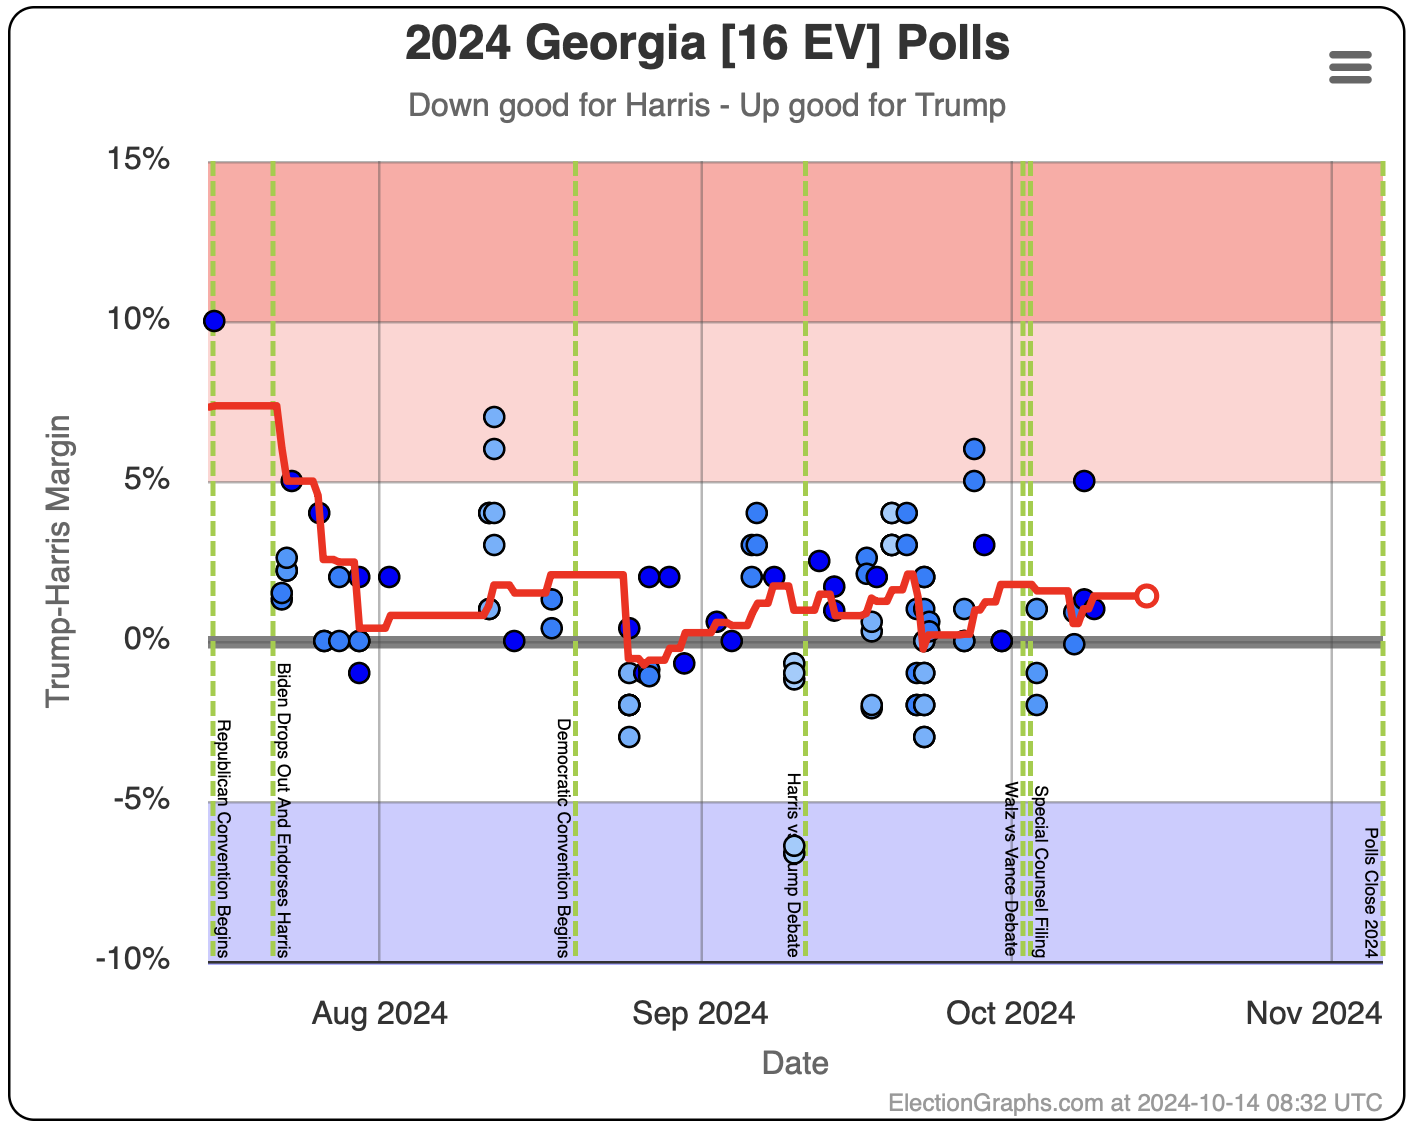
Finally Georgia. No real trend here. Looks like most of the time Trump is running about at a 1.5% lead.
So, for the second week in a row, I've tried to go through state by state to try to squint at the curves and gauge where the averages "really" should be. But for the most part I don't like to do that. The averages should speak for themselves. If there are outliers, they will wash out as new polls are added.
Here is what the tipping point looks like just trusting the poll averages:
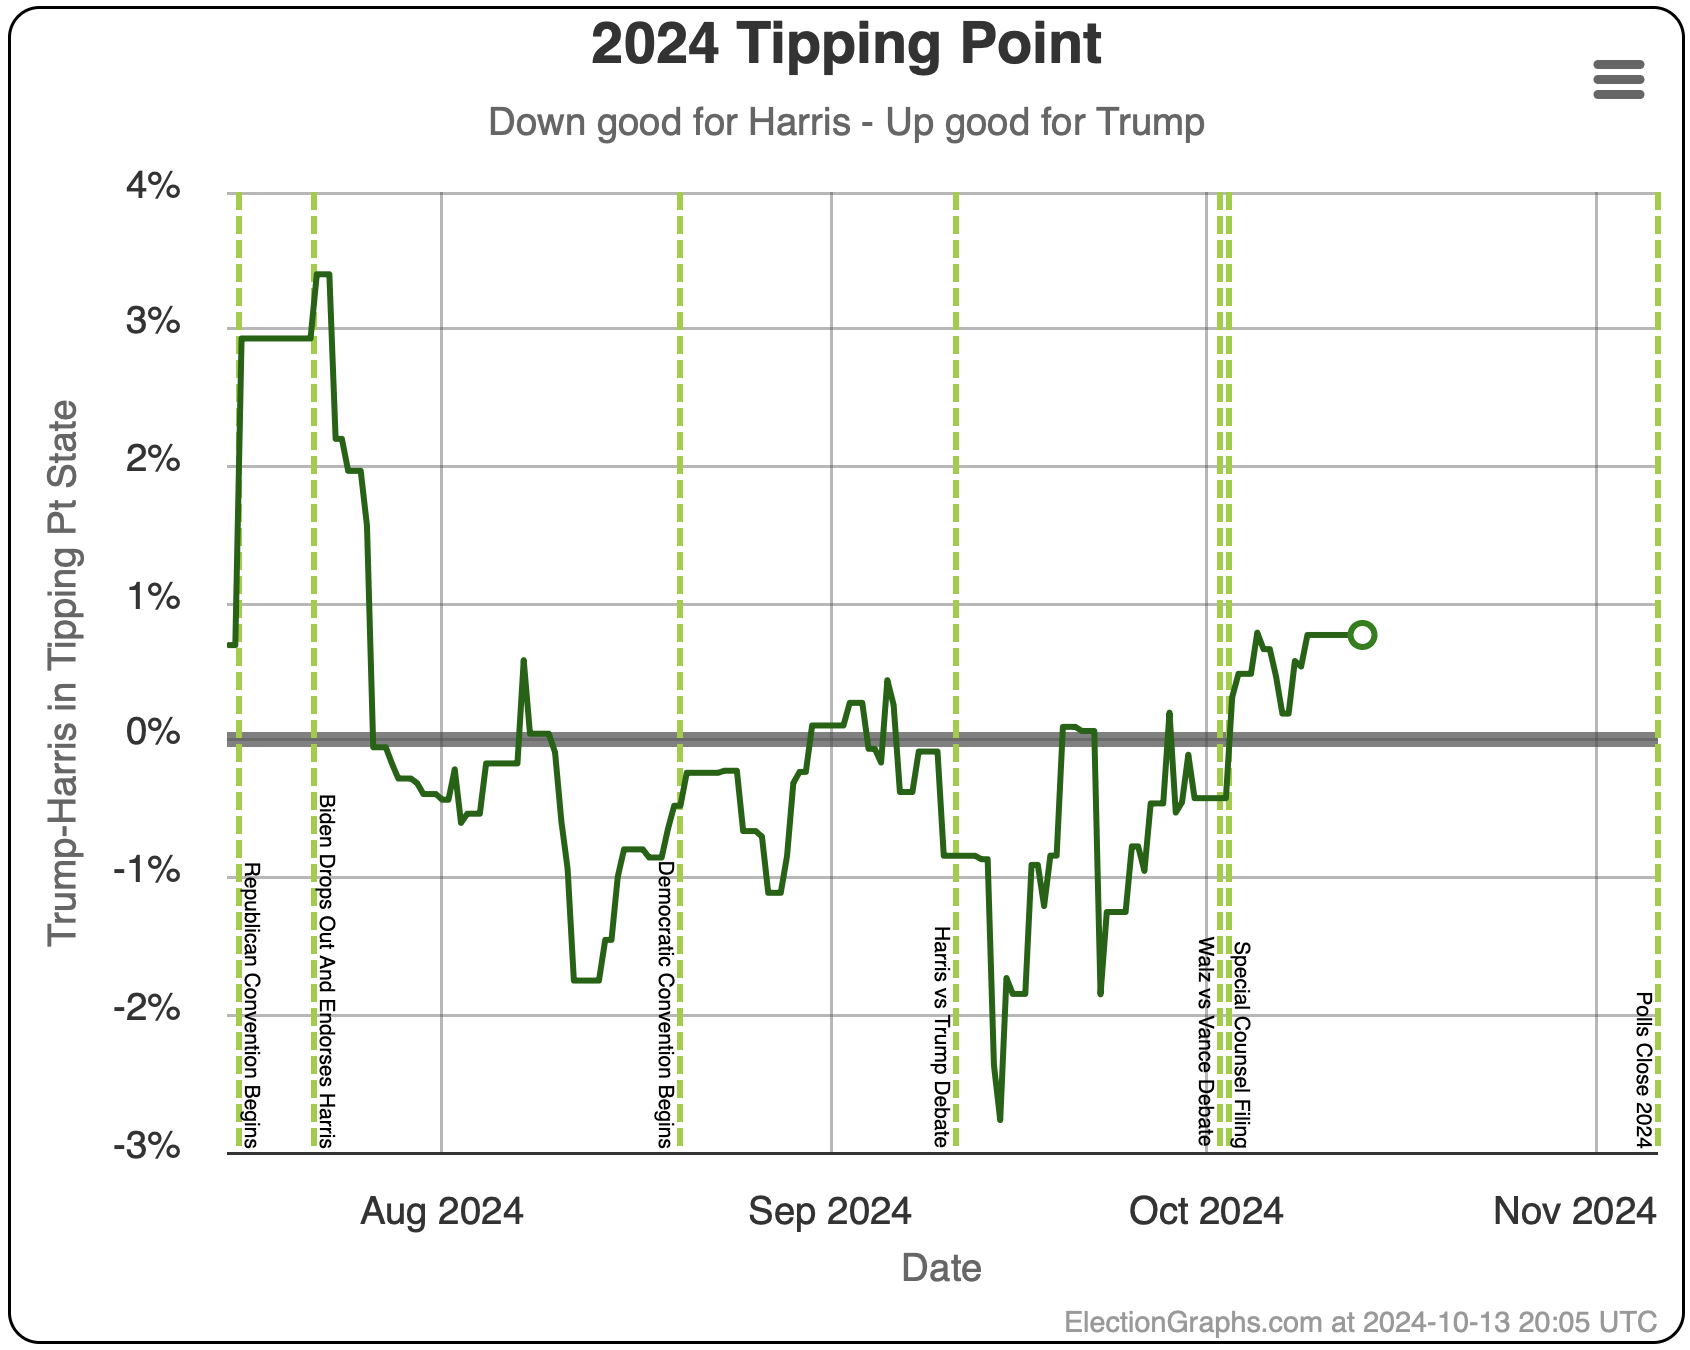
Looking at this view, it does look like Trump has managed to break the race out of the range it had been in since the end of July. It is still close, but this is an improvement for Trump compared to where things were before.
Trump now leads by 0.9% in this metric. Just looking at the graph above, you see plenty of examples of 0.9% moves happening essentially overnight. So this is a lead, but a tenuous one that could easily disappear with a bad day of polling.
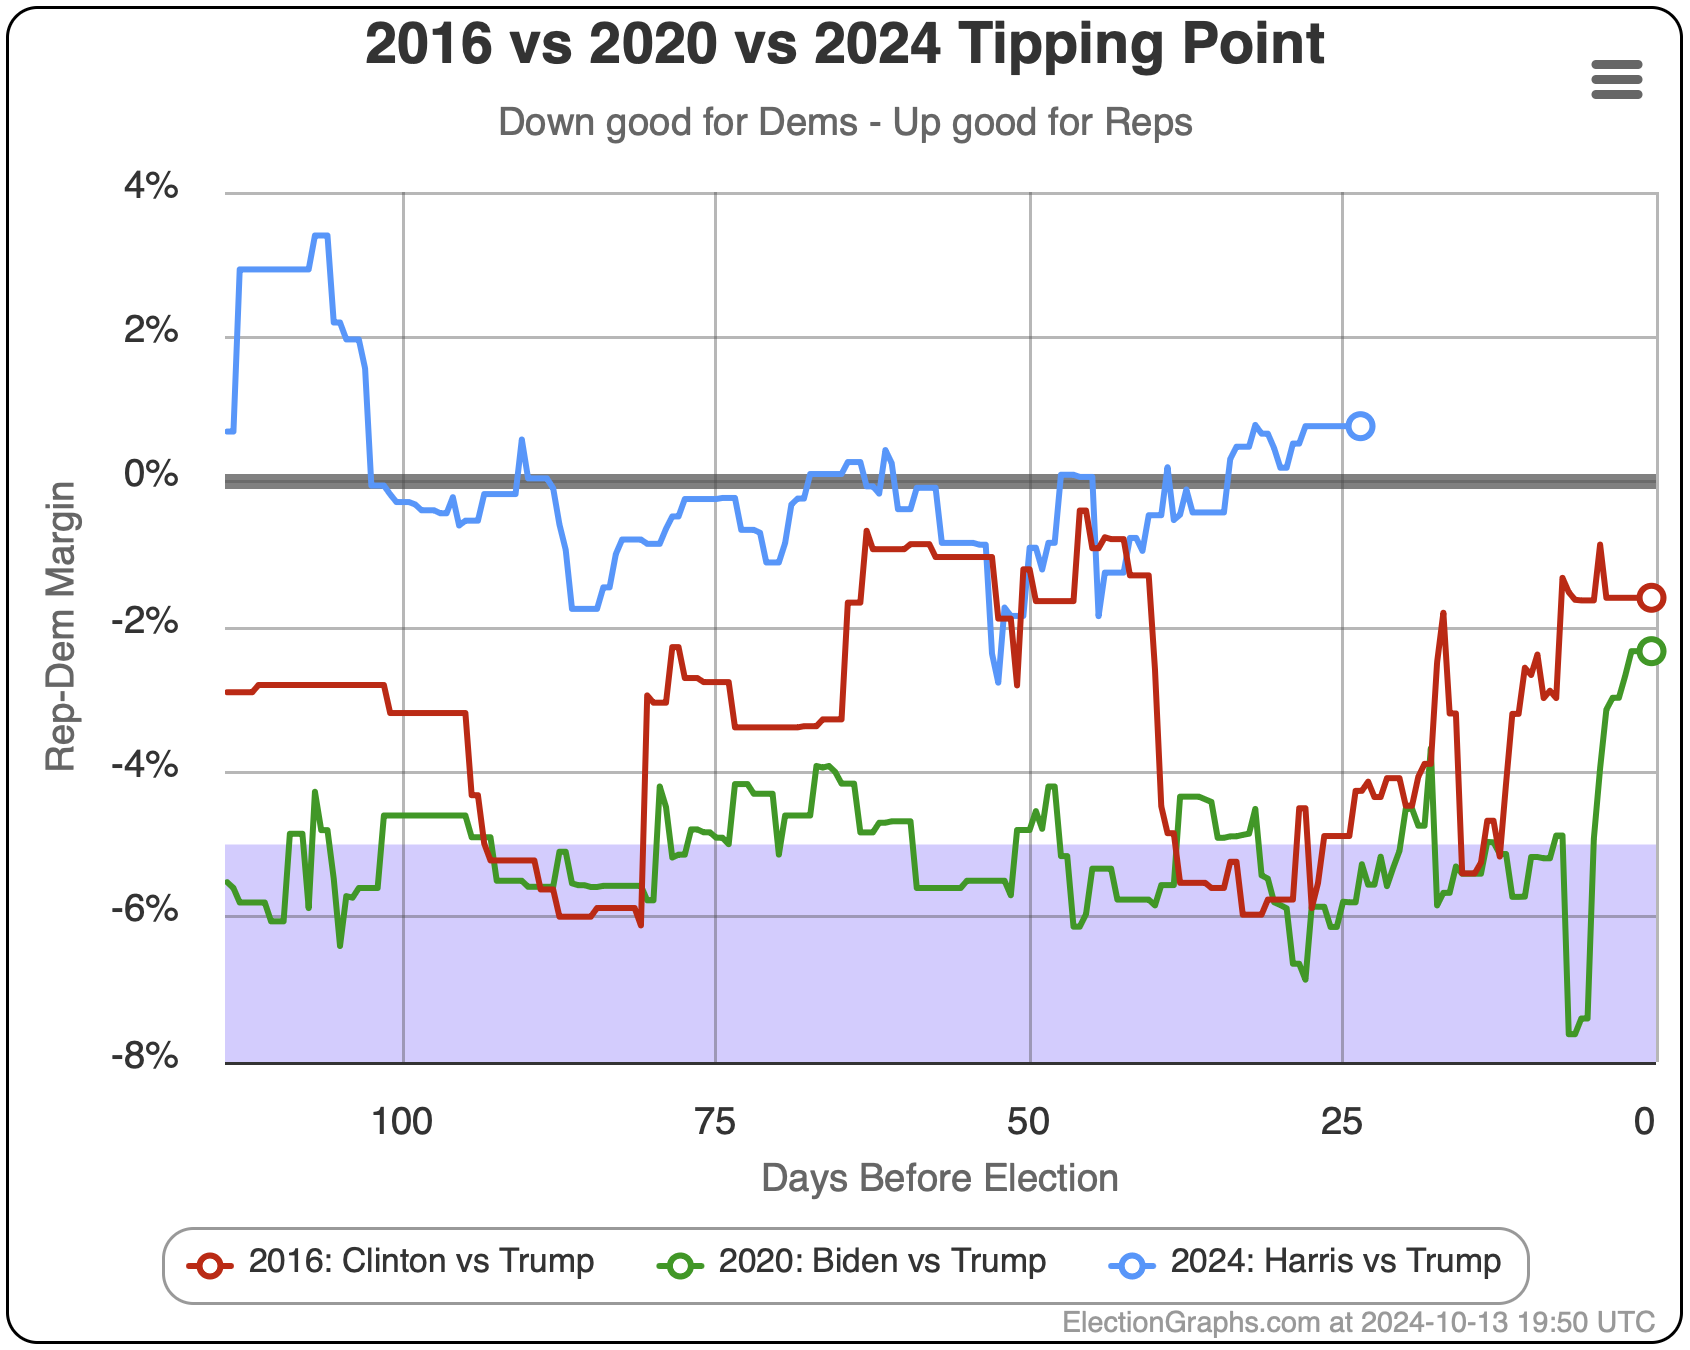
But when you add in the 2016 and 2020 lines, the situation starts looking a lot more dire for Harris.
She is running about 6.4% behind where Biden was 4 years ago, and he ended up barely winning.
And she is running about 4.9% behind where Clinton was 8 years ago, and of course she ended up losing.
Harris needs either a big move in the remaining days of the race, or she needs the polling this time around to be underestimating her instead of underestimating Trump like it has the last couple of cycles.
There are reasons to think that might happen. A good case could be made for it. But we won't know the truth about that until the votes are counted and final.
The Election Graphs probabilistic views are based on looking at how far off the EG state by state averages were from the final election results in 2008, 2012, 2016, and 2020. The underestimations of Trump in 2016 and 2020 are a big part of that, and end up outweighing the underestimations of Obama in 2008 and 2012.
Basically, even if the straight poll averages showed a complete tie race, which is better than Harris is actually doing right now, the EG odds would still favor Trump.
To favor Harris, we'd have to see her build up a bit of a polling lead in the critical swing states, not just a tie. So in the current situation, she isn't doing great in our odds:
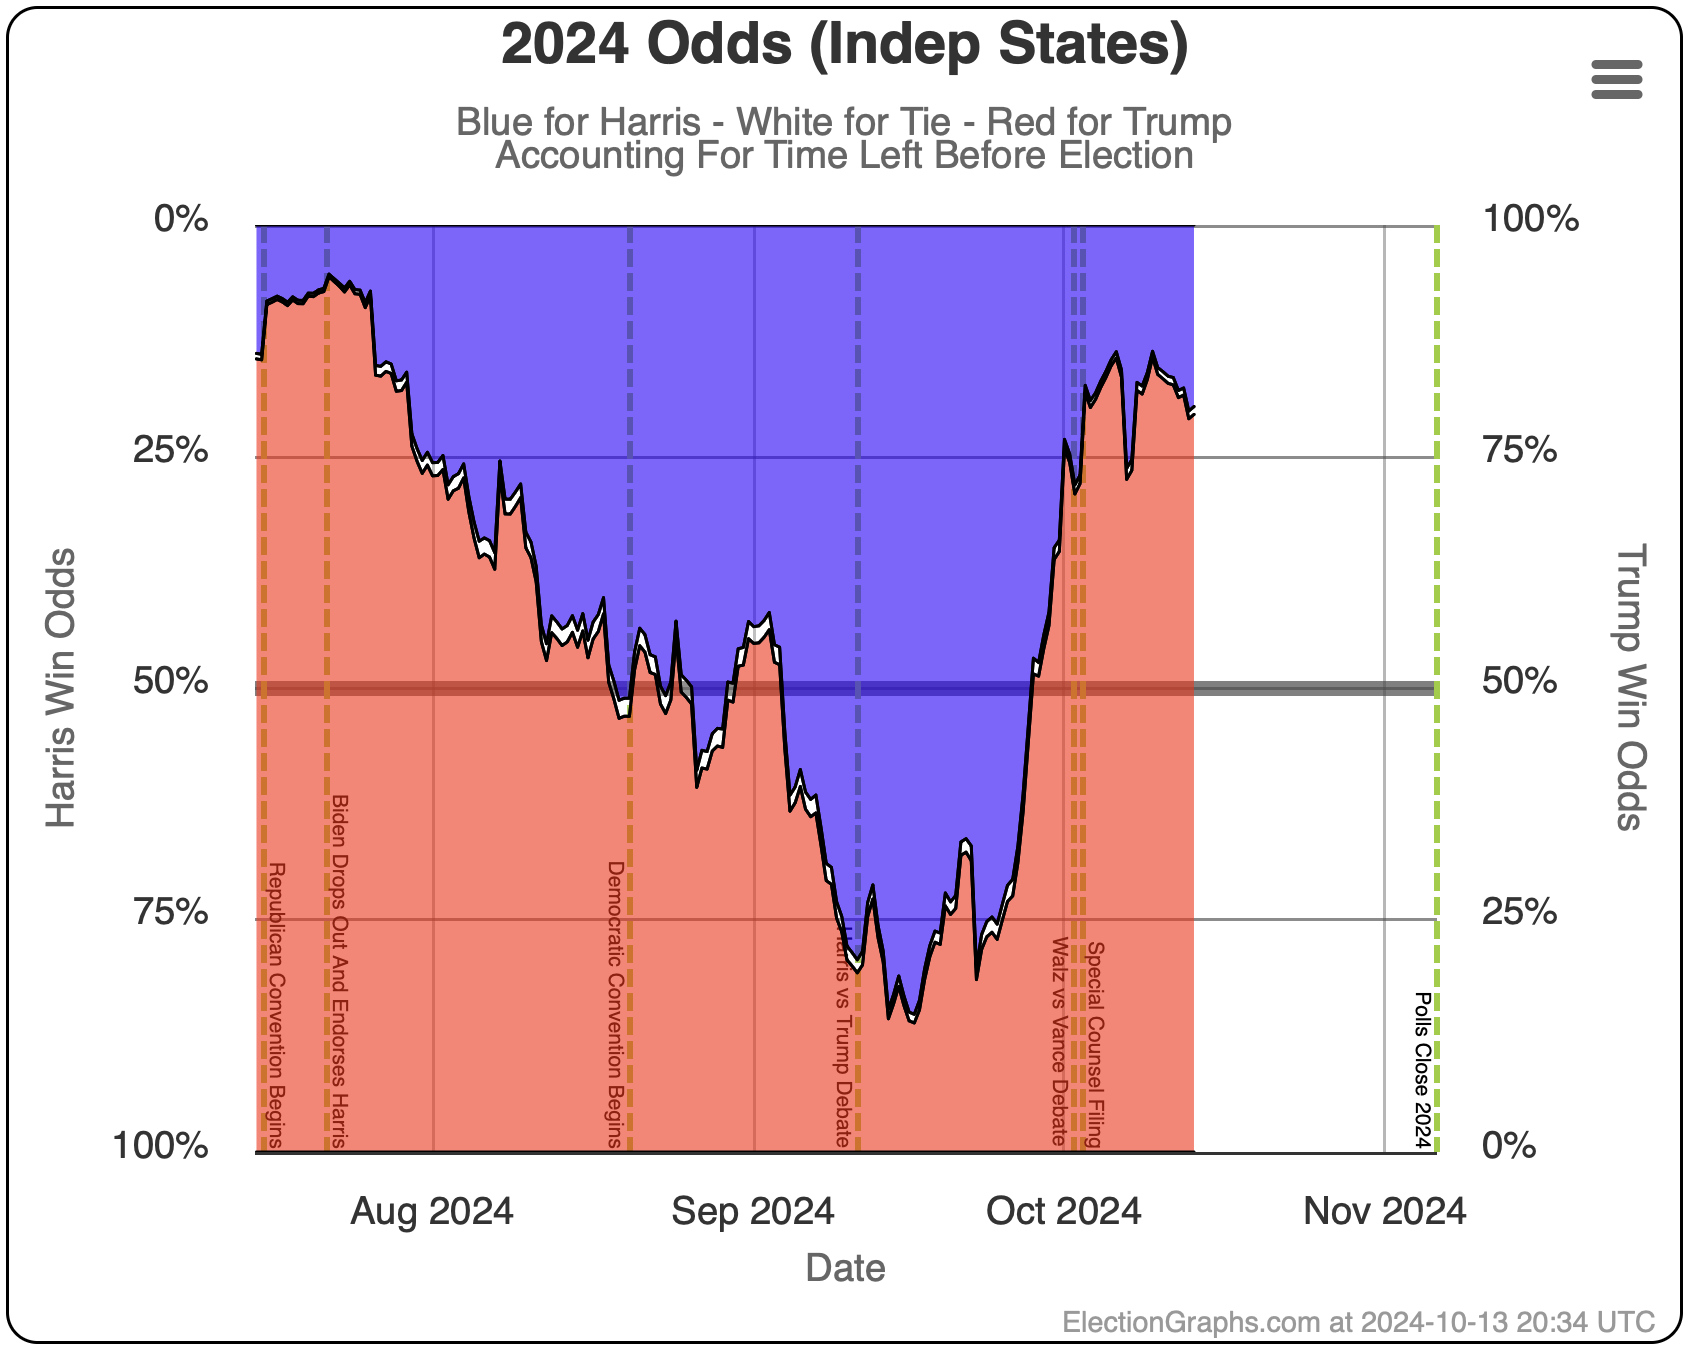
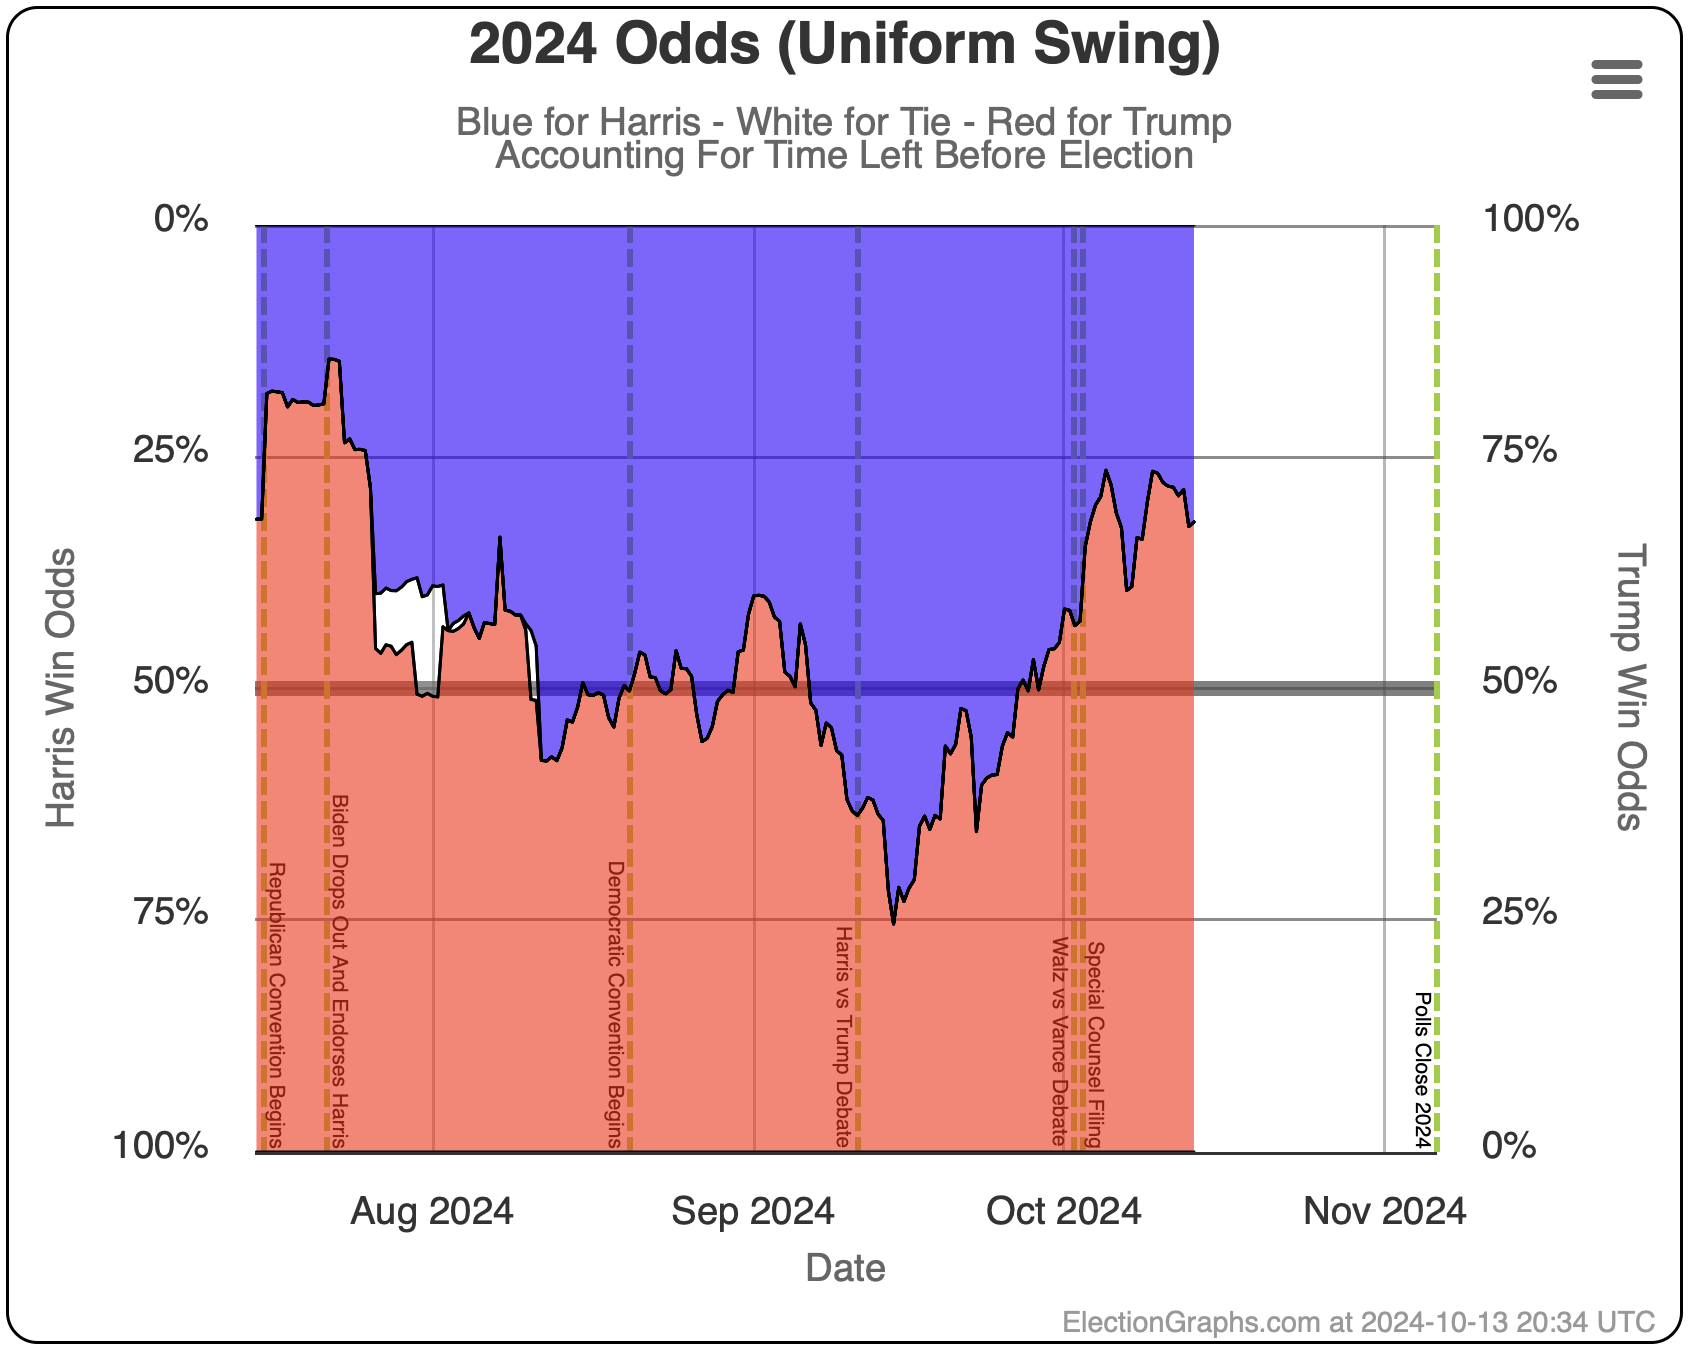
Accounting for the 23 days left, our models give Harris between a 19.6% and 32.0% chance of winning the electoral college. Probably closer to the 32.0% given that there probably will be a decent amount of correlation between polling errors in the various close states.
The "if the election was today" numbers are a bit lower, ranging from 14.5% to 26.9%. The higher numbers given 23 days remaining reflect that there is still time for Harris to improve her polling numbers in the key states before the election.
But the numbers being lower than you would expect just from Trump's narrow lead alone mainly reflect the built in assumption that the polls are probably underestimating Trump again, because over the last four election cycles, they have underestimated the Republican in the close states more often than not.
If we knew for sure that the polls would be evenly biased this time around, or that the polls would actually be underestimating Harris, these numbers would be a lot closer to even.
Because of the above, plus EG being really reactive to the newest polls, many of which show Trump leading in swing states right now, EG is currently a lot more bearish on Harris than other places giving odds. So I'm a bit of an outlier. Everybody else is a lot closer to 50/50 right now.
We shall see.
But even with my more pessimistic view, it is important not to fall into "rounding the odds". There seems to be a human tendency to try to reduce things to either being 100% certain or being a 50/50 coin toss. A 30/70 split is neither of those things. The 70% is favored, but 30% is still an outcome that wouldn't be surprising at all.
With things this close in so many states, the race really is still best characterized as too close to call.
People keep asking too much of polling. If someone is going to end up winning by 60/40, or even 55/45, polling and polling averages can do pretty decently at predicting the winner. But telling the difference between 52/48 and 48/52? That's hard. You have to get lucky, and will get it "wrong" a lot.
We just happen to be in a universe right now where the outcome depends on 7 states that are ALL potentially that close.
So the polling only ends up telling you that it is too close to predict accurately.
And with that, here is the new map:
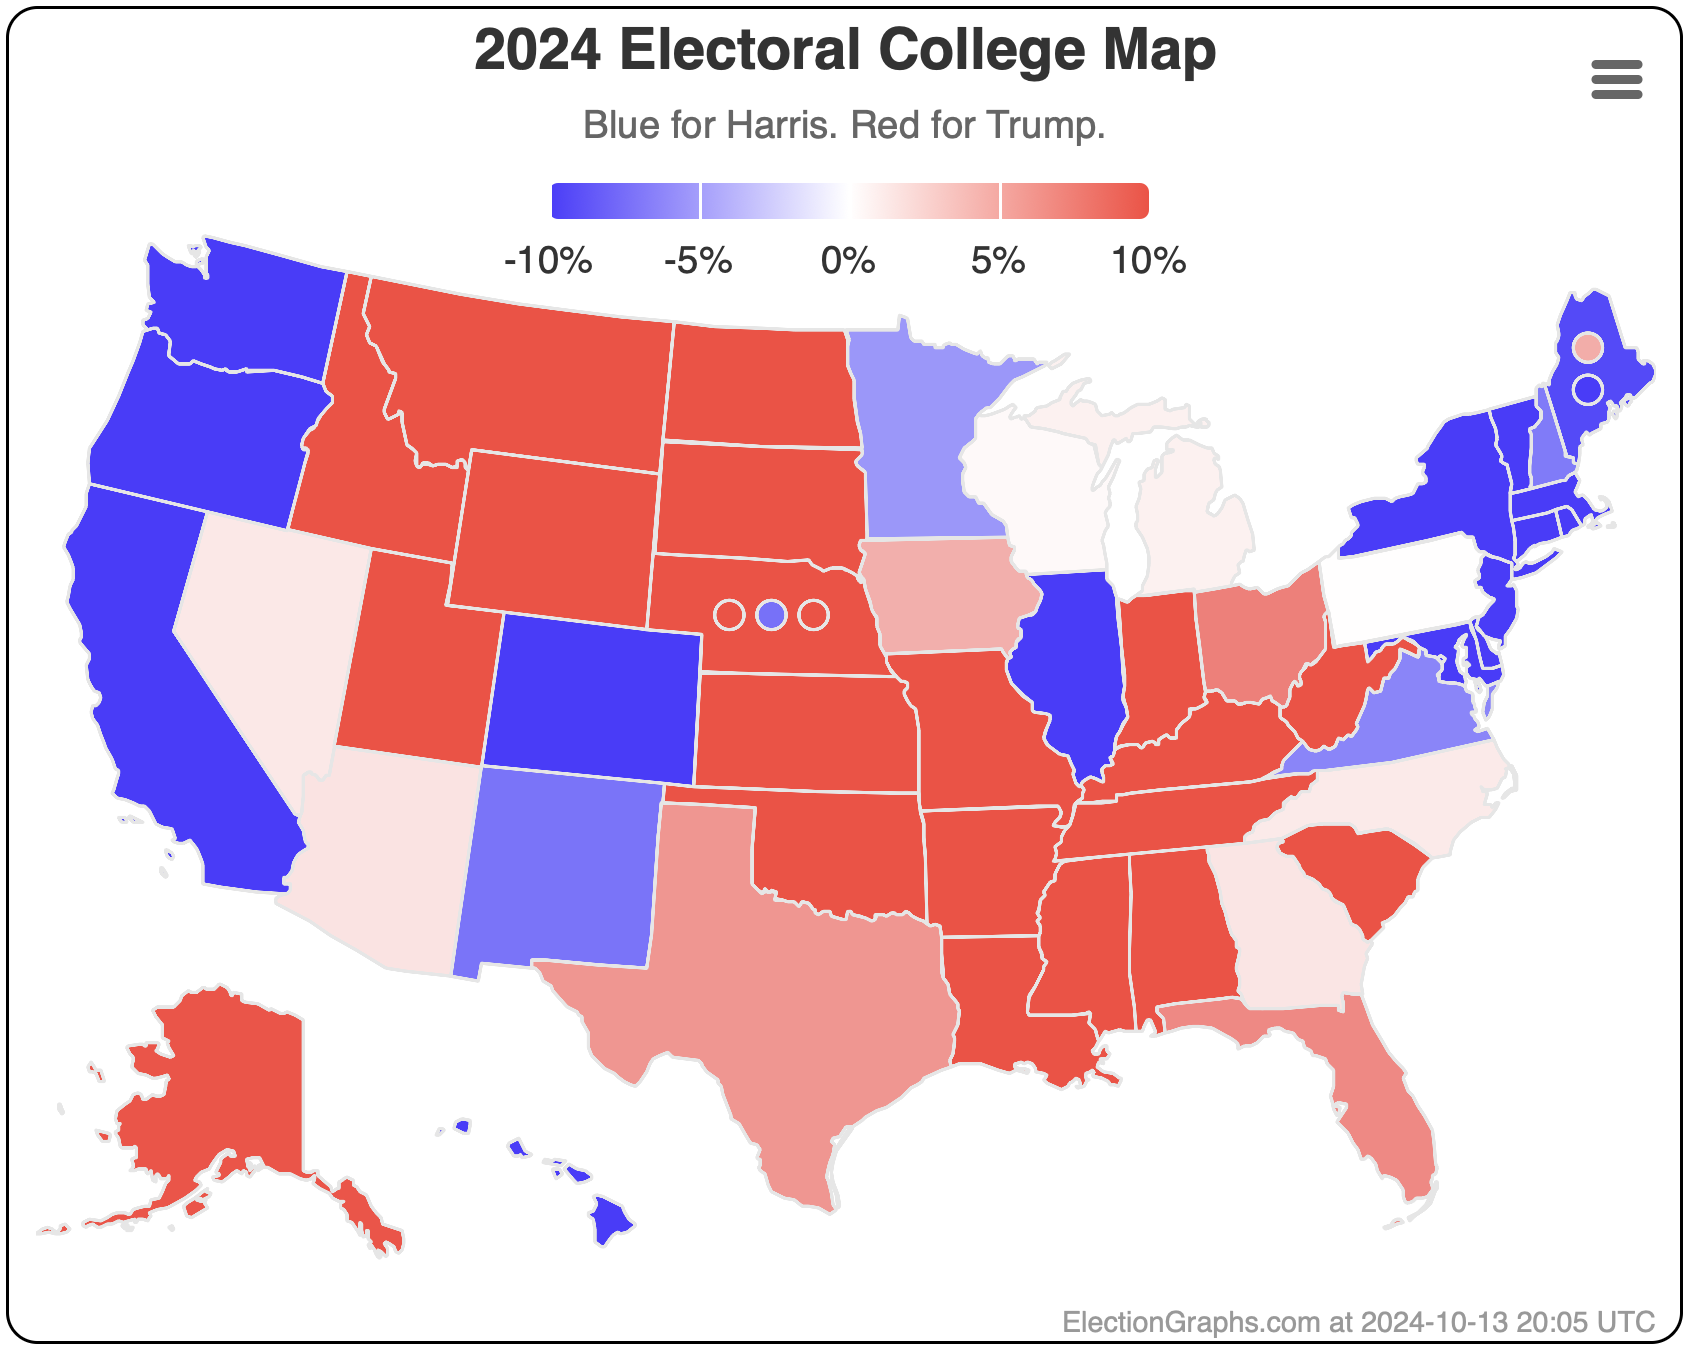
22.6 days left. Gulp.