It has only been 14 days since my last post. The 42 days we have left is only 6 weeks. It is time to do these posts more often. So here we go.
Last time our summary line was "a toss up situation, but one where Harris had the momentum".
This time I'd say "a toss up situation, where Harris has a slight edge, but the race is pretty static".
If a summary is all you want, there you go. If you want to dig in to more of the changes since last time, keep going.
As we have before, I'll start by seeing how the spectrum of states has changed since last time.
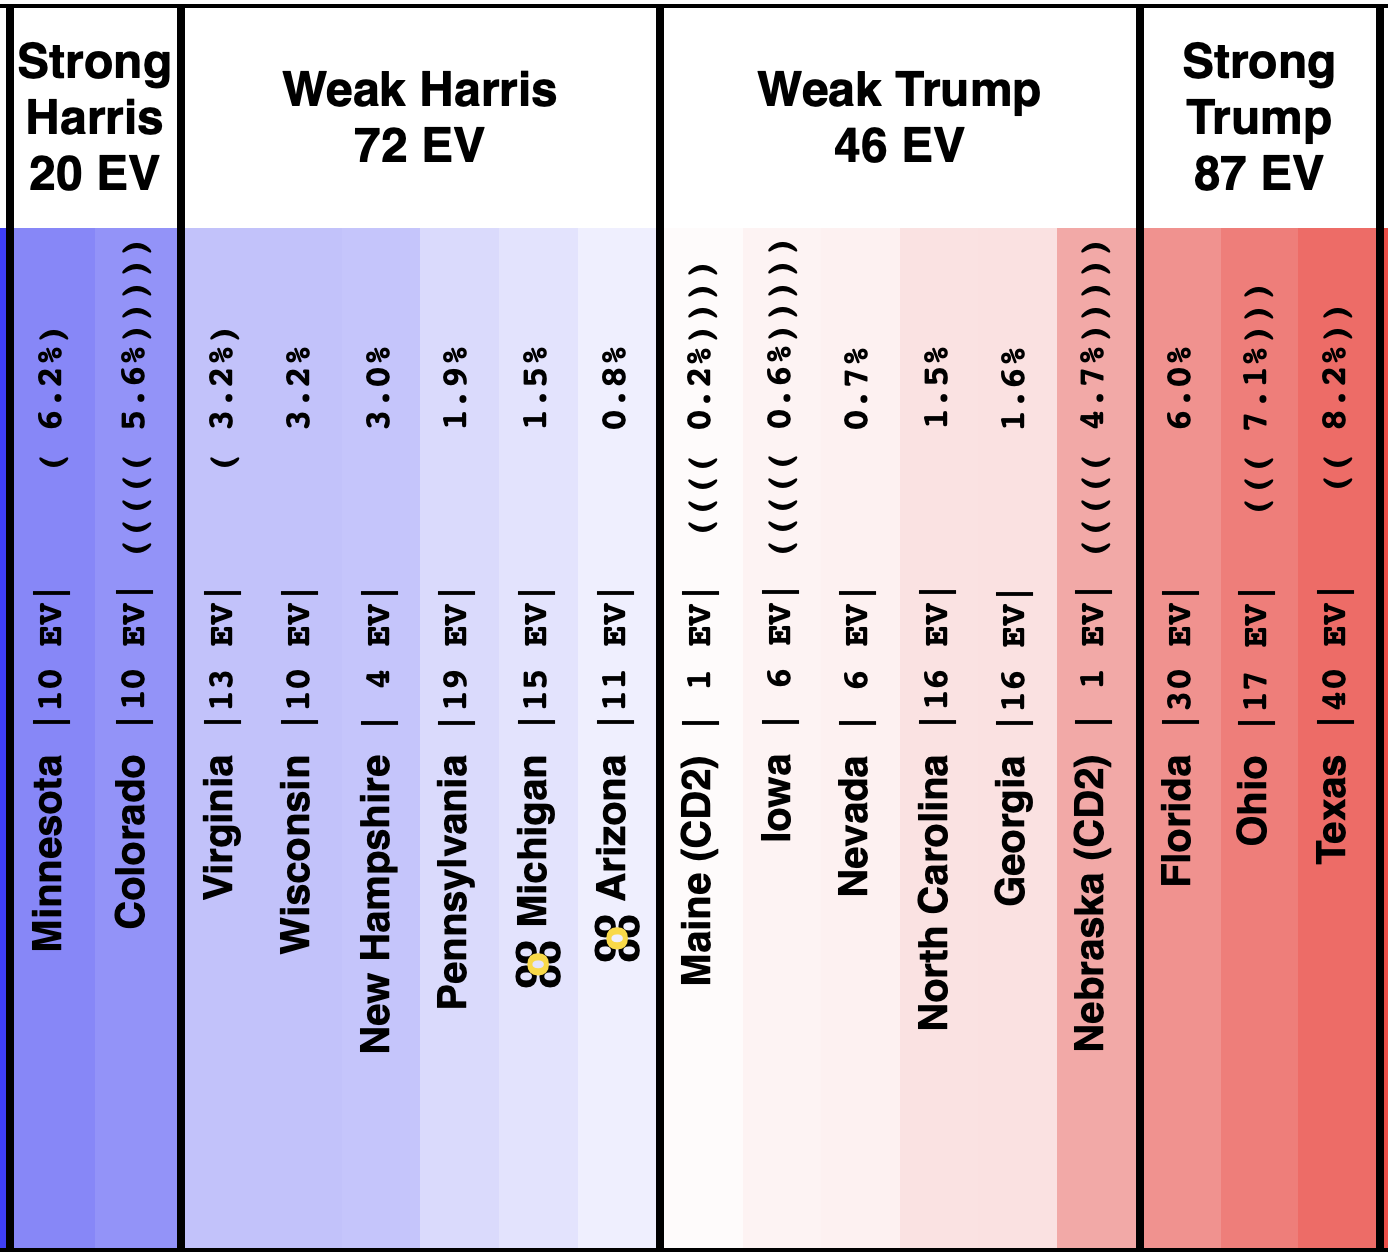
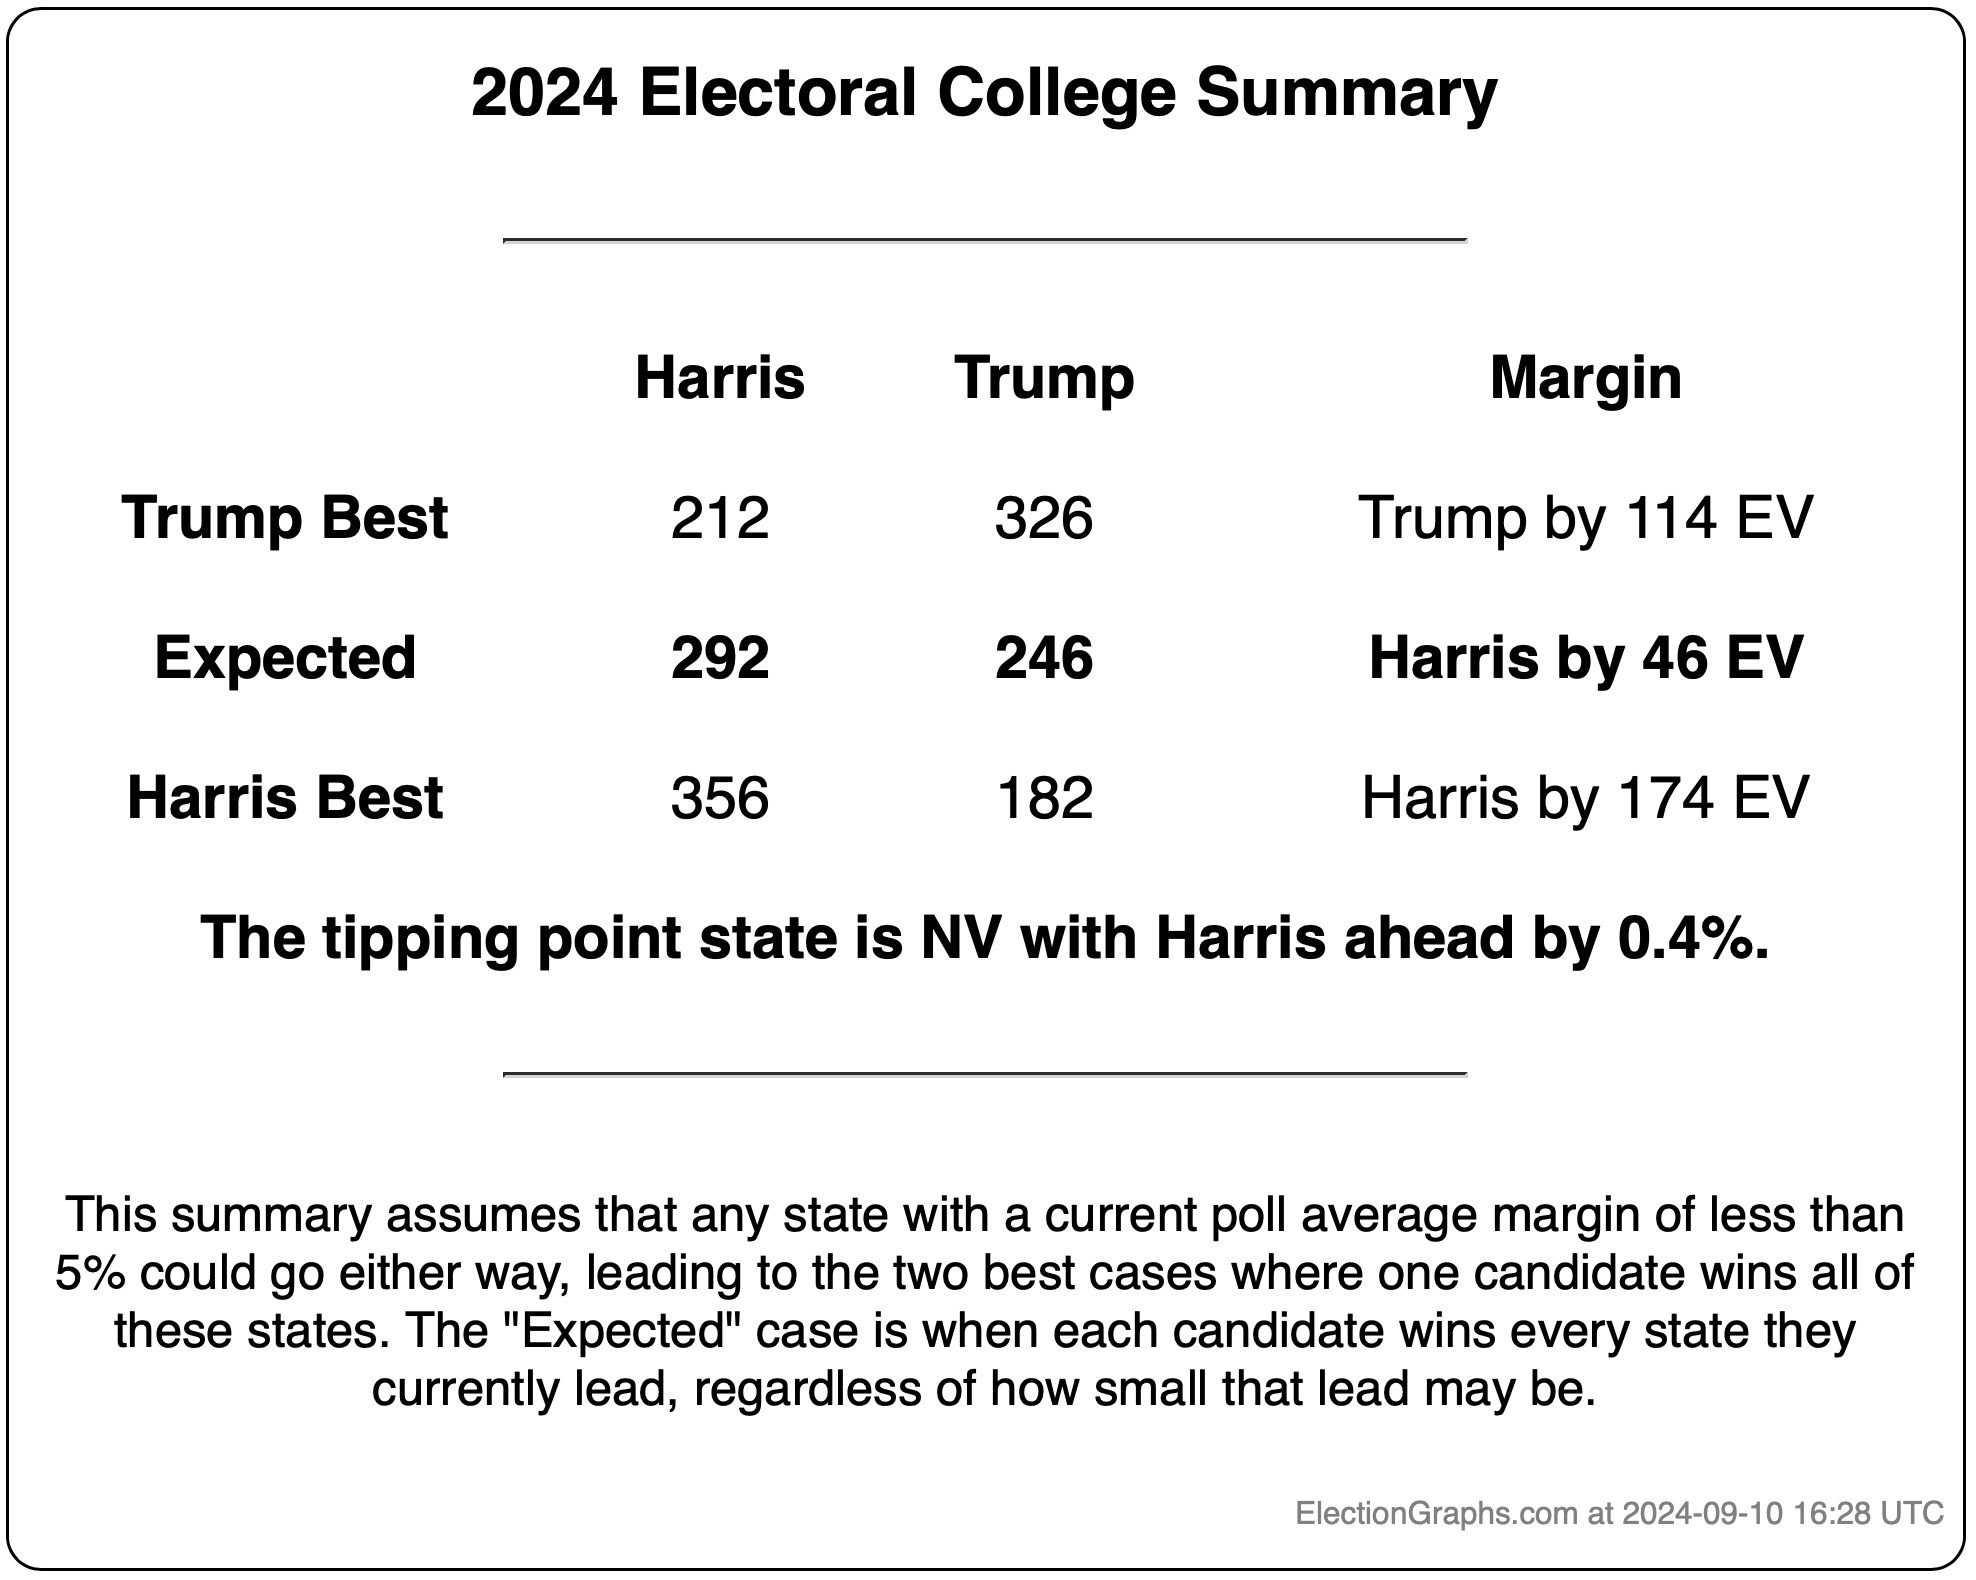
On 2024-09-10 things looked like this:
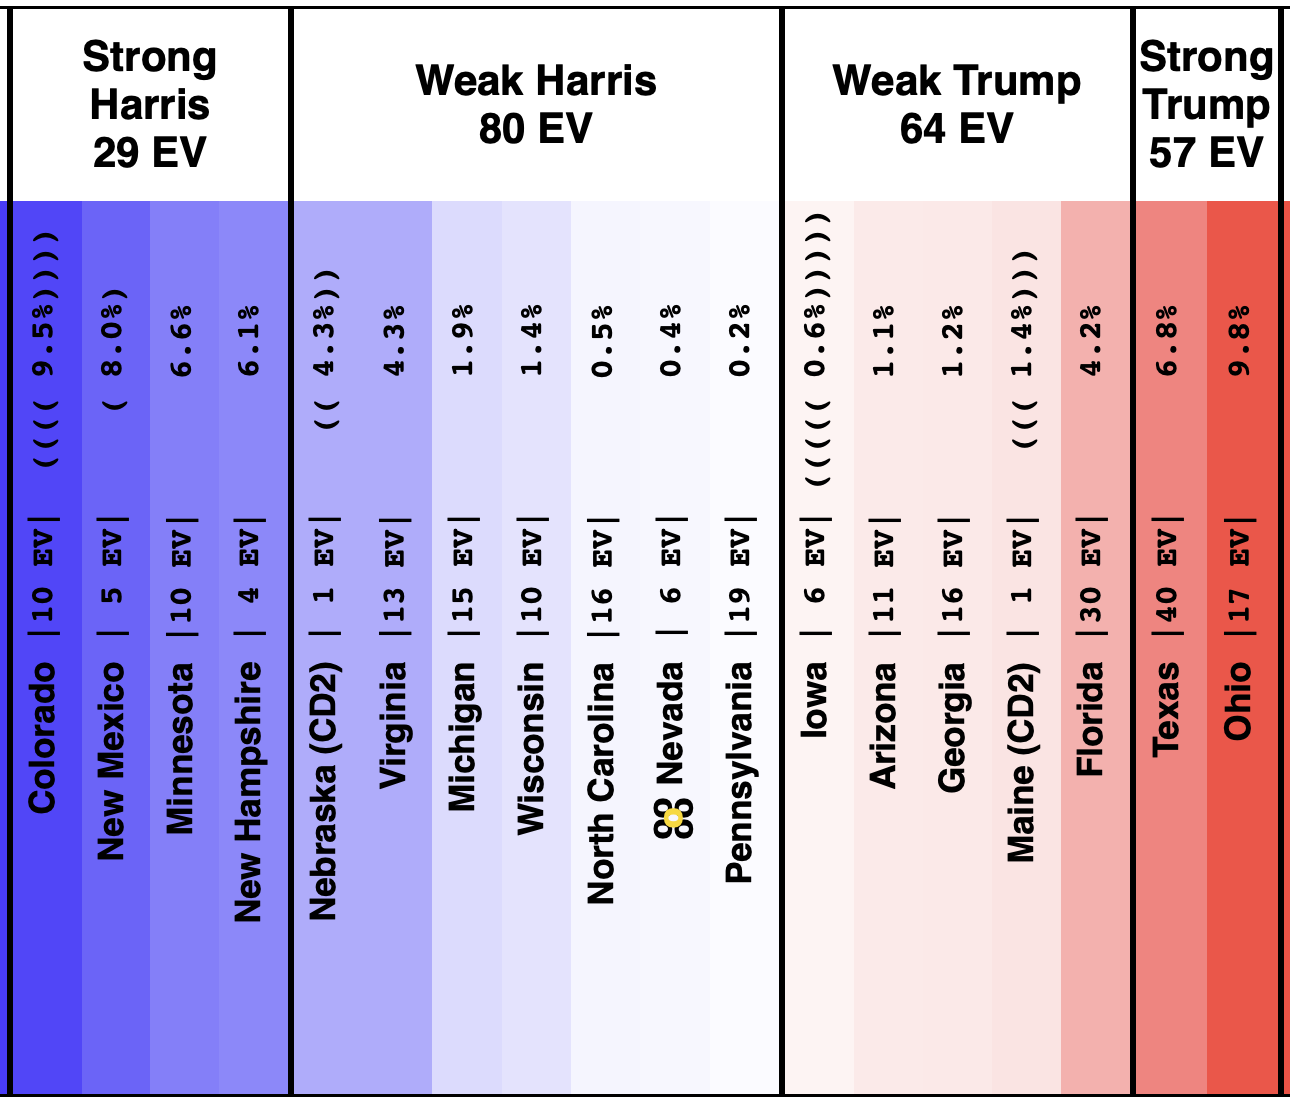
And as now of 2024-09-25:

Last time there were 144 electoral votes in the "weak" categories where things could very reasonably go either way. Now there are only 131 electoral votes in that category, but that is still huge.
Narrowed from the states with a margin under 5%, to just those under 2%, there are STILL 84 electoral votes that are too close to call. 78 if you remove Iowa (which has only had one Harris vs Trump poll and is likely redder than is indicated here).
And the tipping point state is right in the middle of those close states.
This is all just to say that this race remains "too close to call". Every single one of the models on Election Graphs show both a Harris win and a Trump win to be reasonably possible.
OK, now how have the states moved since last time?
Movement toward Trump:
- Maine-CD2 (1 EV): Trump by 1.4% -> Trump by 4.5% (Trump+3.1%)
- North Carolina (16 EV): Harris by 0.5% -> Trump by 0.8% (Trump+1.3%)
- Maine-All (2 EV): Harris by 10.6% -> Harris by 9.3% (Trump+1.3%)
- Minnesota (10 EV): Harris by 6.6% -> Harris by 5.8% (Trump+0.8%)
- Iowa (6 EV): Trump by 0.6% -> Trump by 1.3% (Trump+0.7%)
- New Mexico (5 EV): Harris by 8.0% -> Harris by 7.9% (Trump+0.1%)
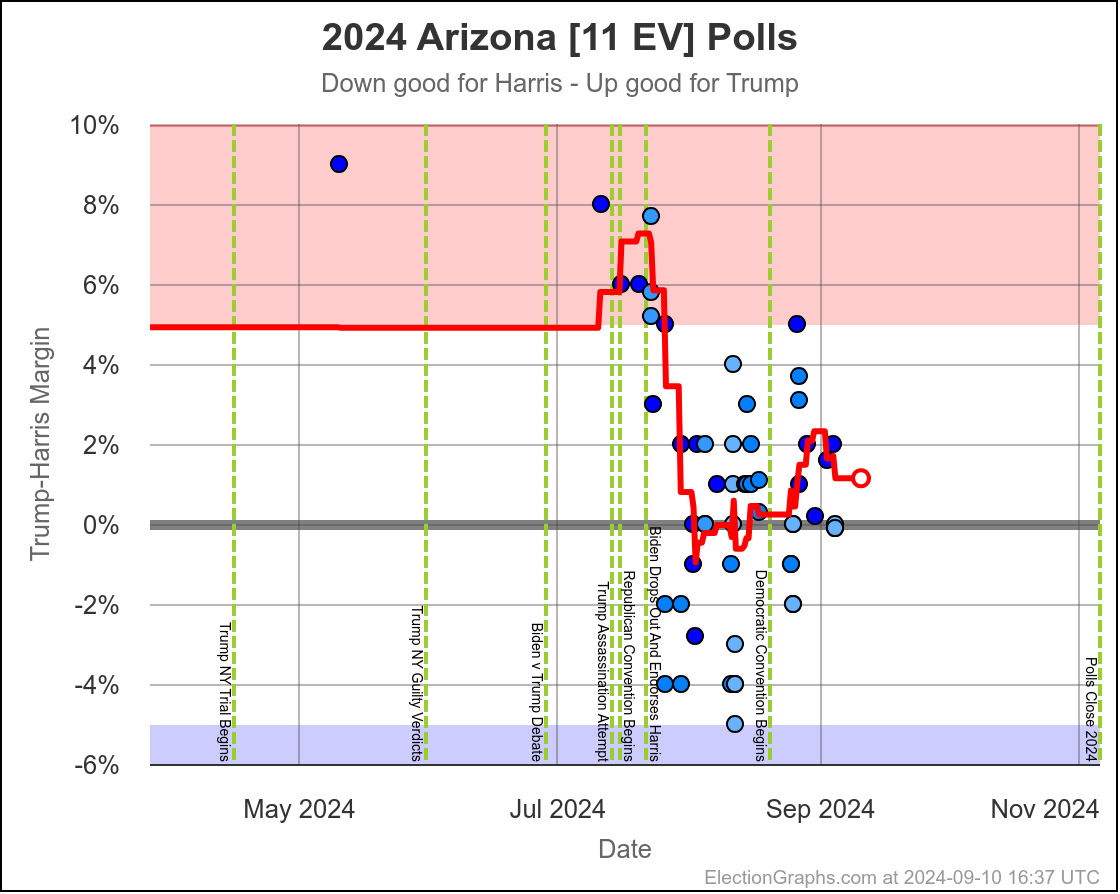
- Arizona (11 EV): Trump by 1.1% -> Trump by 1.2% (Trump+0.1%)
No Movement:
- Nebraska-CD2 (1 EV): Harris by 4.3%
Movement toward Harris:
- Georgia (16 EV): Trump by 1.2% -> Trump by 1.0% (Harris+0.2%)
- Colorado (10 EV): Harris by 9.5% -> Harris by 9.8% (Harris+0.3%)
- Wisconsin (10 EV): Harris by 1.4% -> Harris by 1.7% (Harris+0.3%)
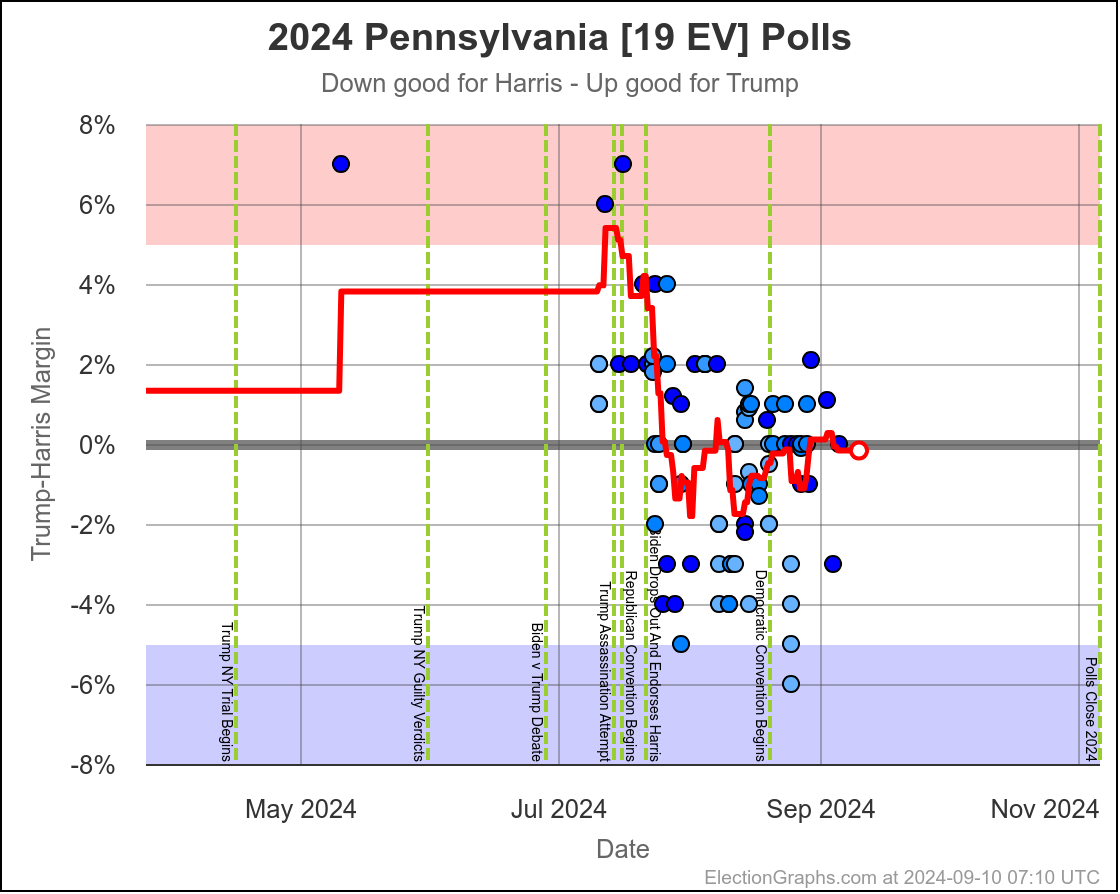
- Pennsylvania (19 EV): Harris by 0.2% -> Harris by 0.5% (Harris+0.3%)
- Ohio (17 EV): Trump by 9.8% -> Trump by 9.4% (Harris+0.4%)
- Florida (30 EV): Trump by 4.2% -> Trump by 3.7% (Harris+0.5%)
- Michigan (15 EV): Harris by 1.9% -> Harris by 2.8% (Harris+0.9%)
- Texas (40 EV): Trump by 6.8% -> Trump by 5.9% (Harris+0.9%)
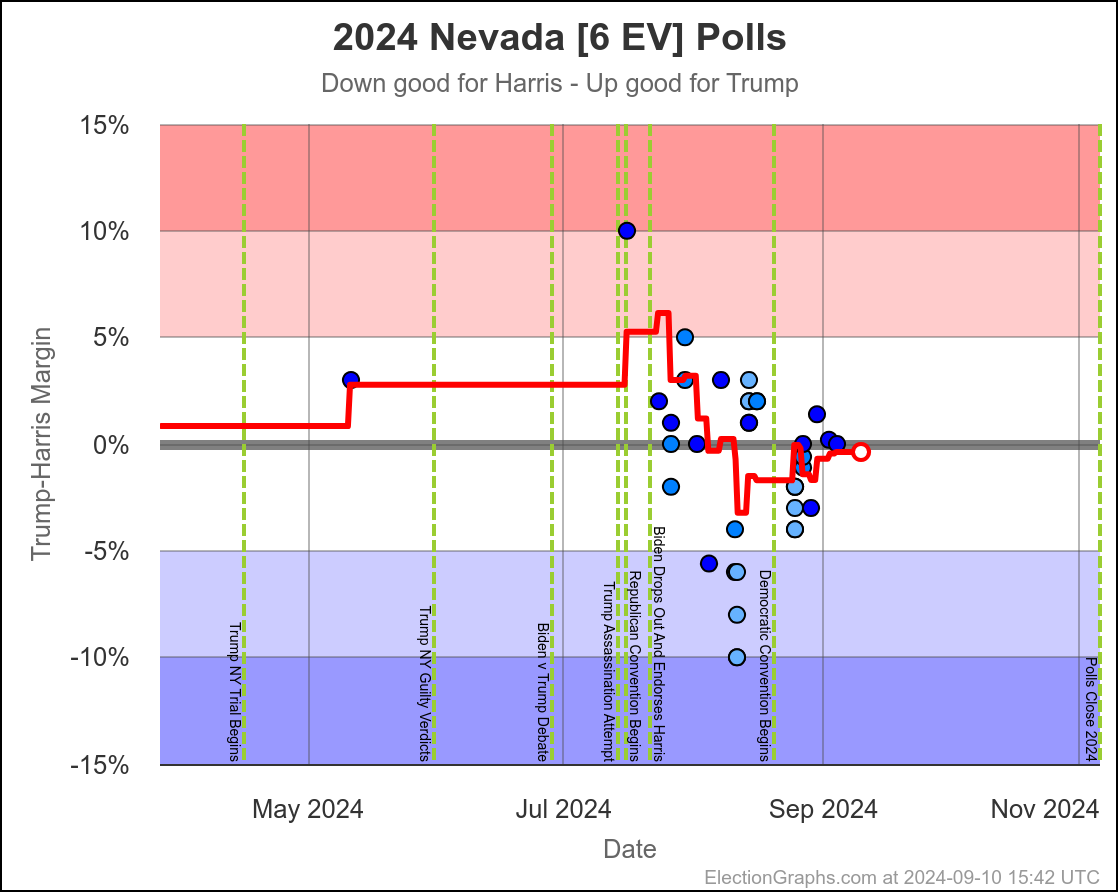
- Nevada (6 EV): Harris by 0.4% -> Harris by 1.5% (Harris+1.1%)
- New Hampshire (4 EV): Harris by 6.1% -> Harris by 7.4% (Harris+1.3%)
- Virginia (13 EV): Harris by 4.3% -> Harris by 7.0% (Harris+2.7%)
More have moved toward Harris (11) than toward Trump (7).
But the one state that flipped sides was North Carolina, which moved from Harris to Trump.
And the tipping point only moved by 0.1% (from Harris by 0.4% in Nevada, to Harris by 0.5% in Pennsylvania).
All this together means that while there has been lots of churn, the overall picture hasn't changed that much in the last two weeks.
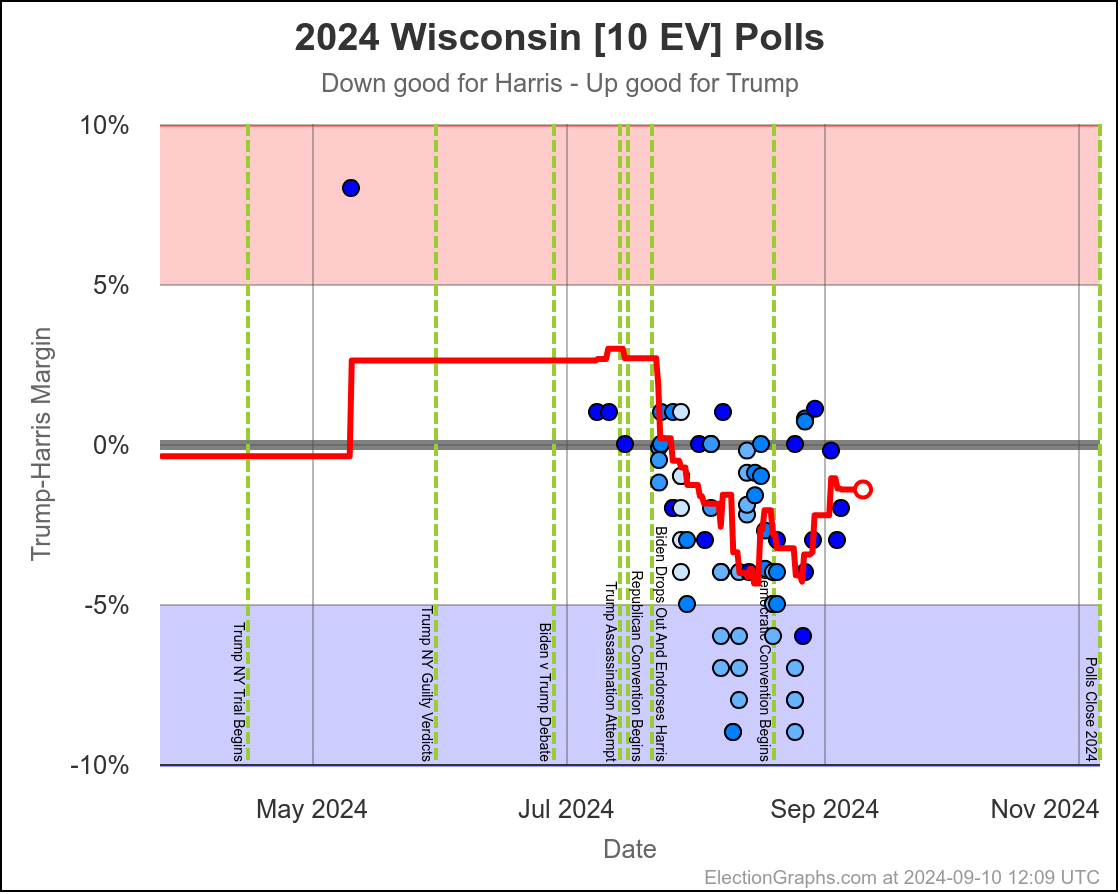
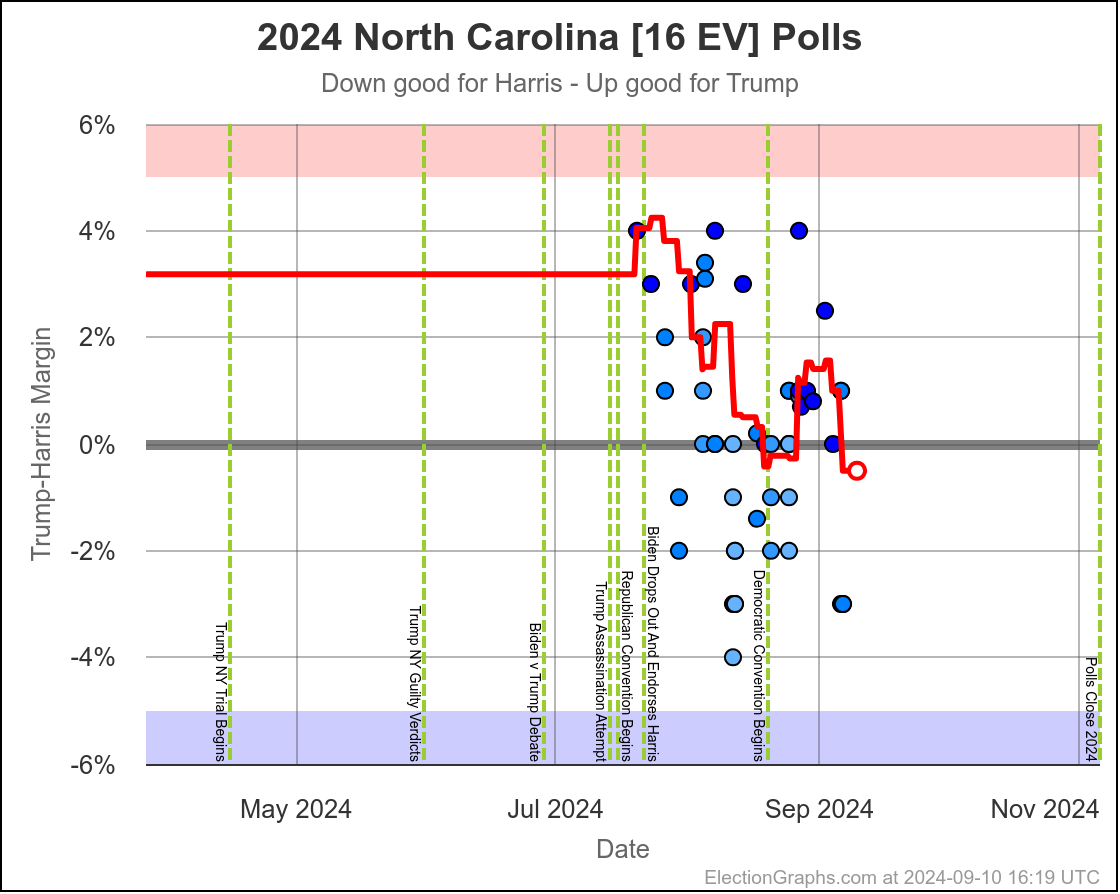
Here are the charts for the tipping point state and the three states on either side. This corresponds to the "seven swing states" that get talked about most often these days.


Every single one of these seven states shows the same high level pattern. A rapid move toward Harris after she became the nominee, but then they just essentially bounce around within a range.
Michigan, Wisconsin, Nevada, and Pennsylvania have all MOSTLY stayed on the Harris side of the center line, with only brief ventures onto the Trump side.
North Carolina, Georgia, and Arizona are the opposite, staying MOSTLY on the Trump side of the center line, with only brief ventures onto the Harris side.
If the current leader in each of these states win, then you end up with a narrow Harris win. (Harris 276 to Trump 262)
All of these states are close states though. They are all close enough that both outcomes are reasonably probable.
We're talking about the "underdog" in one of these states having a 30% to 40% chance of winning, even in the ones of these states with the largest margins.
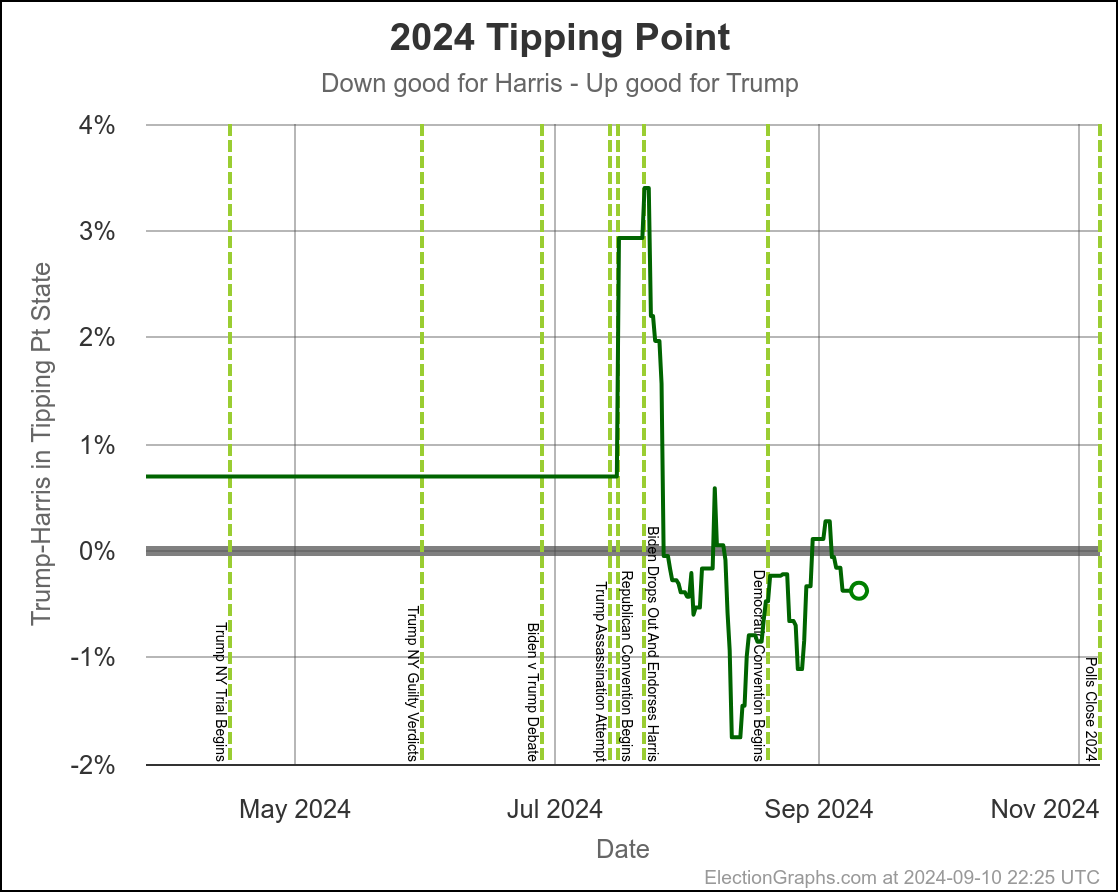
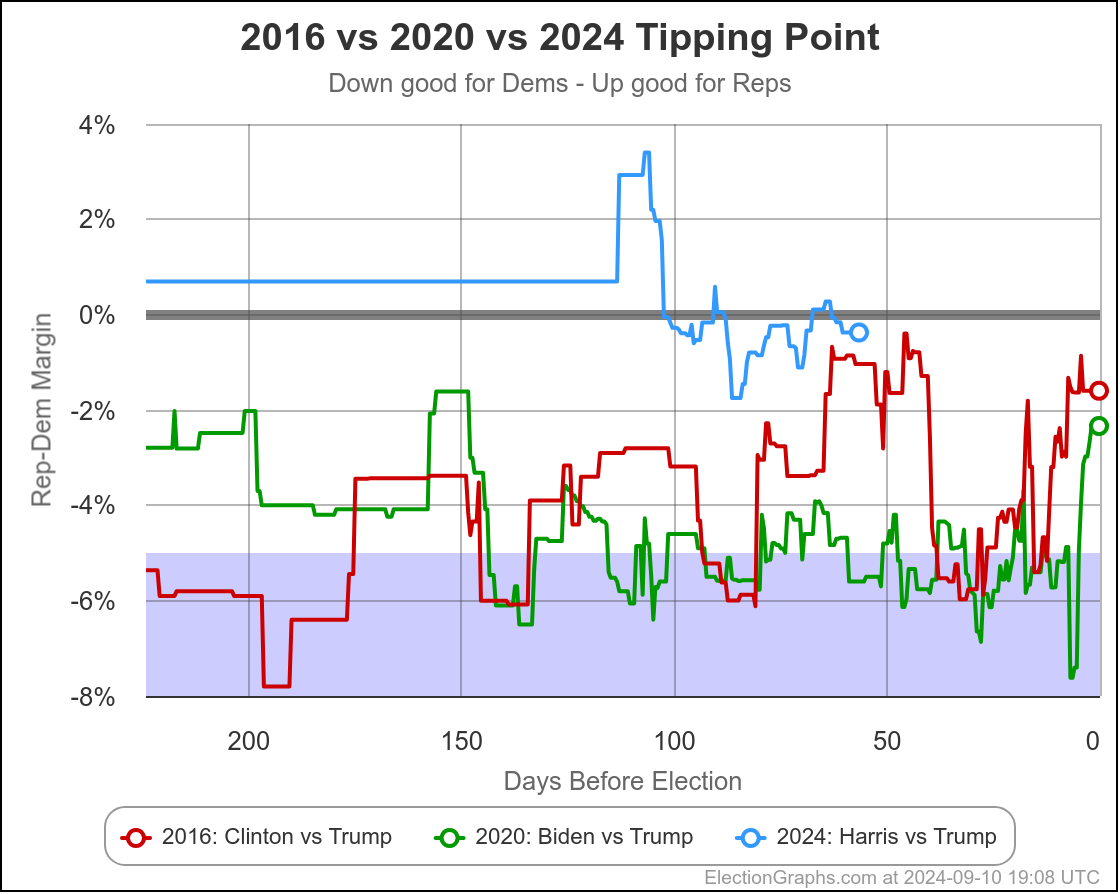
Looking at the tipping point (the margin in the state that would put the winner over the top) you can see this closeness in another way:

Basically, ever since late July, the tipping point has just bounced around between the tie line and a 2% Harris lead (with a couple very brief forays outside that zone).
Harris has been behind where Clinton was 8 years previously except for a couple very brief moments, and has NEVER been even close to where Biden was 4 years ago.
Even taking the high end of this range for Harris, a 2% lead can easily disappear in a few days with the wrong news cycle, and of course we have seen polling errors larger than that.
- 2008: Obama's tipping point was 3.45% better than predicted by EG.
- 2012: Obama's tipping point was 0.89% better than predicted by EG.
- 2016: Trump's tipping point was 2.36% better than predicted by EG.
- 2020: Biden's tipping point was 1.41% worse than predicted by EG.
The EG tipping point underestimated the Democrat in 2008 and 2012.
The EG tipping point underestimated the Republican in 2016 and 2020.
Which will happen this time?
You can easily come up with a lot of reasons to think this time polls are underestimating Harris. Poll performance in 2022 and special elections and referenda since then. A potential enthusiasm gap. Pollsters overcompensating for errors in 2016 and 2020. Etc.
But you can also come up with reasons polls may still be underestimating Republicans. Trump supporters still don't trust or respond to pollsters, just as they didn't in 2016 or 2020. Or pollsters just aren't properly modeling turnout and are underestimating turnout of Trump demographics. Etc.
Honestly, my gut is that polls may be underestimating Harris this time. But that is nothing more than a gut feeling, and could easily be wrong.
We know there will be polling error. There is always polling error. It is inevitable. There are fundamental limits to polling techniques.
If one candidate is winning convincingly, it doesn't matter. The difference between a candidate winning by 12% or by 14% is a difference not many people care about. Either way the candidate wins.
But if that is a difference between one candidate winning by 1% or the other candidate winning by 1%, it makes a huge difference.
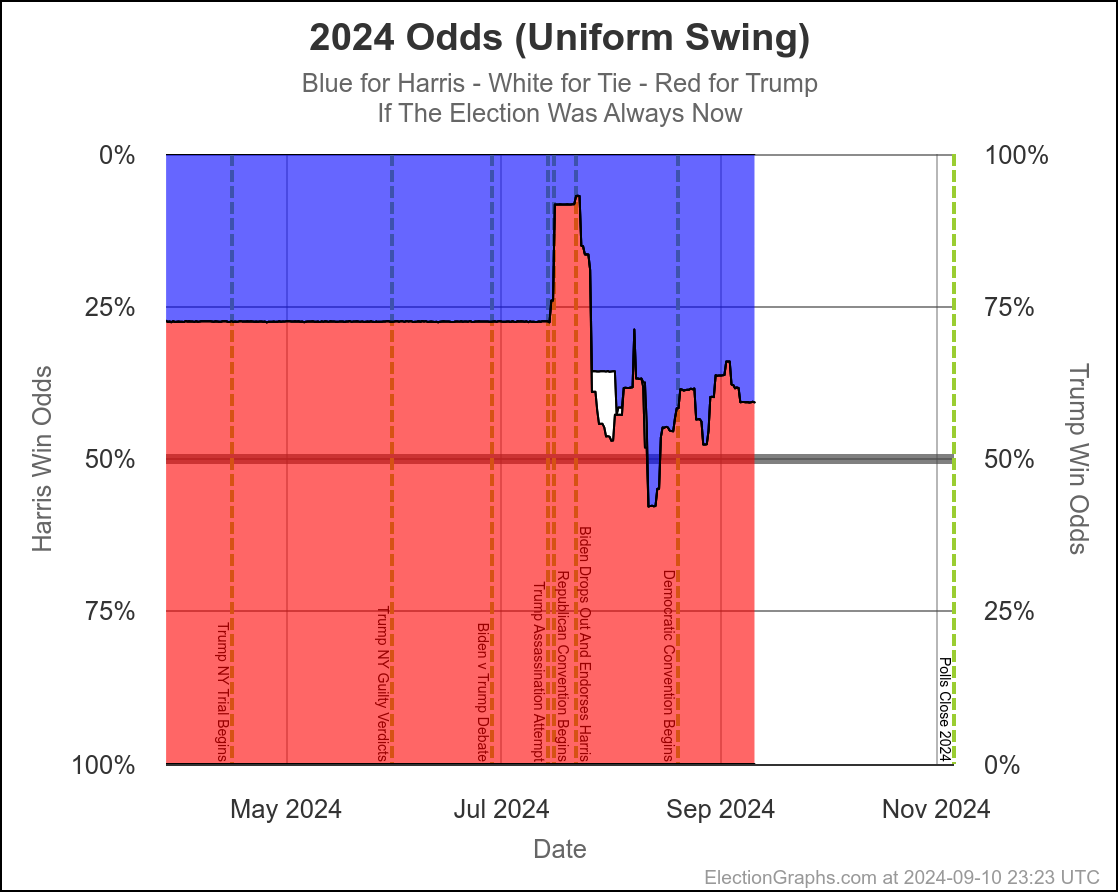
So, we're once again just saying the race is too close to call, but in a different way. Lets try to quantify that:


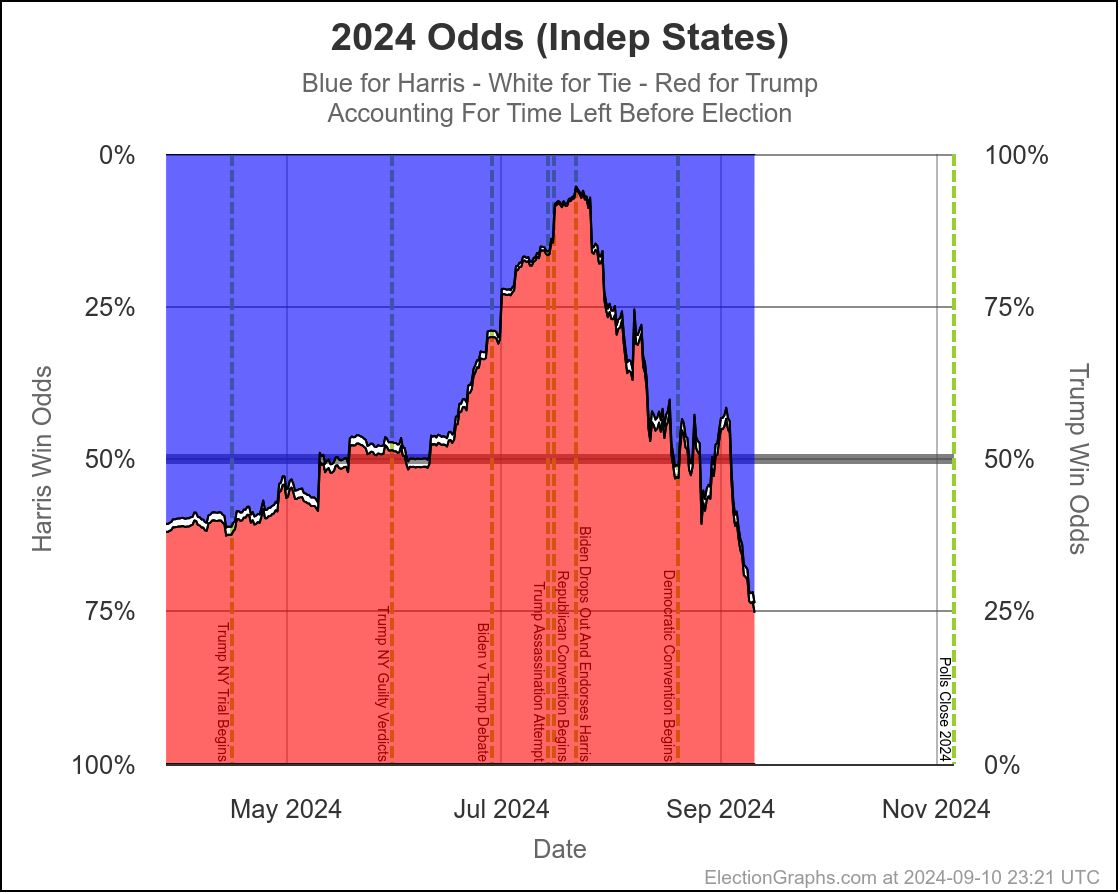
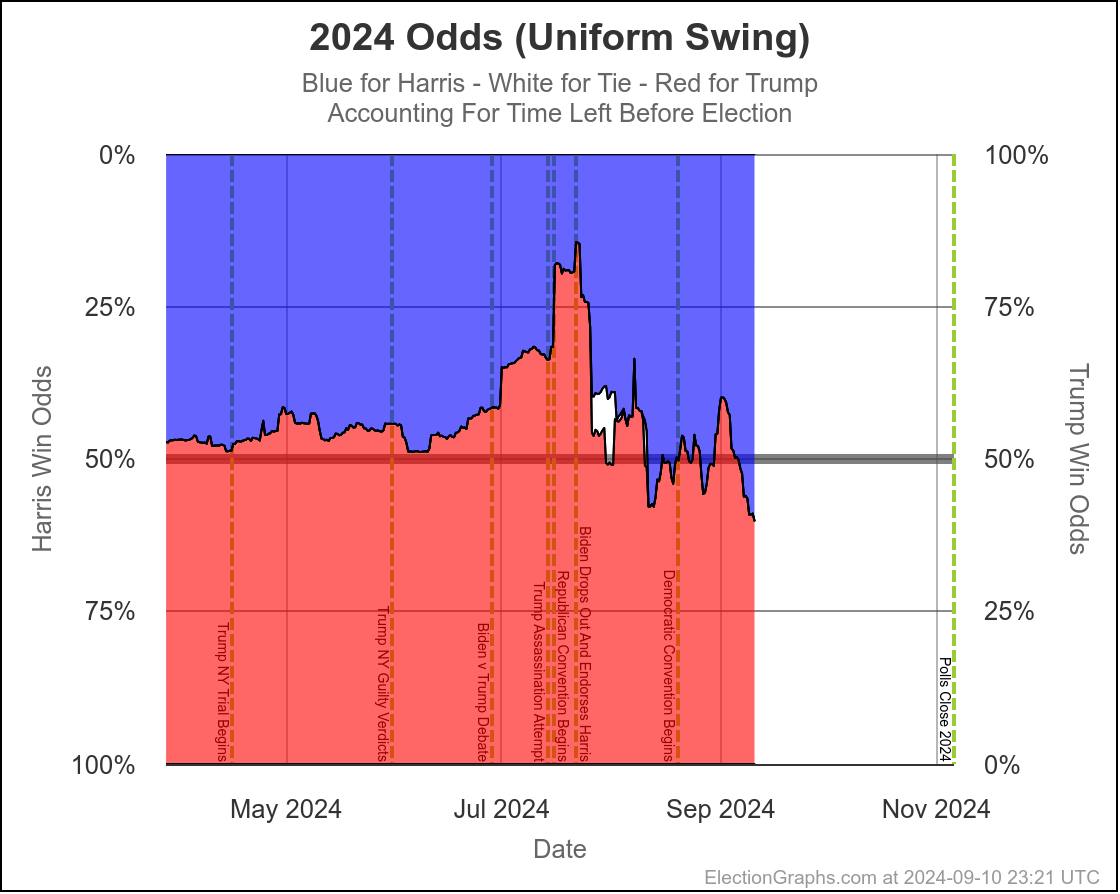
Right now looking at my two probabilistic models that account for the amount of time left before the election (one that assumes the polling errors in the states will be independent, and one that assumes the polling error will be the same everywhere) you get Harris's chance of winning ranging from 53.6% (uniform swing) to 68.8% (independent states).
I don't know where within this range reality is, but my gut is that it is closer to uniform swing simply because the same big pollsters are polling all the close states, and thus any methodological issues they have will likely be similar across all those states.
So with this, Harris is favored a little bit at the moment, but not a lot. Even taking the high end of this range, 70/30 odds give a non-trivial chance for Trump to win.
In 2016 this site did not have probabilistic models yet, but the average of all the sites I could find that gave election odds averaged out to a 14% chance of a Trump win, and Trump won. We're looking at odds for Trump that are more than double his chances in 2016.
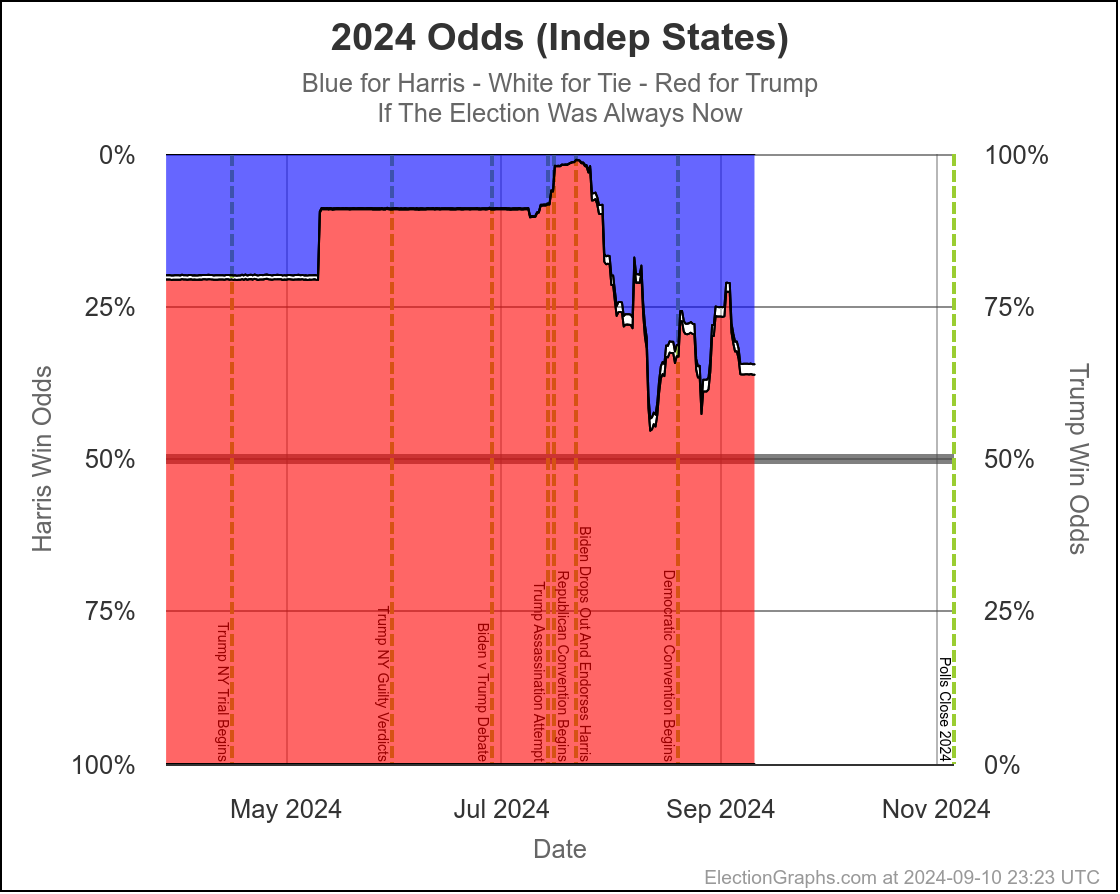
But looking at the "if the election was today" numbers gives an important additional caveat to that:


If we had the exact same polling on Election Day as we do today, Harris's range of chances drops to 39.4% to 41.9%.
So rather than being too close to call with a Harris advantage, it would be too close to call with a Trump advantage.
This is quite simply because on average from 2008 to 2020, the polling error between the final Election Graphs averages and the actual election results underestimated the Republican by about 1.3% in the close states. And right now Harris's tipping point lead is only 0.5%.
I give her better odds given 42 days left until the election essentially because there is still plenty of time to improve those numbers.
(More precisely, on average from 2008 to 2020, the Democrat being ahead by this much 6 weeks out from the election was a bit more correlated with an eventual victory than having a lead like this on Election Day is.)
The detailed math is more complicated of course, but given the history of polling errors from 2008 to 2020 that I've used to build the Election Graphs probabilistic models, to have a better than 50/50 chance of winning in my models when we get to Election Day, Harris will need to be ahead on the tipping point metric by more than 1.3% when we get there.
If either the Democratic Convention or the Harris vs Trump debate had any impact, it was small and short lived. Any ups and downs in August and September may in fact just be based on which pollsters were in the field in any given week rather than actual changes in public opinion.
If you smooth things out, the race has actually been pretty static since Harris's initial surge.
Right now things are a tossup with a slight Harris edge.
If Harris wants to keep it that way though, she needs to improve her poll numbers a bit more in the next six weeks.
If she wants to actually be more confident of a win, she has to improve them quite a bit, not just a little bit.
If she slips any, or even just holds steady, when we get to Election Day it will be a toss up with Trump slightly favored.
So… bottom line, we're still in a "too close to call" situation, and absent something big happening, it is quite likely we still will be in six weeks.
Of course, "something big" sometimes happens. Both 2016 and 2020 had points in the last 100 days where the tipping point moved in one direction or the other by more than 4% in just a week or two.
A 4% move in either direction would massively change what the race looks like. A candidate leading by 4% in the tipping point would be strongly favored. An upset wouldn't be impossible, but would be much more of a surprise.
Things SEEM more sticky this time around, but you never know when those "big events" may happen.
There are new polls almost every day at this point. Sometimes there are days with LOTS of new polls.
I try to get the new polls included in the site quickly whenever they come out. I've just booked time off from the day job for the last two weeks before the election just to keep up with the inevitable deluge of polls at the end.
So don't wait for these blog posts. Check out electiongraphs.com regularly in between posts too. And follow us on Mastodon.
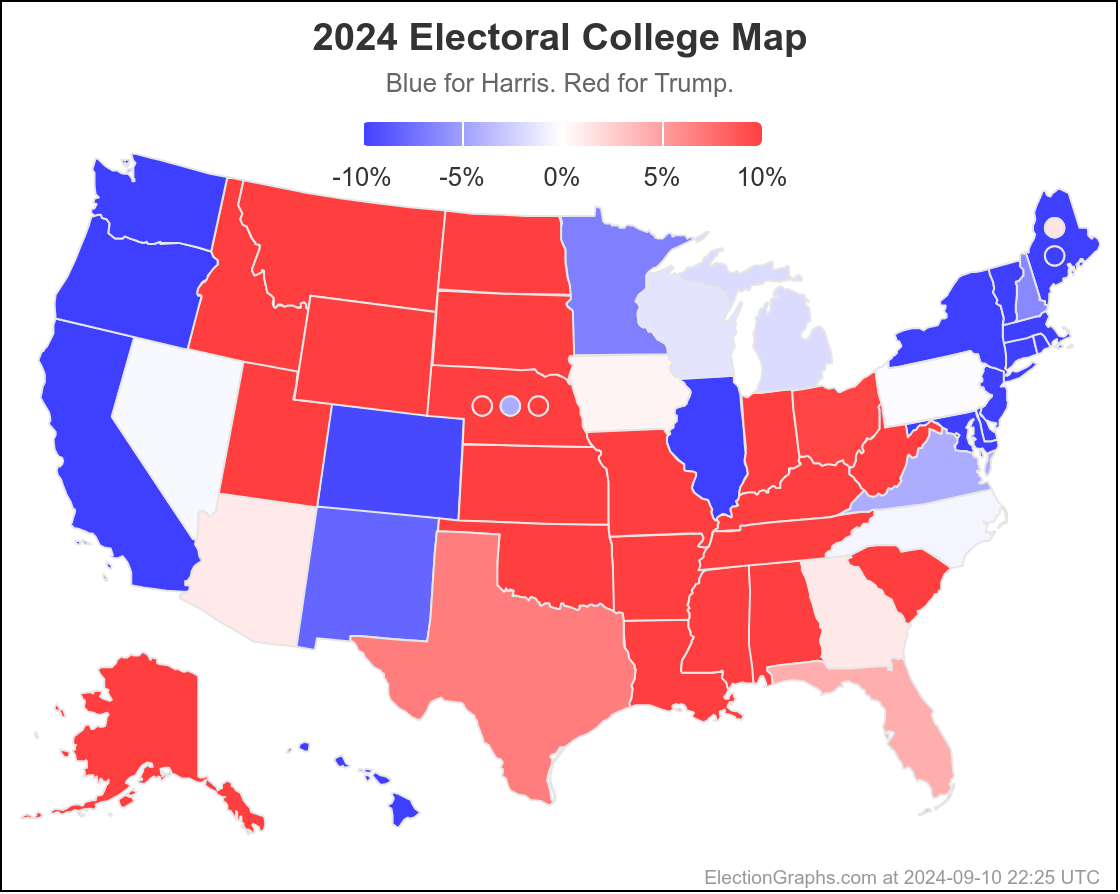
Lets close things out with the current map:

41.8 days until polls close in the first states on election night.
Stay tuned!