It has been 21 days since my last post, but it has been an eventful 21 days.
The last post was about a week after Biden dropped out. There had only been a small number of Harris vs Trump polls that reflected the reality of Harris actually being the nominee rather than just a hypothetical replacement.
At that point polls already showed Harris doing noticeably better against Trump than Biden had been doing.
Three weeks later polls have continued to move dramatically toward Harris.
In fact Harris has taken the lead in the electoral college if you just take the poll averages at face value.
If you look at the probabilistic views that use information about how far off Election Graphs averages were from actual election results from 2004 to 2020, Harris is now over 50% to win in one of my four models. Specifically she's ahead in the one of the four I think best represents reality.
All of the Election Graphs views now show a very close race. This is by no means a "Harris is definitely winning" scenario. But things have shifted very quickly from a "Trump is heavily favored, but it is still possible for Biden to catch up" situation a month ago, to a true toss up situation, and one where Harris has the momentum.
Now, let's get into some details:
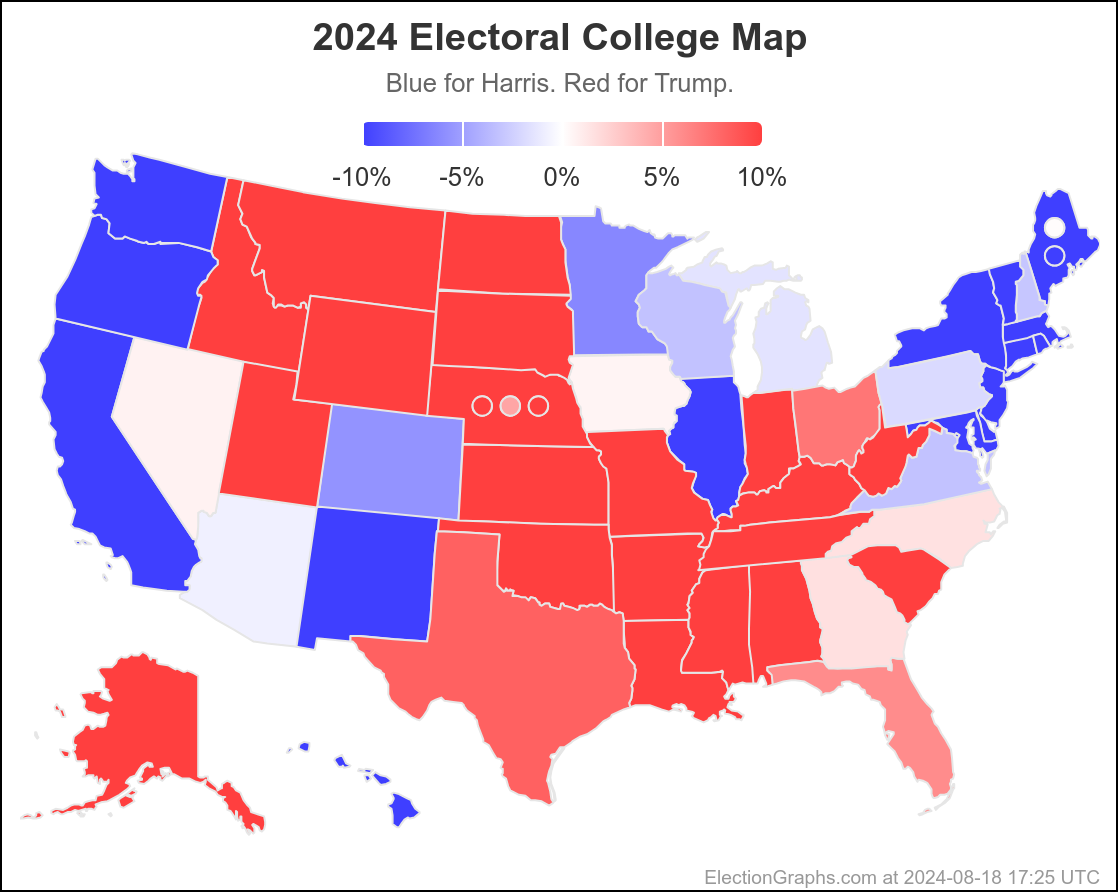
There's the new map to start with. Lots more blue than there was three weeks ago.
But let's hit some graphs.
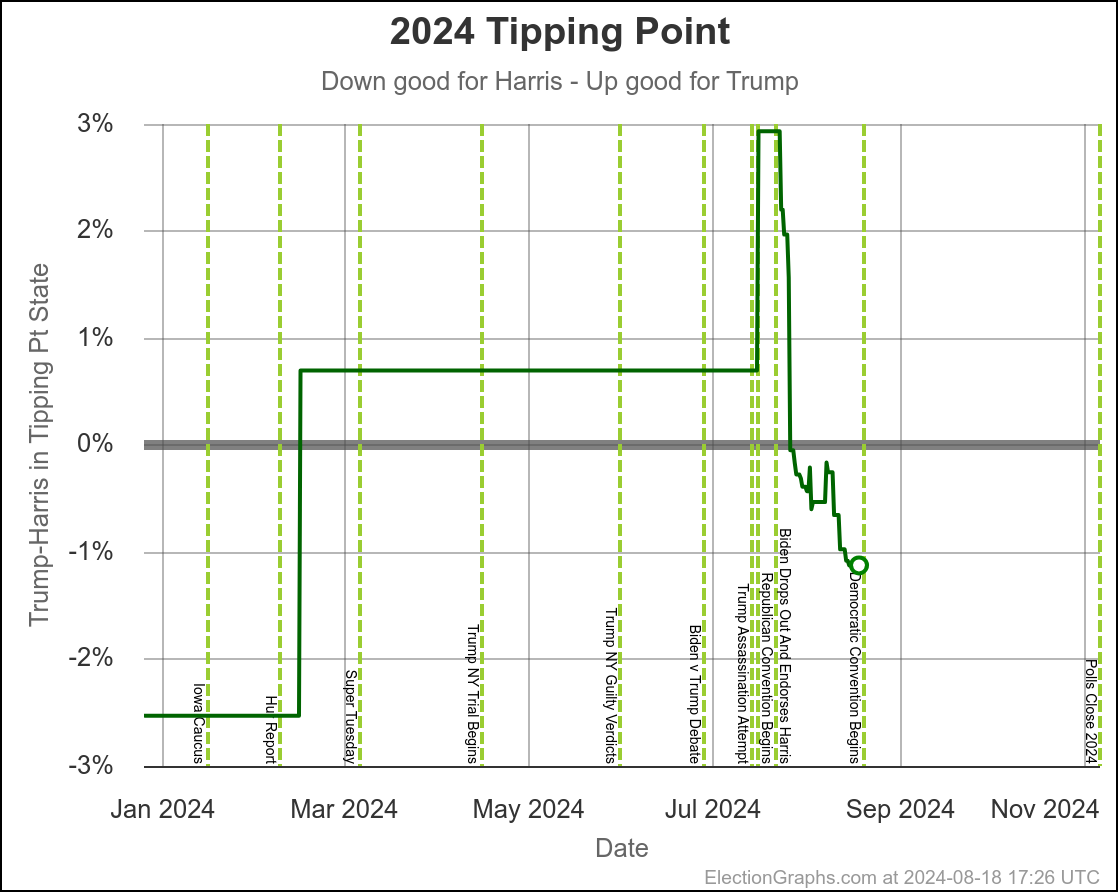
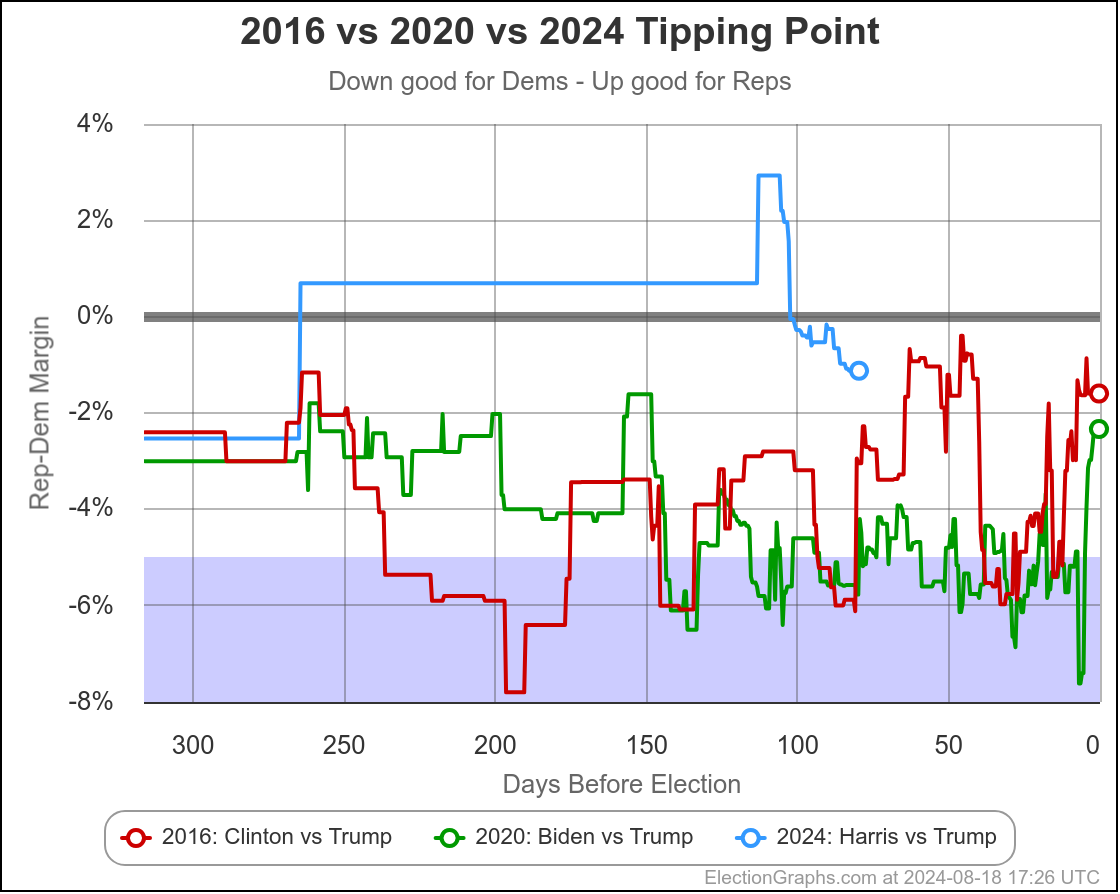
This is the tipping point, the margin in the state that would put the winning candidate over the top in the Electoral College. When Biden dropped out, he was behind by 5.0% to Trump in this metric. (That includes straggler Biden vs Trump polls that were released after he dropped out.)
Harris started behind by only 2.9%. It took longer for us to know it, because polls are released with a lag, but it now seems that within 4 days, Harris had already erased that 2.9% lead by Trump and the tipping point was now in her favor.
Since then the movement toward Harris has been slower, and there was a short time where the tipping point moved back toward Trump for a few days due to a few polls in Pennsylvania, but that quickly reversed and Harris has continued to strengthen, with the tipping point now being 1.1% (in between MI and AZ).
Let's look more specifically at the states.
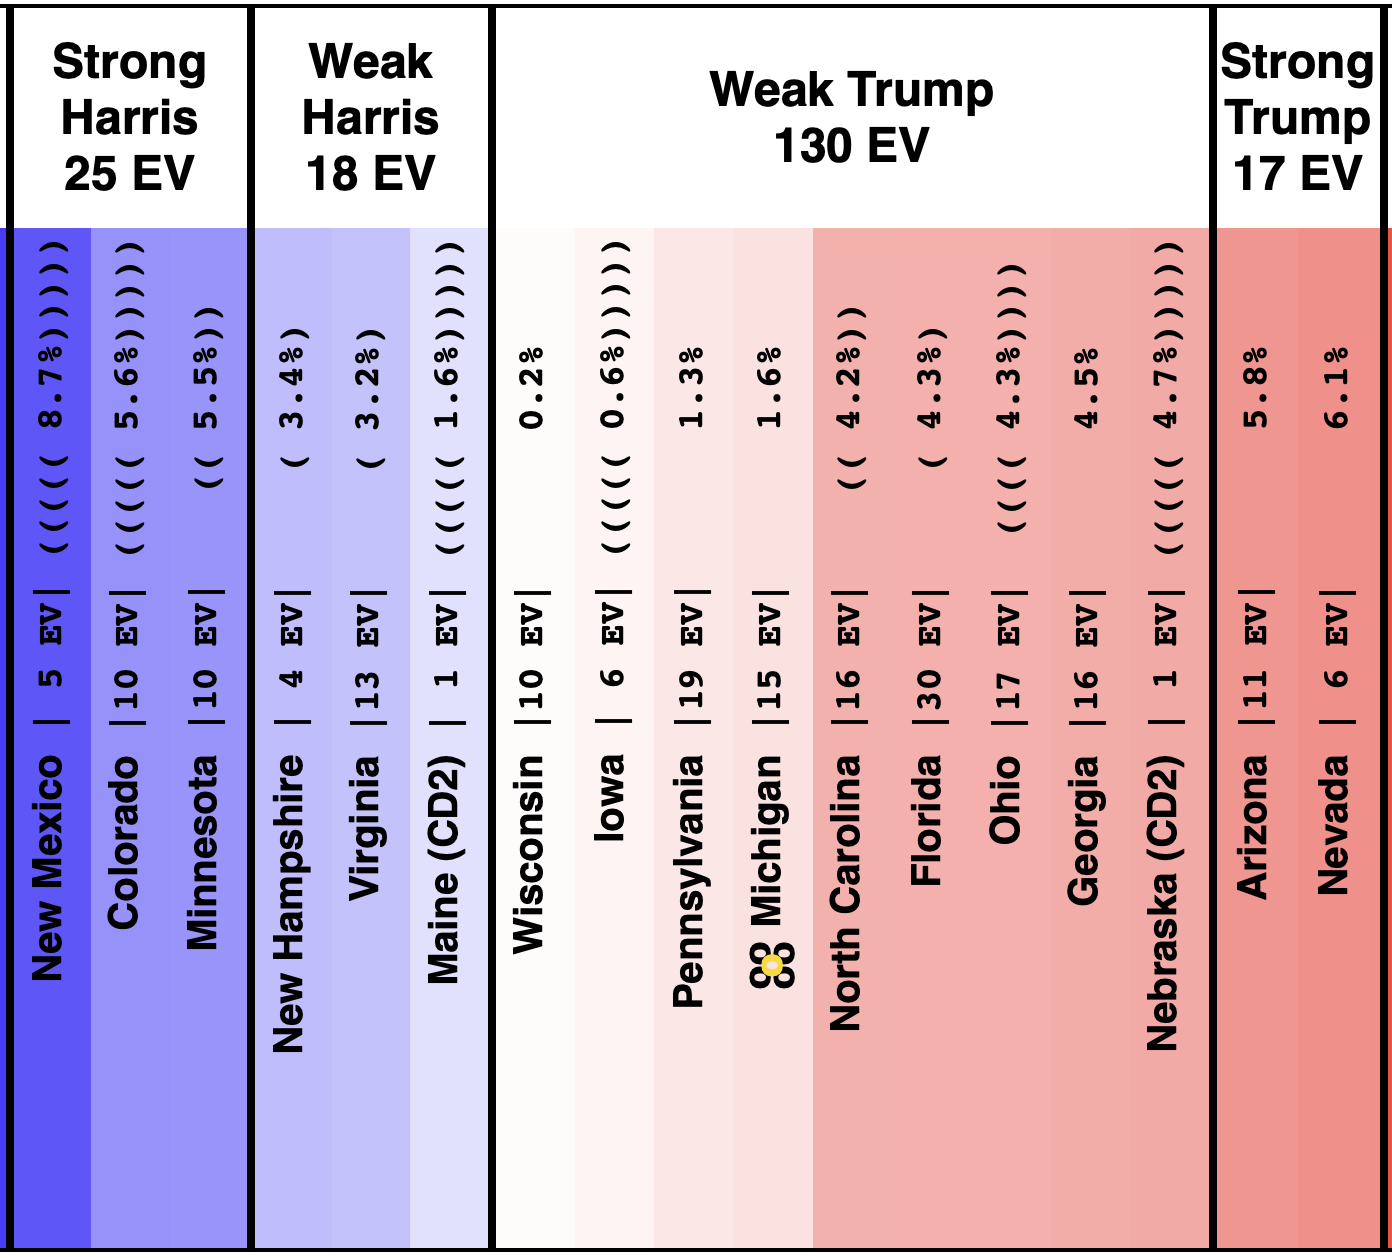
Here were the close states as of my post on 2024-07-28:
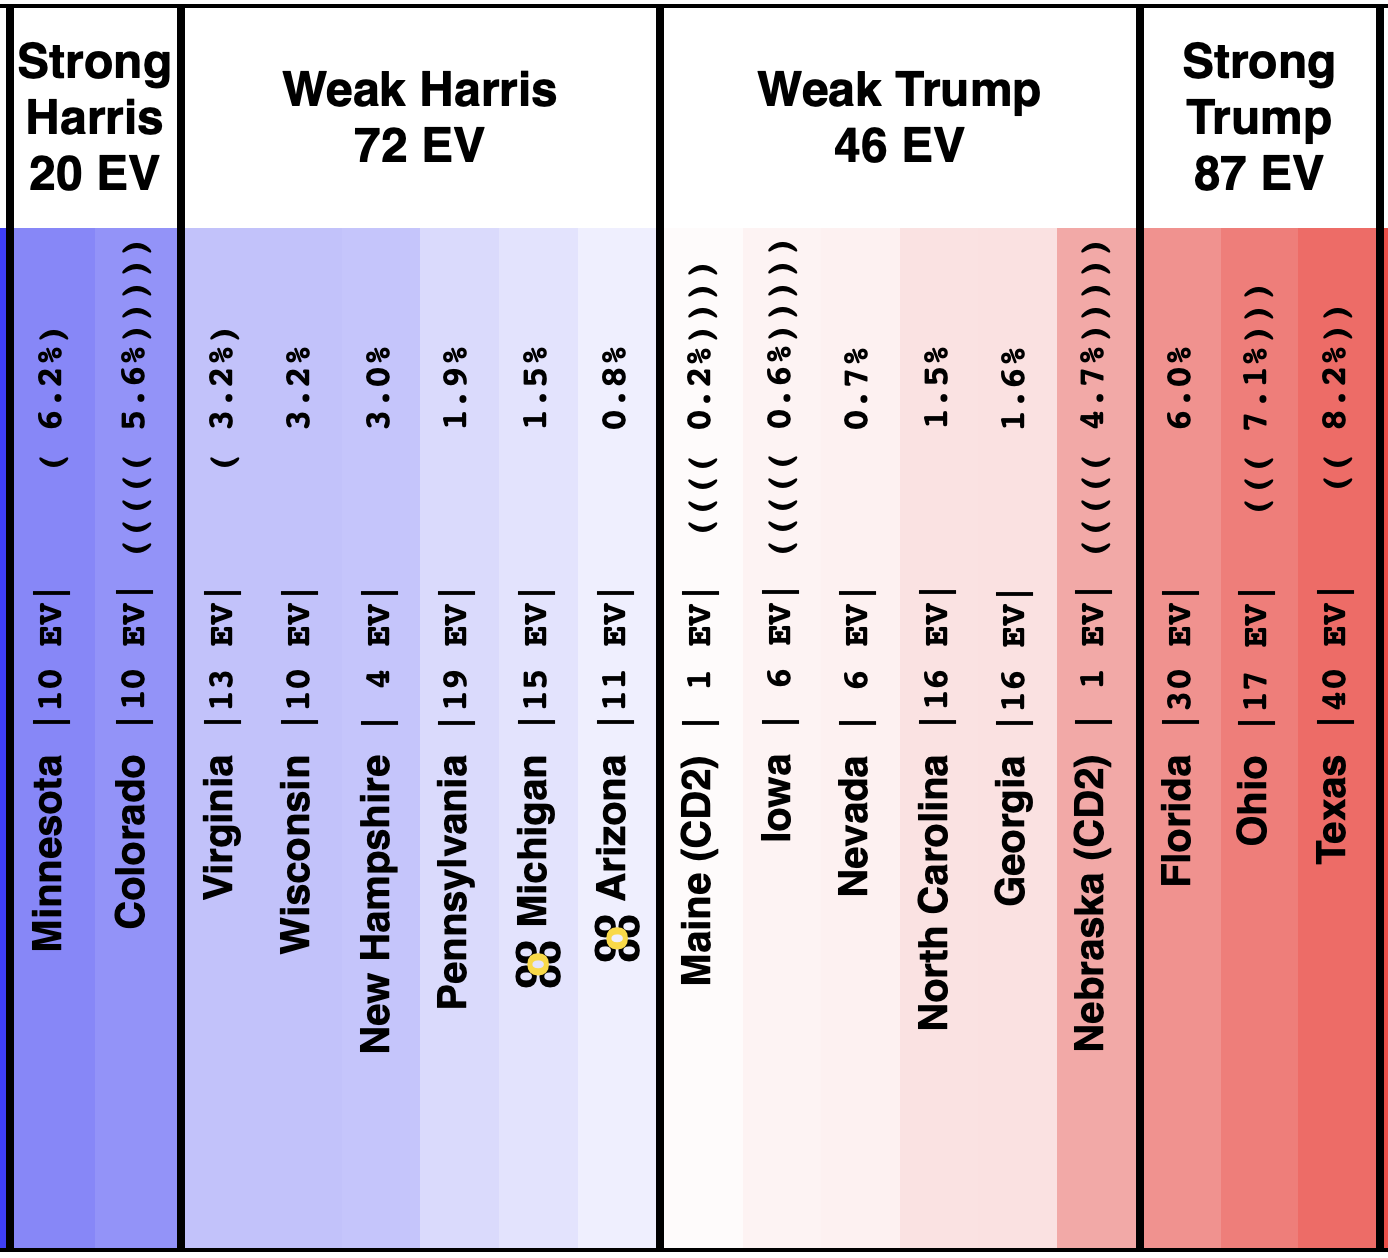
And here they are as of 2024-08-18:
There are still a bunch of states with one or more pair of parentheses, indicating there are still not five actual Harris vs Trump 2024 polls, and the poll average is augmented by previous election results, but we have good data in a lot more states than we did.
Here are the movements in the last three weeks:
Movement toward Trump:
- Ohio (17 EV): Trump by 4.3% -> Trump by 7.1% (Trump+2.8%)
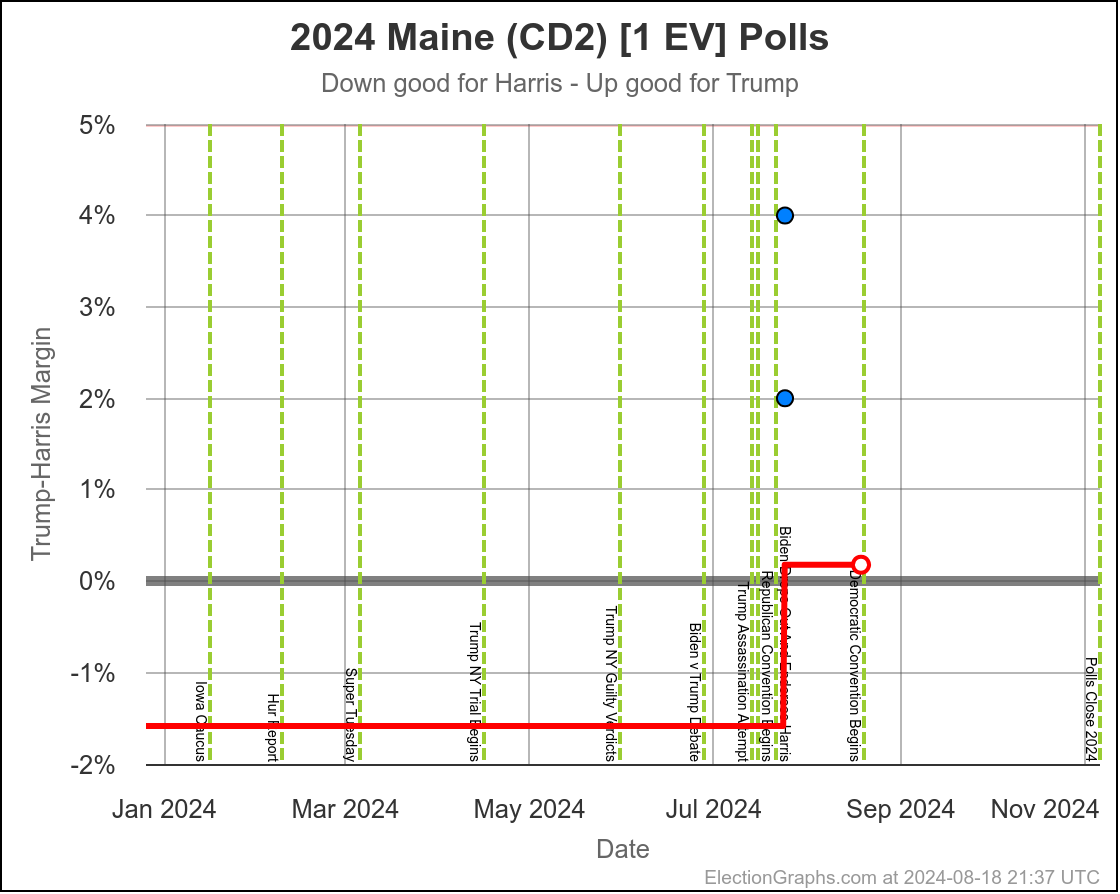
- Maine-CD2 (1 EV): Harris by 1.6% -> Trump by 0.2% (Trump+1.8%)
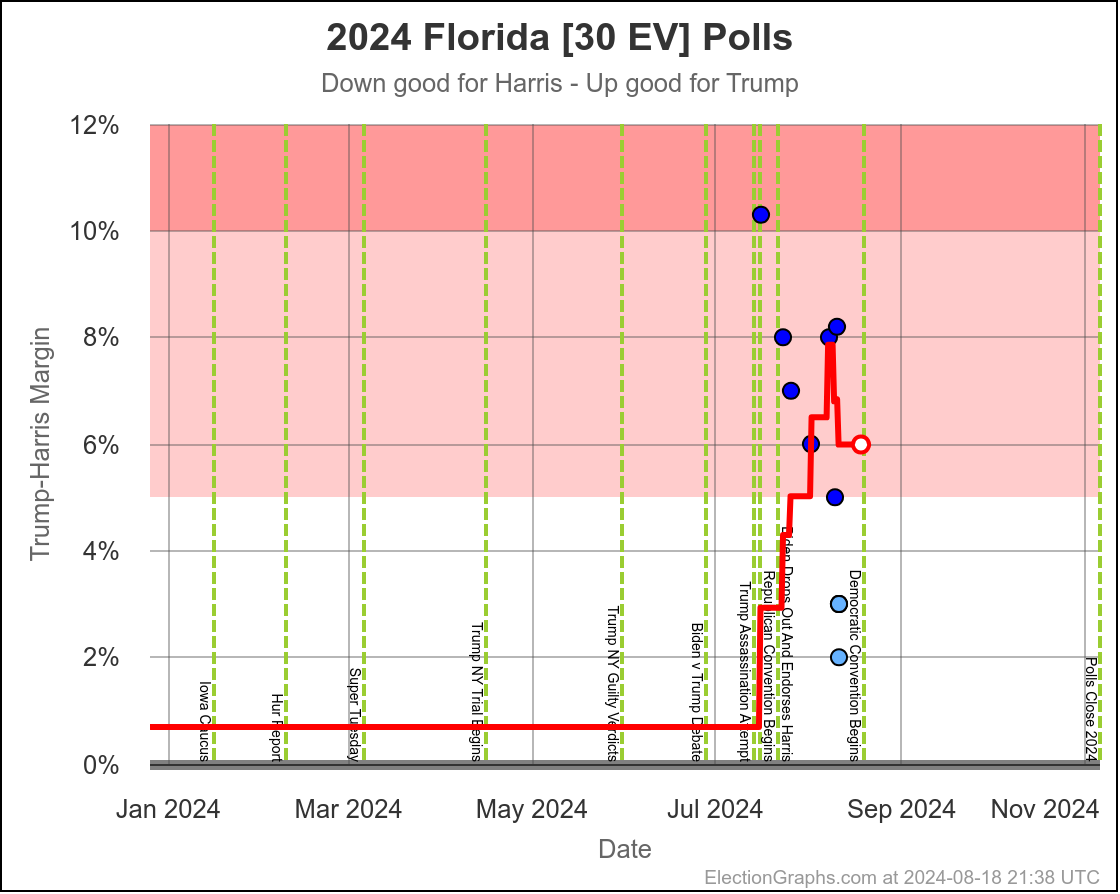
- Florida (30 EV): Trump by 4.3% -> Trump by 6.0% (Trump+1.7%)
- New Hampshire (4 EV): Harris by 3.4% -> Harris by 3.0% (Trump+0.4%)
No Movement:
- Nebraska-CD2 (1 EV): Trump by 4.7%
- Iowa (4 EV): Trump by 0.6%
- Virginia (13 EV): Harris by 3.2%
- Colorado (10 EV): Harris by 5.6%
Movement toward Harris:
- Minnesota (10 EV): Harris by 5.5% -> Harris by 6.2% (Harris+0.7%)
- New Mexico (5 EV): Harris by 8.7% -> Harris by 10.3% (Harris+1.6%)
- Texas (40 EV): Trump by 10.1% -> Trump by 8.2% (Harris+1.9%)
- North Carolina (16 EV): Trump by 4.2% -> Trump by 1.5% (Harris+2.7%)
- Georgia (16 EV): Trump by 4.5% -> Trump by 1.6% (Harris+2.9%)
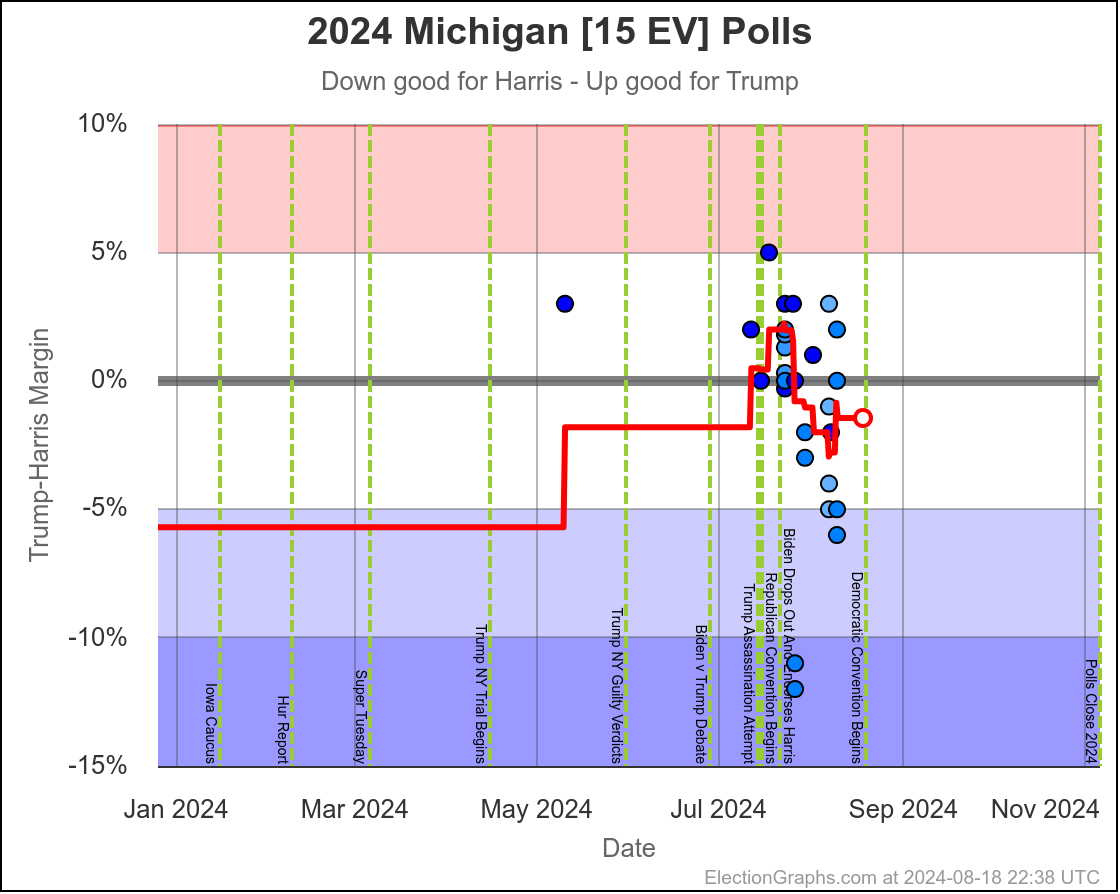
- Michigan (15 EV): Trump by 1.6% -> Harris by 1.5% (Harris+3.1%)
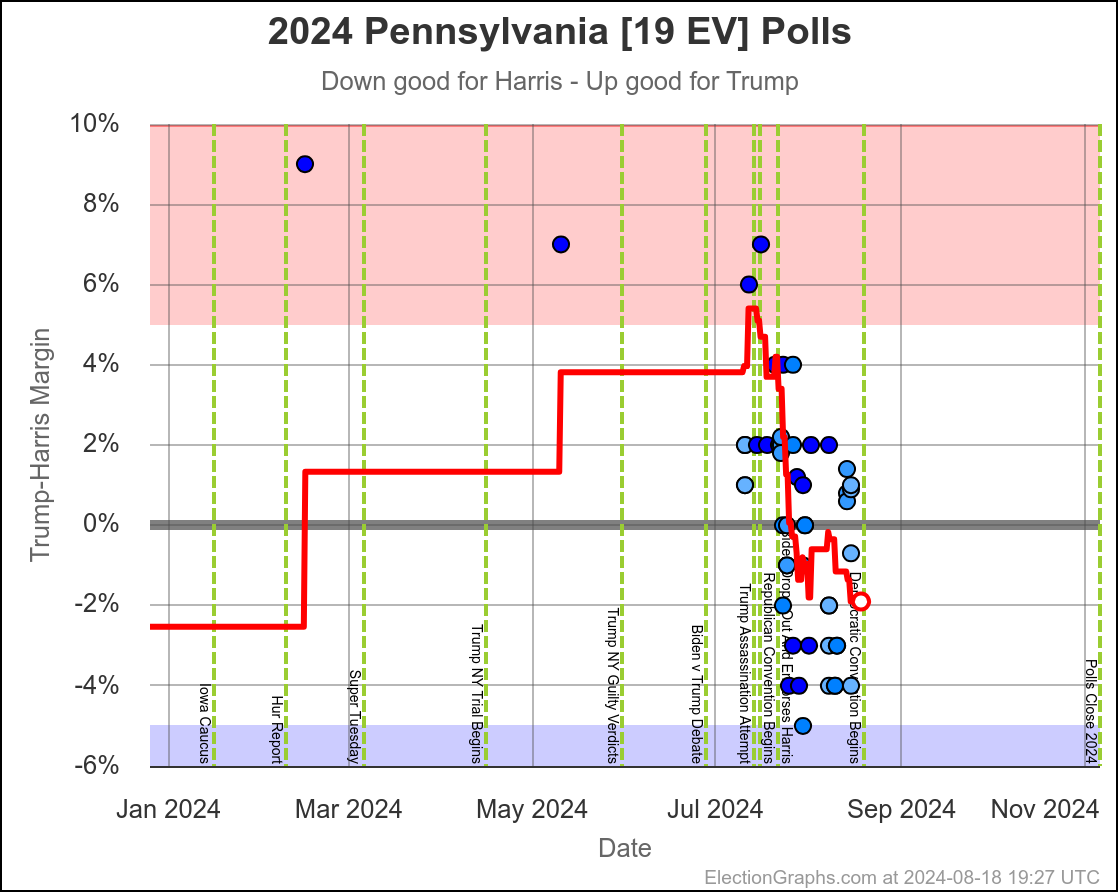
- Pennsylvania (19 EV): Trump by 1.3% -> Harris by 1.9% (Harris+3.2%)
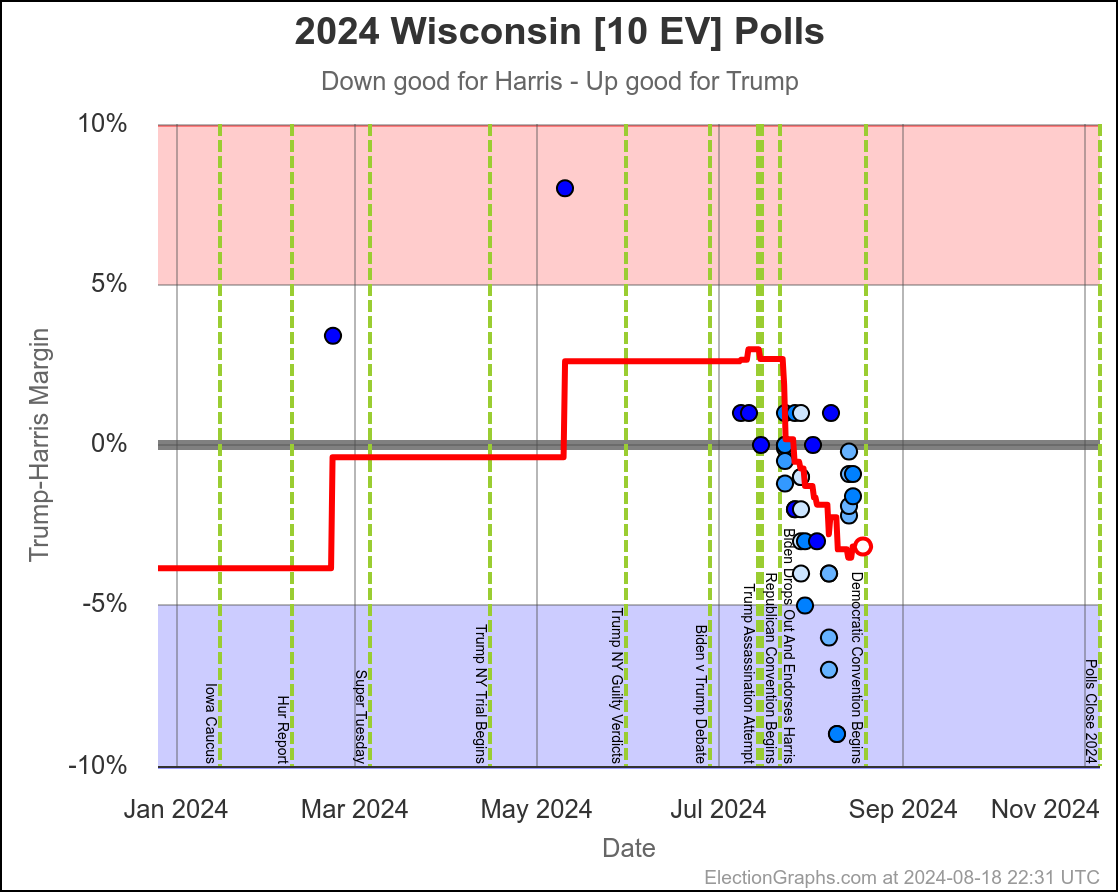
- Wisconsin (10 EV): Trump by 0.2% -> Harris by 3.2% (Harris+3.4%)
- Nevada (6 EV): Trump by 6.1% -> Trump by 0.7% (Harris+5.4%)
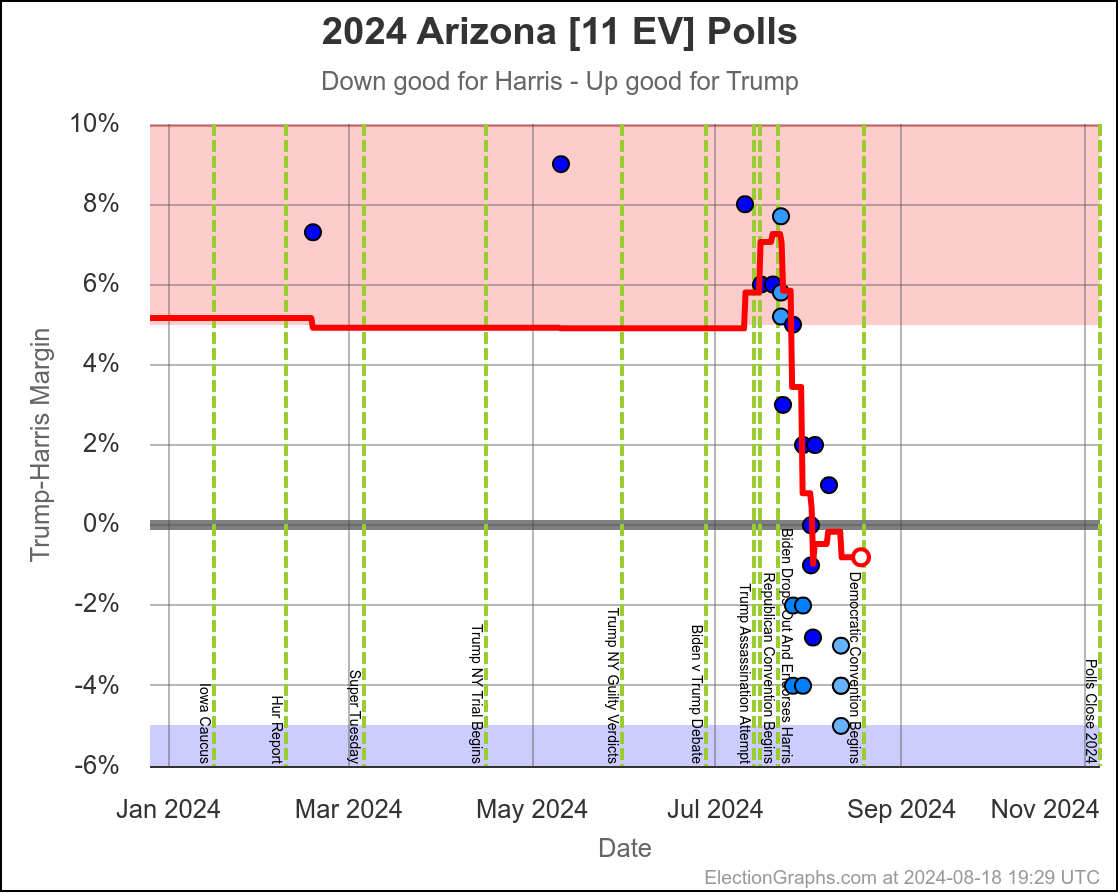
- Arizona (11 EV): Trump by 5.8% -> Harris by 0.8% (Harris+6.6%)
The four states with no movement are states where there have been no new polls since the last update. In some of the cases there are no Harris vs Trump polls at all, so these are just averages of elections from 2008 to 2020.
In others, there are a handful of Harris vs Trump polls, but they are all from before Biden dropped out. In either case, we really need new polling.
In the four cases where Trump increased, ALL of them were where actual Harris vs Trump polling was replacing old election results in the average, reflecting that these places are more Republican than they had been in 2008 and 2012 for instance.
So these movements are less about measuring something that really changed in the last 3 weeks, and more about just getting enough data to understand the current situation.
As the most dramatic example, let's look at Florida:
The red line for the polling average was moving toward Trump until very recently. But this is because the new polls were replacing old elections in the average that were very close, as well as a couple of really good Harris results in 2021 and 2022.
But if you look just at the new polls in July and August, you can see them clearly trending toward Harris. With the last couple of polls, the average is now moving that direction again too.
The average still doesn't show Harris as particularly competitive in Florida. EG gives her an 8.2% chance of winning the state given this average this long before the election.
But even here, there does seem to be a trend toward Harris, with the most recent polls indicating a close race.
This kind of thing was happening in all of the areas moving toward Trump, including the one that flipped from blue to red:
We just had our first 2024 Harris vs Trump poll in Maine's 2nd Congressional District.
Before that our average had Harris up by 1.6%. Democrats had won ME-CD2 in 2004, 2008, and 2012. But Republicans won in 2016 and 2020. On average, these come out to a small Democratic lead. But the trend has been toward the Republicans.
So as a real 2024 poll replaces the 2004 results in the average, this moves toward Trump, and flips to the red side of the line. The new poll's two results average to Trump up by only 3% though, which is a lot less than Trump's 10.3% and 7.4% wins in 2016 and 2020 respectively.
Let's quickly look at all other jurisdictions crossing the center line:
All of these mirror the initial tipping point chart I showed, with an initial rapid movement toward Harris right after Biden dropped out, which has slowed down since then but has not yet stopped.
So yes. Harris has made lots of progress in a few weeks.
Now let's talk about how close things still are, looking at this in a bunch of different ways.
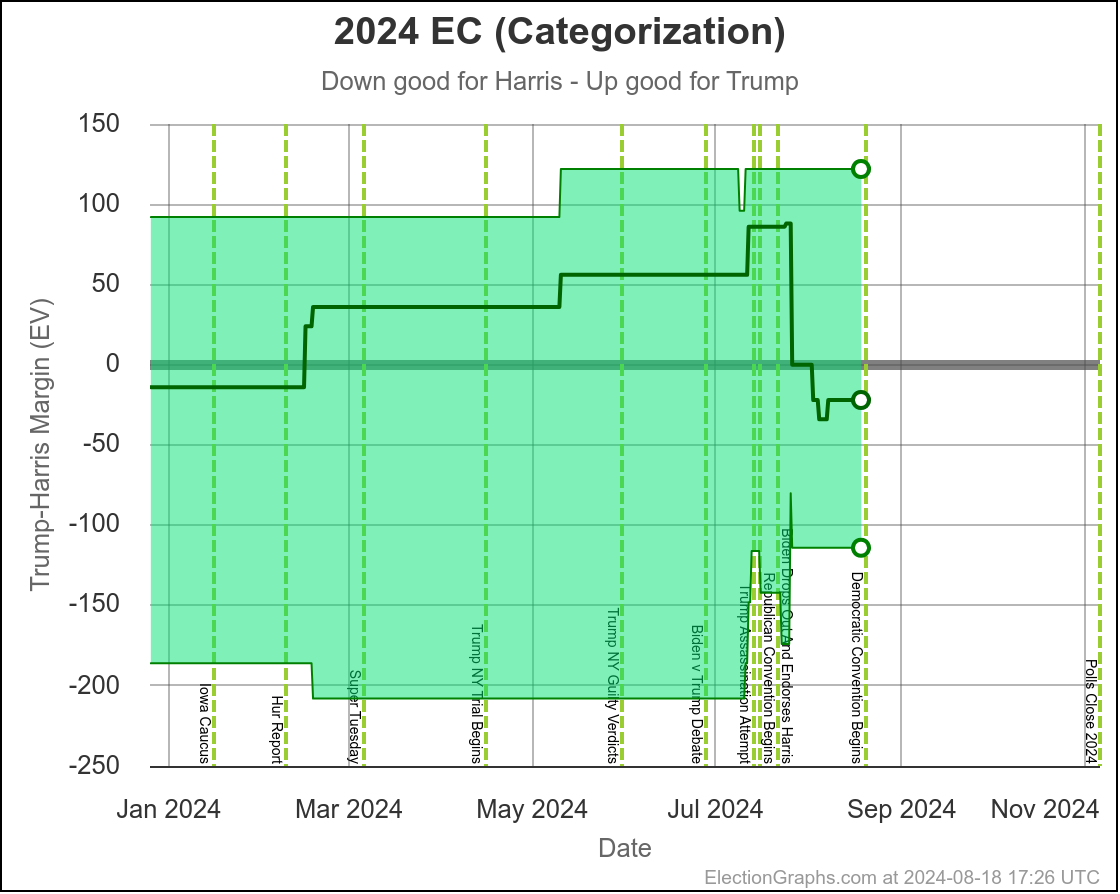
First up, the categorization view. This just looks at all the states where the margin is less than 5%, and shows the range of results that can happen if all those states end up going to one side or another.
In the end, 5% is a pretty small margin. With the right poll errors, or the right news events that change the race, a 5% margin can disappear pretty quickly.
Considering all of these electoral votes as "could go either way" you can get results from Trump by 122 EV all the way to Harris by 114 EV. Quite simply, even though the middle line, where each candidate wins all the states where they lead the polls, gives you a 22 EV Harris win, either candidate can still easily win.
Of course, "every state with a margin under 5% could go either way" is an oversimplification. Let's look at how this comes out in my probabilistic views that take into account how long there is before the election.
(I'm only going to look at the two that take into account the amount of time left before the election, ignoring the "if the election was now" ones.)
Basically, these look at the Election Graphs averages in 2008 to 2020 at the same amount of time before the election at various margins, then compares to how often those averages ended up picking the winner, and uses that information to run simulations of the electoral college given the current polling.
Since on average from 2008 to 2020, the Election Graphs poll averages have underestimated the Republican in close states, this effectively means that when states are tied, we still give the Republican a small advantage. For our probabilities to be showing a 50/50 situation, the Democrat has to be ahead by a little bit.
Which is where we are today.
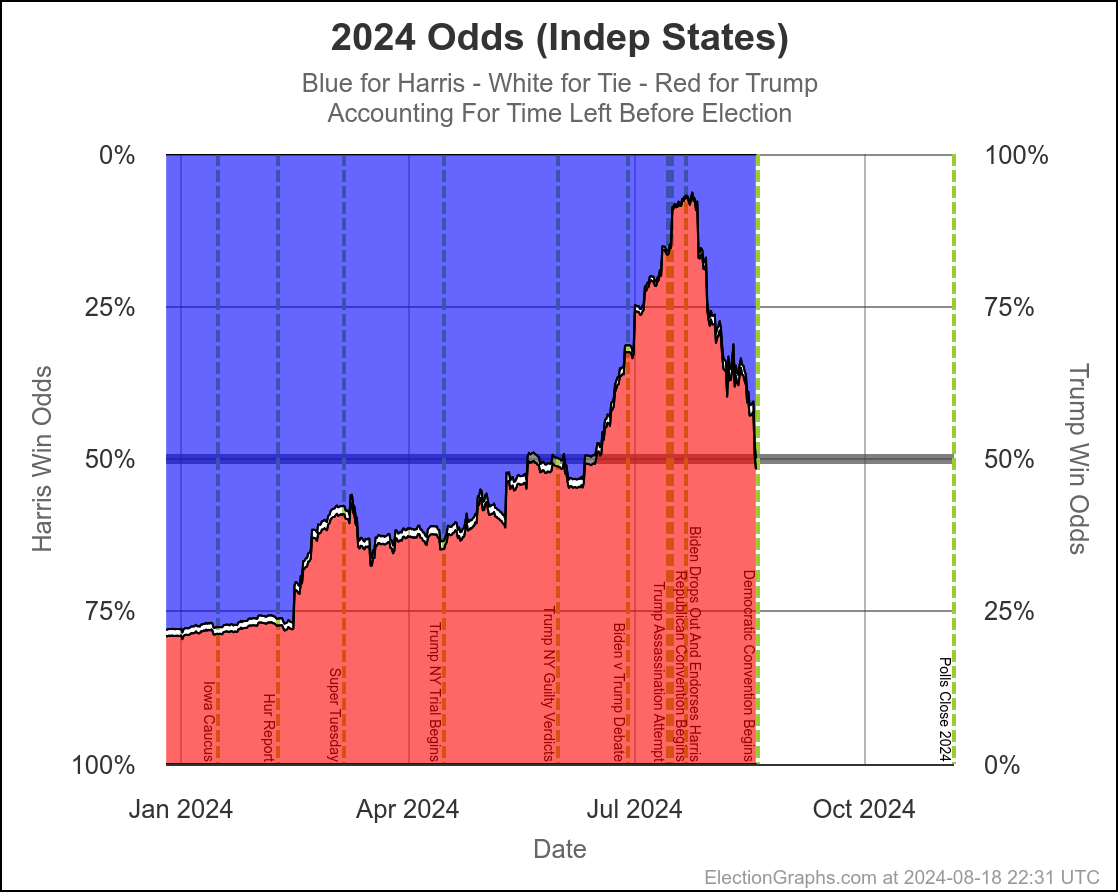
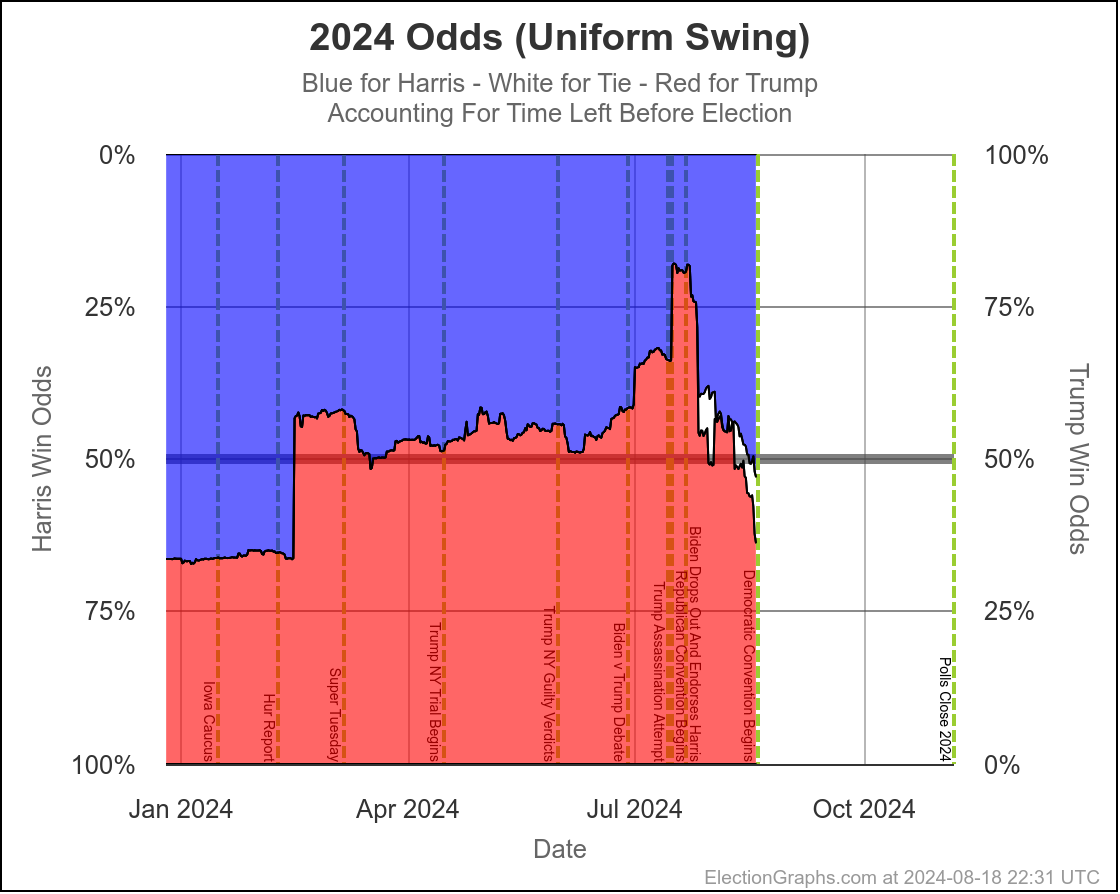
One of these simulations assumes the eventual poll errors in each state are completely independent, the other assumes the poll error is uniform across all states. Obviously the reality is somewhere in between. My guess is closer to the uniform swing side of these ranges, but let's look at the full range between these two models.
On the day Biden dropped out, Harris's chances were between 7.4% and 18.1%.
As of this post, this has increased to being between 49.8% and 52.9%.
Huge improvement from where things were before… to now being essentially a coin toss.
But wait, what is that white bit?
Well, that is the chances for a 269-269 tie, which would throw the election into the House of Representatives, where the NEW House would decide the President, but voting by state delegations, which even if Democrats retake the House would probably still be Republican dominated. So ties would most likely end up going to Trump. But only after a lot of additional drama.
Right now the states are lined up such that if Harris wins every state she leads EXCEPT Arizona (where she lead by only 0.8% at the moment) then you end up with that 269-269 tie.
Right now, Election Graphs gives odds for that between 1.8% and 10.8%. Still an unlikely scenario, but a pretty big chance for an outcome that would be chaotic at best.
Contingent elections for President have only happened twice in US history. That would be the 1800 and 1824 elections. (For 1836 there was a contingent election for Vice President only.) If this were to happen, it would be the first time in 200 years.
These odds would essentially go away if either Maine's 2nd or Nebraska's 2nd end up on the blue side of the line. We discussed ME-CD2 above. There have been zero Harris vs Trump polls for NE-CD2 yet. It went Republican in 2004, 2012, and 2016. But the Democrat won in 2008 and 2020. On average over the last 5 cycles, it is R+4.7%. But in 2020 it was D+6.5%.
We really need more polls in ME-CD2 and NE-CD2. This is the kind of close year where they could be the difference between having a clear winner, and having a 269-269 tie that throws the election into the House.
Back to the tipping point for one last view on the "lots of movement toward Harris, but Democrats should not be feeling confident yet" theme:
Right now, for the first time since Biden dropped out, Harris is doing better than… where Clinton was when she had worst polling she ever had.
Just barely.
And of course we all know Clinton ended up losing.
Harris is still running behind where Clinton usually was in 2016, and even further behind where Biden usually was in 2020.
This may still change. The DNC is about to start. We have Trump's sentencing for the NY case on the calendar soon after that. And debates coming up that may end up favoring Harris. Or the poll errors could underestimate the Democrat this year, after a couple of cycles of underestimating the Republican.
So Harris has plenty of opportunity to pull further ahead.
But things could go the other way too.
Trump's campaign may eventually figure out ways to effectively attack Harris. They may get their stride back after, as JD Vance said, being "sucker punched" by the shift from Biden to Harris. Or there may be news events that reflect badly on the Biden/Harris administration. Or Harris may make some mistakes that cost her, or be hit by some currently unknown October surprise scandal.
You never know.
We really are in coin toss territory right now.
Every day is going to matter.
So pay attention.
78.9 days until the first polls close on election night 2024.

