It has been too long since my last update. Oops.
Given that, I'll start with a reminder that while I only do these blog posts occasionally, the 2020 pages on Election Graphs are updated nearly every day as new polls come in. So you can always see the current status there for yourself.
In any case, since the last update on July 1st, there have been new state polls in Arizona (x9), Florida (x7), Michigan (x7), North Carolina (x6), Pennsylvania (x7), Wisconsin (x4), Colorado, Montana (x4), Texas (x7), Maine, Alaska (x2), Alabama, Iowa (x2), Georgia (x4), Missouri, Nebraska CD2, Kentucky (x4), South Carolina, Ohio, and Minnesota.
Yeah. Like I said. Too long since the last update.
Last time around, Trump was collapsing. Over three weeks later, where are we now?
As usual, let's start with the summary table of changes, then get into the graphs:
| Model | Metric | 1 Jul | 24 Jul | 𝚫 |
| Categories | Trump Best Expected Biden Best |
Biden +56 Biden +162 Biden +288 |
Biden +36 Biden +168 Biden +288 |
Trump +20 Biden +6 FLAT |
| Tipping Point | Biden +7.3 | Biden +6.5% | Trump +0.8% | |
| Probabilities | Trump 2σ Median Biden 2σ |
Biden +82 Biden +158 Biden +262 |
Biden +80 Biden +168 Biden +272 |
Trump +2 Biden +10 Biden +10 |
| Trump Win Tie Biden Win |
0.0% 0.0% 100.0% |
0.0% 0.0% 100.0% |
FLAT FLAT FLAT |
So compared to 23 days ago, we've got a mixed bag. Some metrics move toward Trump, some move toward Biden.
If I had to characterize the whole thing at once, I'd say Biden has improved his "right now" position a bit, but it is slightly more precarious than it was, and movement has slowed. Things seem to have plateaued the last couple of weeks.
At least in the probabilistic view. The categorization view is more volatile.
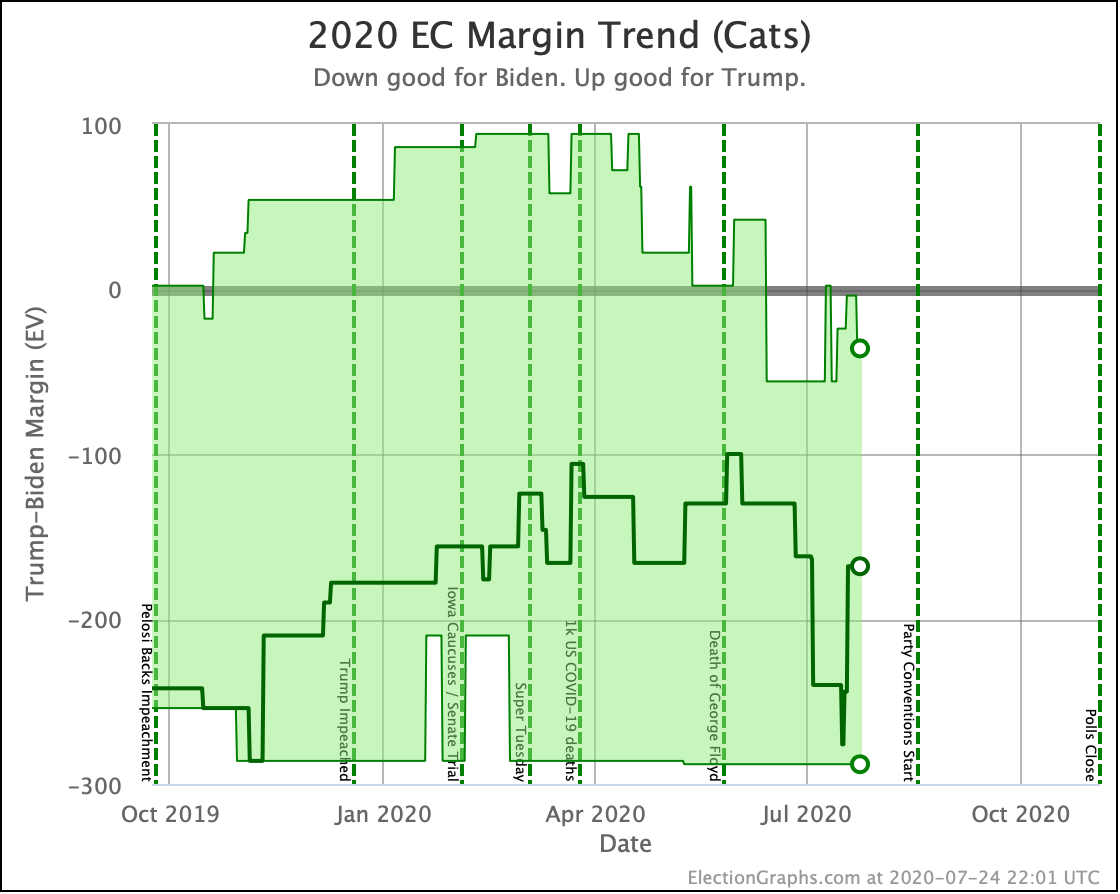
For instance, this update would have looked significantly different a week ago in the categorization view. Things looked much better for Biden a week ago, but they have swung back since then.
You can see that clearly on the chart:
That giant dip in the expected cases is caused by Georgia, Texas, and Ohio all flipping from just barely Trump, to just barely Biden, but then Georgia and Texas flipping back again.
In the categorization view, the difference between "just barely Biden" and "just barely Trump" is massive, as the state immediately changes sides. But in reality, either way, you have a tossup situation.
The probabilistic view accounts for that, and we'll look at that view shortly.
But first, let's look first at all the states that moved in or out of our "Weak Trump" and "Weak Biden" categories since the last post.
In order from biggest to smallest:
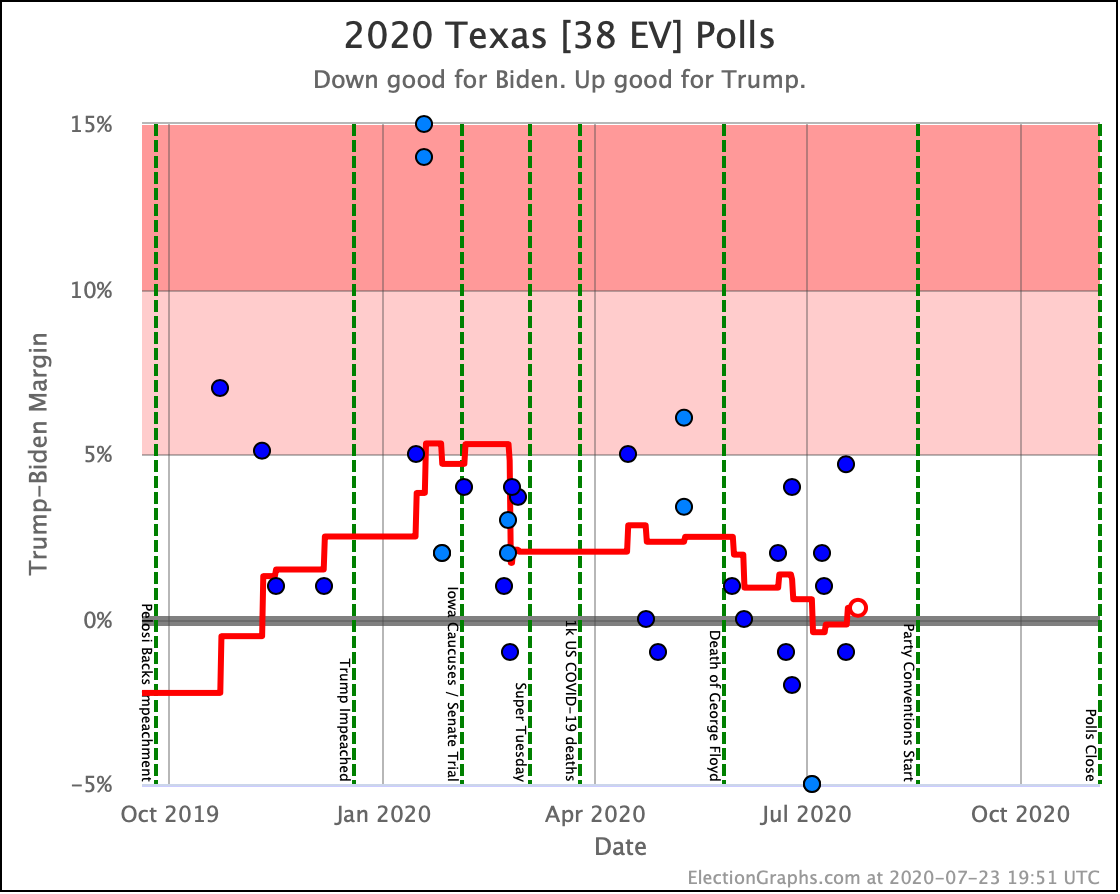
Texas is, of course, a huge electoral vote prize. The hope of a blue Texas completely changing the political map is once again tantalizing Democrats as it seems like it could be in reach. Our polling average briefly dipped into the blue before reverting to the red side of the centerline.
The bottom line here at the moment is just that Texas is very much a battleground state. As of this update, in the Election Graphs averages, Texas is the closest state of them all, with Trump leading by only 0.3%.
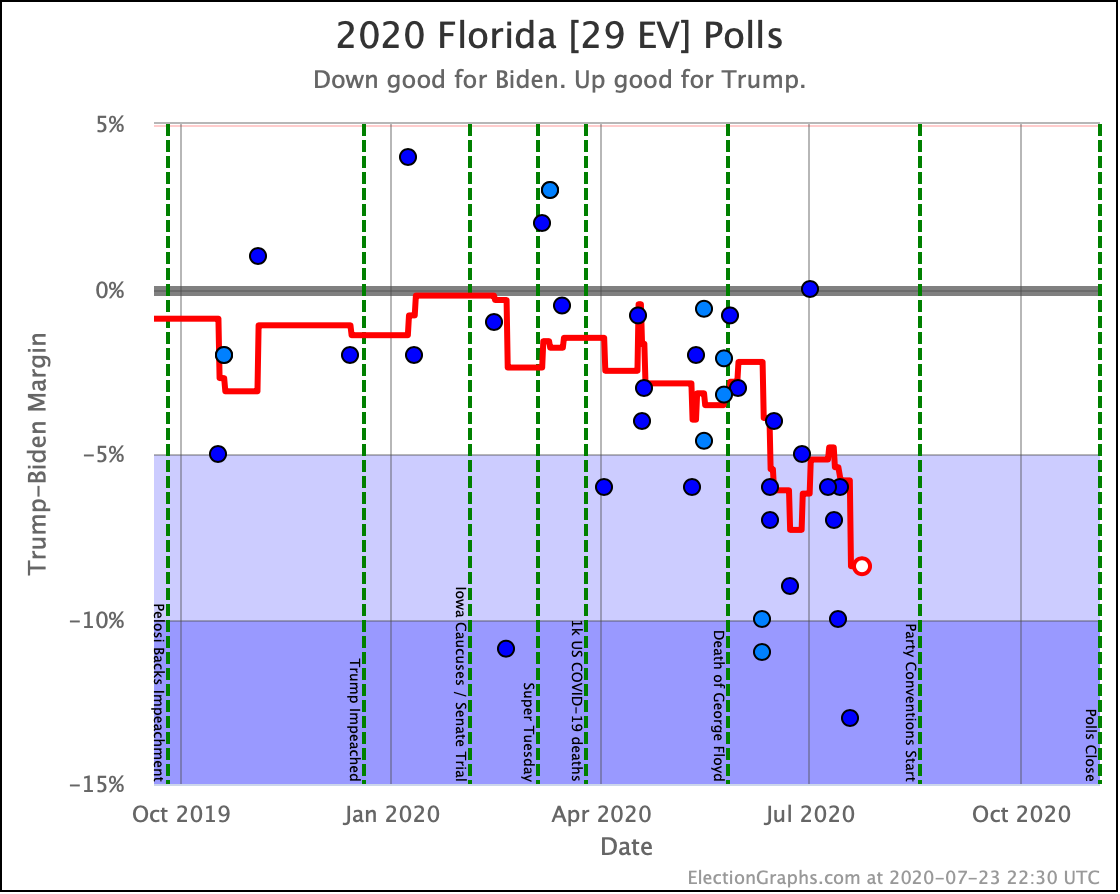
Florida, on the other hand, is not a close state at the moment, even though it famously often has been. For a very brief moment in the last few weeks, Biden's lead in Florida fell below 5%. But then subsequent polls drove Biden to his biggest lead in Florida yet, with an 8.4% margin over Trump.
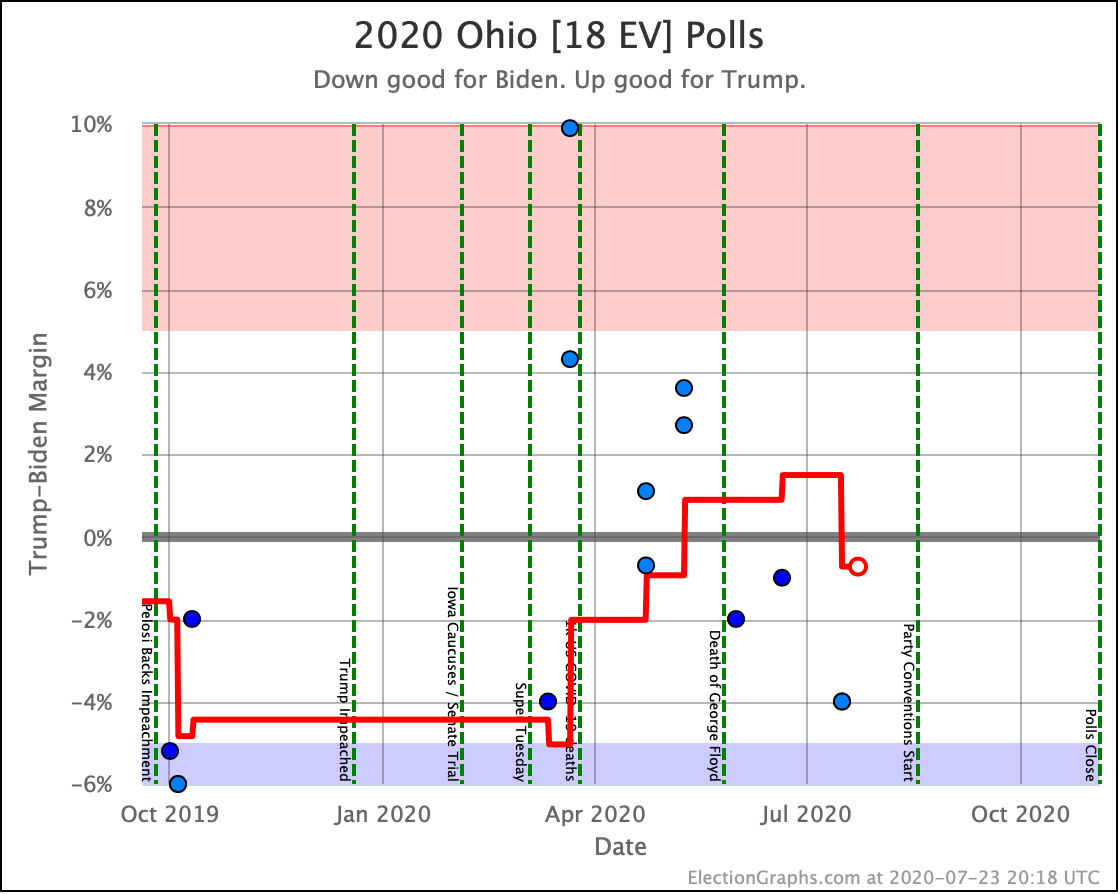
Ohio continues to be more sparsely polled than you would think it would be, so the average isn't as responsive to events. But with the latest poll, the average flips from the Trump side to the Biden side.
Either way, Ohio is a close state and very much in play.
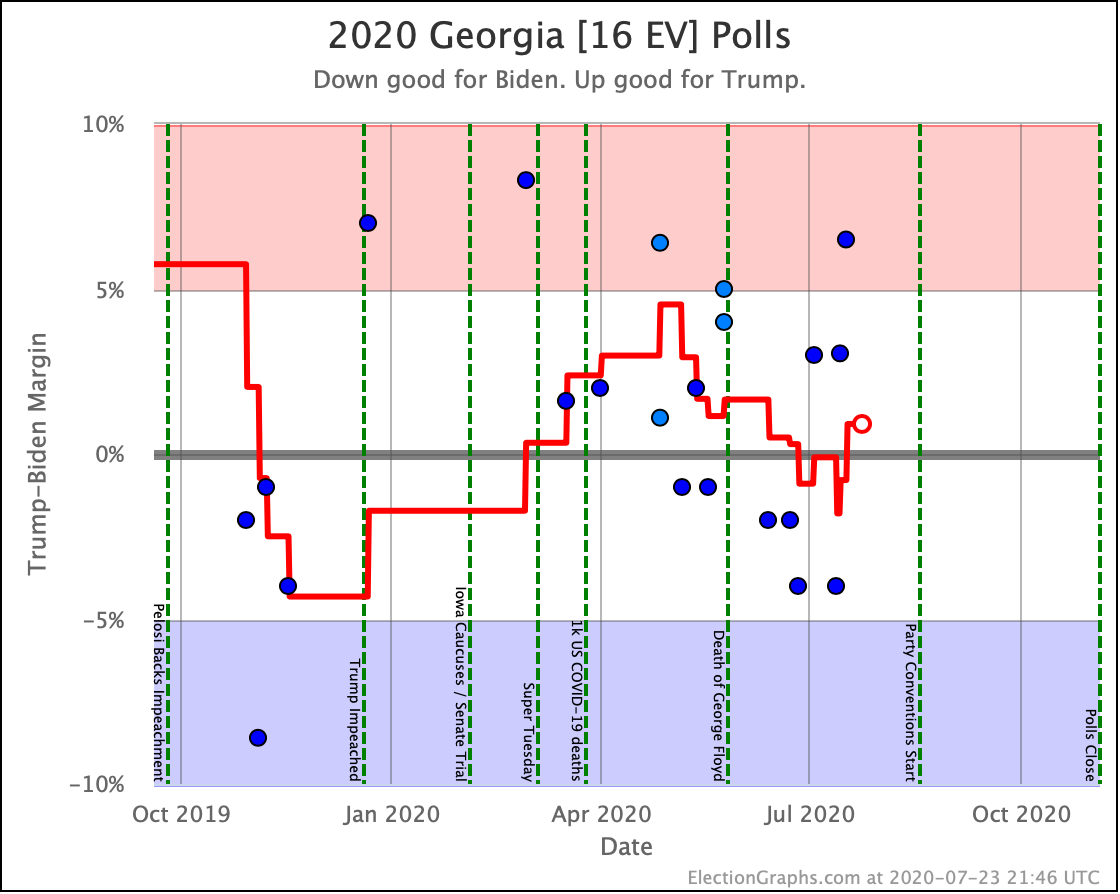
Georgia is another super close state. Since the last blog post, Georgia has flipped from Biden to Trump, back to Biden, then back to Trump yet again as new polls came in.
Just looking at the states we have flagged as "super close" so far… Texas, Ohio, and Georgia… tells you quite a lot about the race. If these three states are the close states, the Republican is in deep trouble.
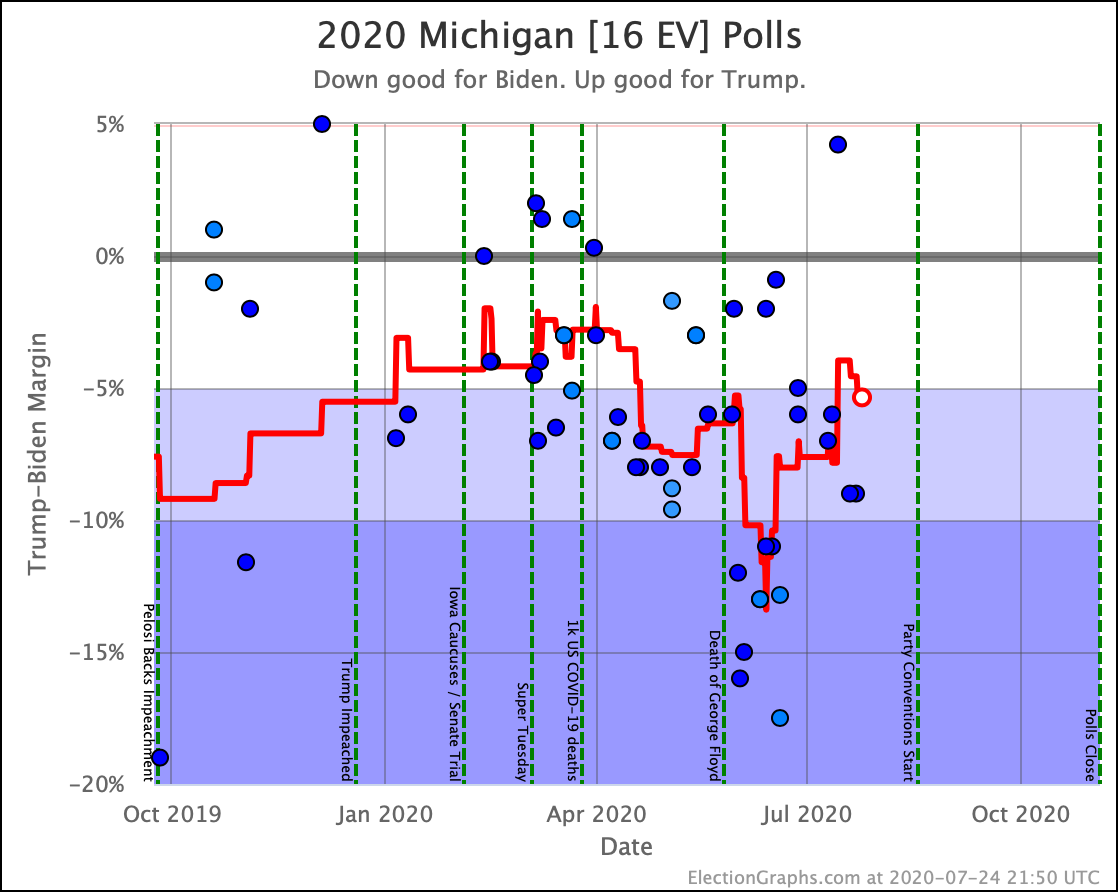
After a lot of polls in June showing Biden with 10%+ leads in Michigan, more recent polls caused Biden to drop below a 5% lead in the average… for a little bit… before new polls showed Biden's lead increasing again.
Biden's lead is nowhere near as strong as it was in mid-June, but it is still a very strong lead.
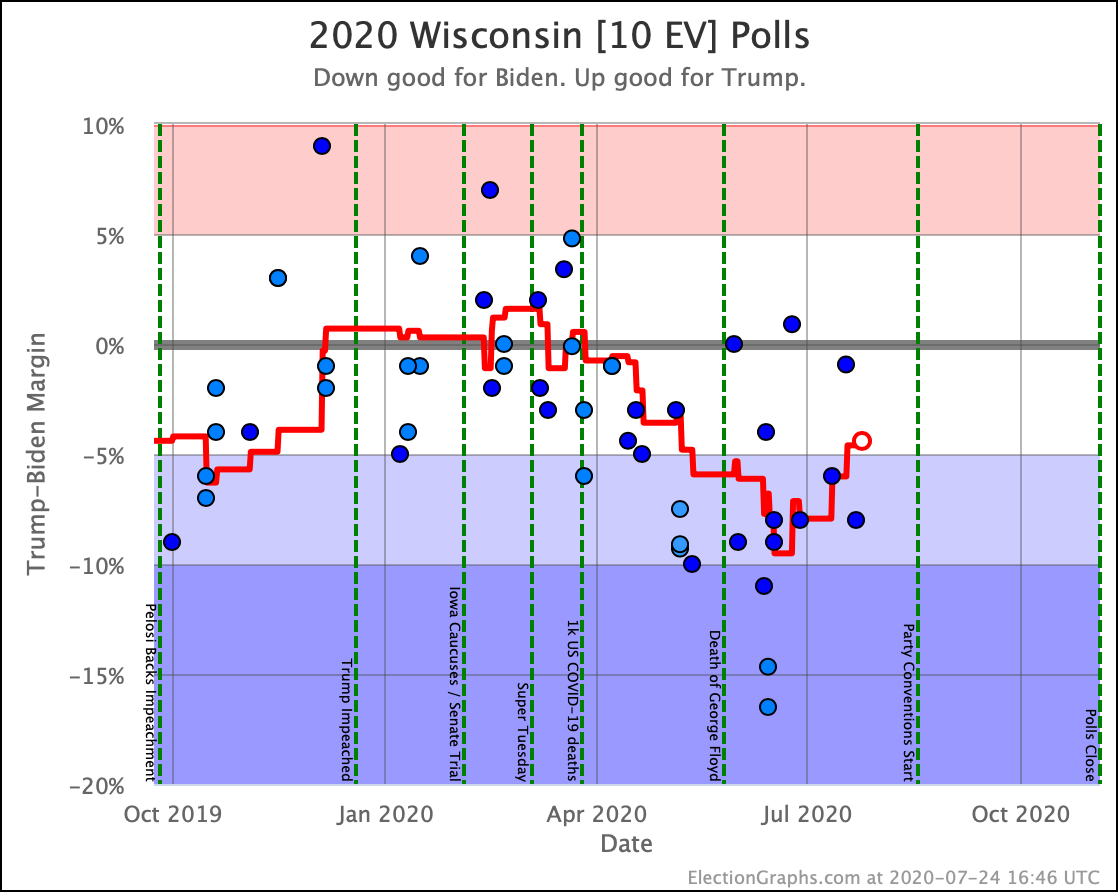
Wisconsin exhibits a similar pattern. A big move toward Biden, which has subsequently receded, still leaving Biden with a lead, but a much less substantial one than he had.
In Wisconsin's case, at the moment, Biden's lead is still under 5%, which means we consider it to be a state that Trump could steal under the right conditions, so this movement is responsible for the 20 electoral vote improvement to Trump's best case margin.
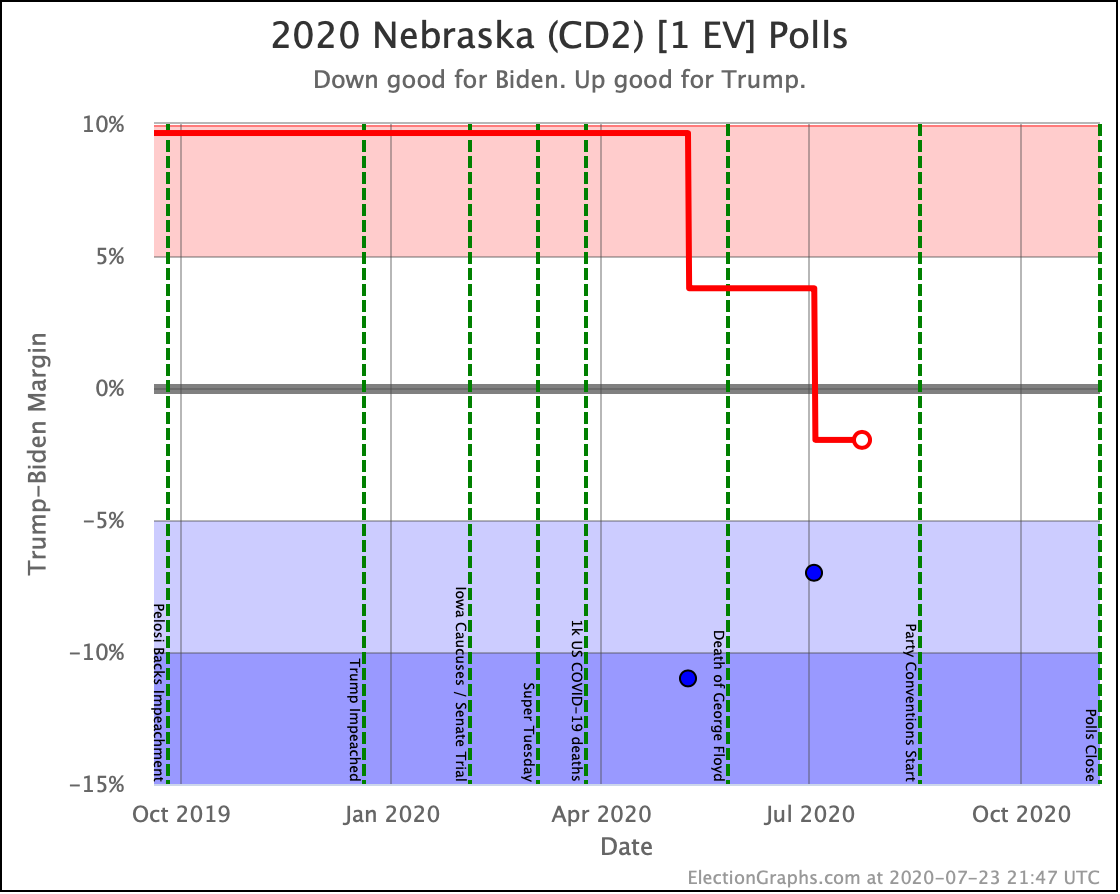
Along with Maine, Nebraska is one of the two states that award some of their electoral votes by congressional district. Polls for the two congressional districts in Maine and the three in Nebraska tend to be rare. But we now have two for Nebraska's 2nd congressional district.
The five poll average still includes the 2008-2016 election results as a baseline as well as the two actual 2020 polls. But both of the new polls show a substantial Biden lead, which is enough to pull the district into "Weak Biden" territory for the moment. If future polls back up the first two, this may end up as a Strong Biden electoral vote before we are done.
In addition to the states above that changed categories, we have some intra-category movement with these close states:
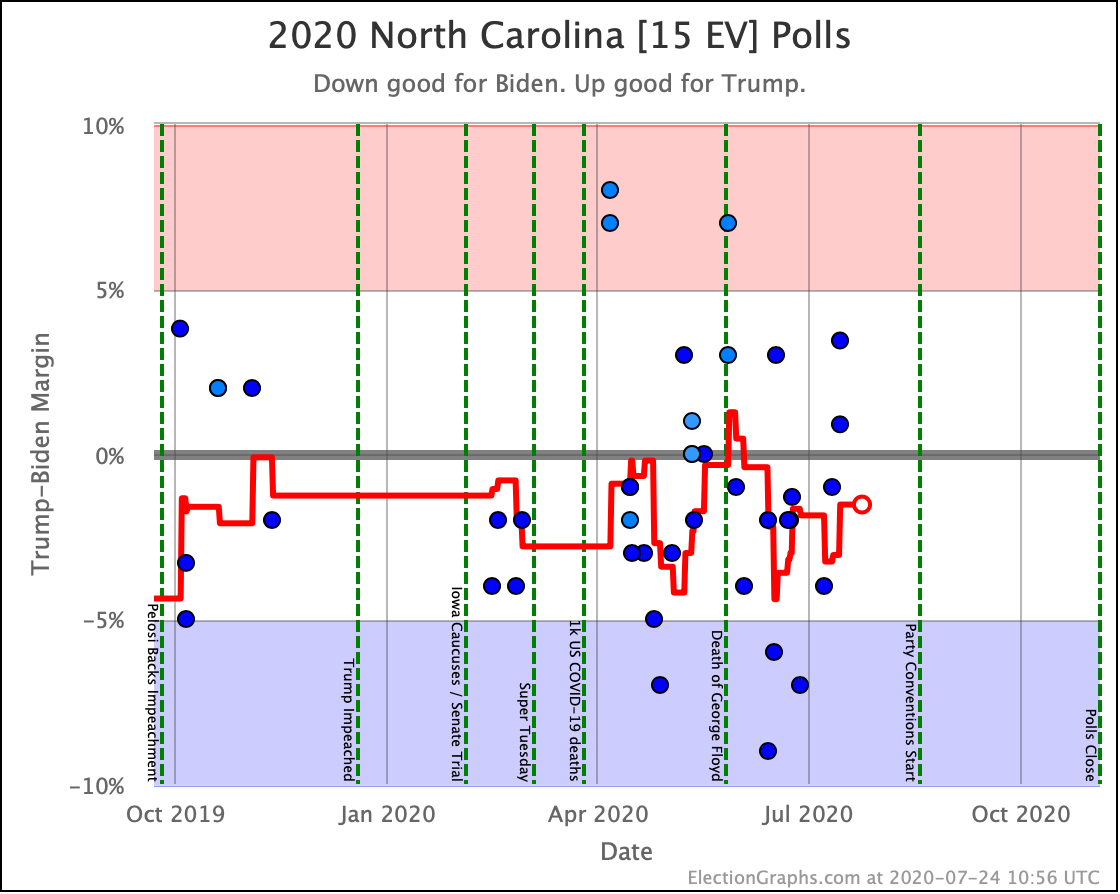
There is a decent amount of range between the best polls for Biden and the best polls for Trump in North Carolina. The poll average itself has bounced around quite a bit too.
But, in the last year, aside from a short time in May, polling has consistently had North Carolina in the "Weak Biden" category, even when other states have been swinging dramatically in one direction or the other.
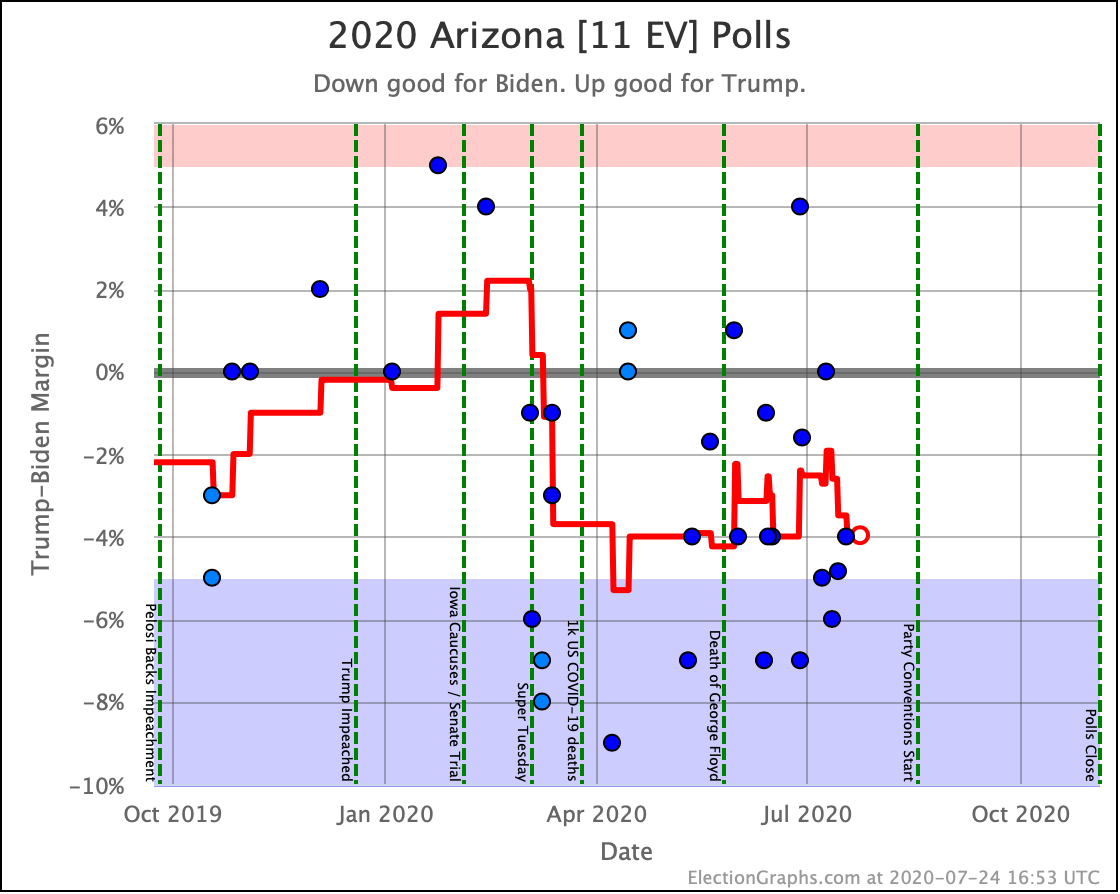
Arizona had a bit longer foray over to the Trump side from late January to early March, but since then, Biden has maintained a small but steady lead.
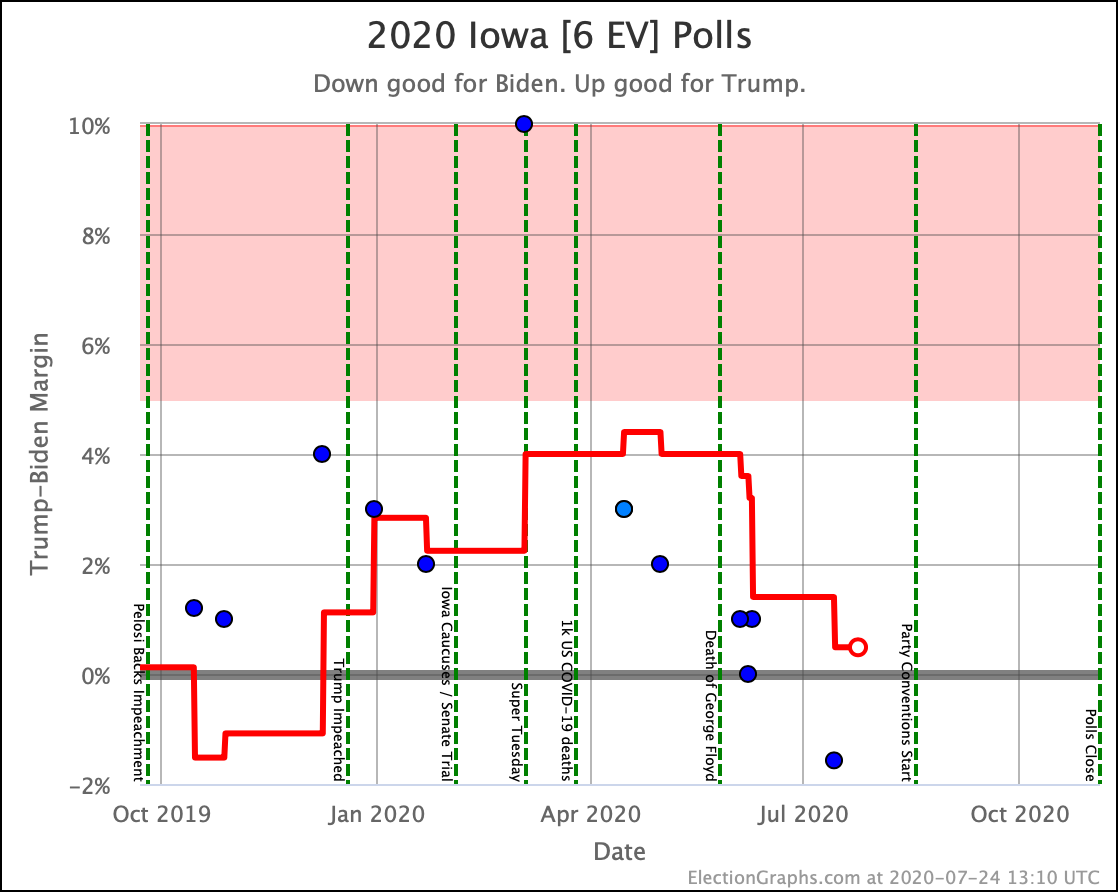
And finally, Iowa, which has been "Weak Trump" since December, but where Biden has been gaining on Trump since late April.
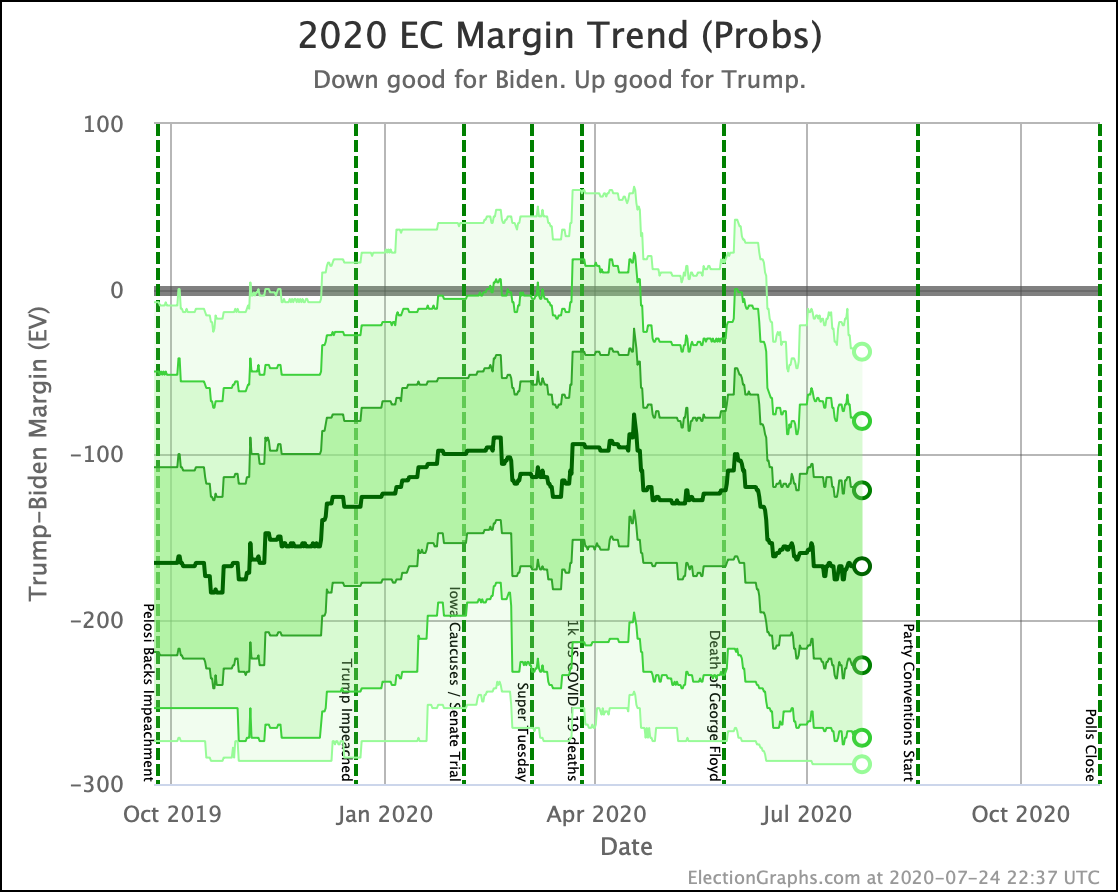
With all of these changes together, the probabilistic model produces a view that recognizes that "just barely Trump" and "just barely Biden" are both tossups, rather than immediately classifying a state on one side or the other. We run about a million simulations based on the current polling, and an analysis of the 2008-2016 polling average accuracy here on Election Graphs, and get this…
The big move toward Biden and back caused by Texas and Georgia is not evident here like it is in the categorization model.
Instead, in the median case, we see the rapid movement toward Biden in the first half of June, a slower movement toward Biden through about the July 4th holiday, and then things being stable since then. This is our plateau.
In addition, for the lines showing the top of our 2σ (95.45% chance) and 3σ (99.73% chance) probability bands, you can see Trump improving at the end of June, but losing most of that gain over the following few weeks. This represents Trump's temporary improvement in Weak Biden states, which then slipped away again.
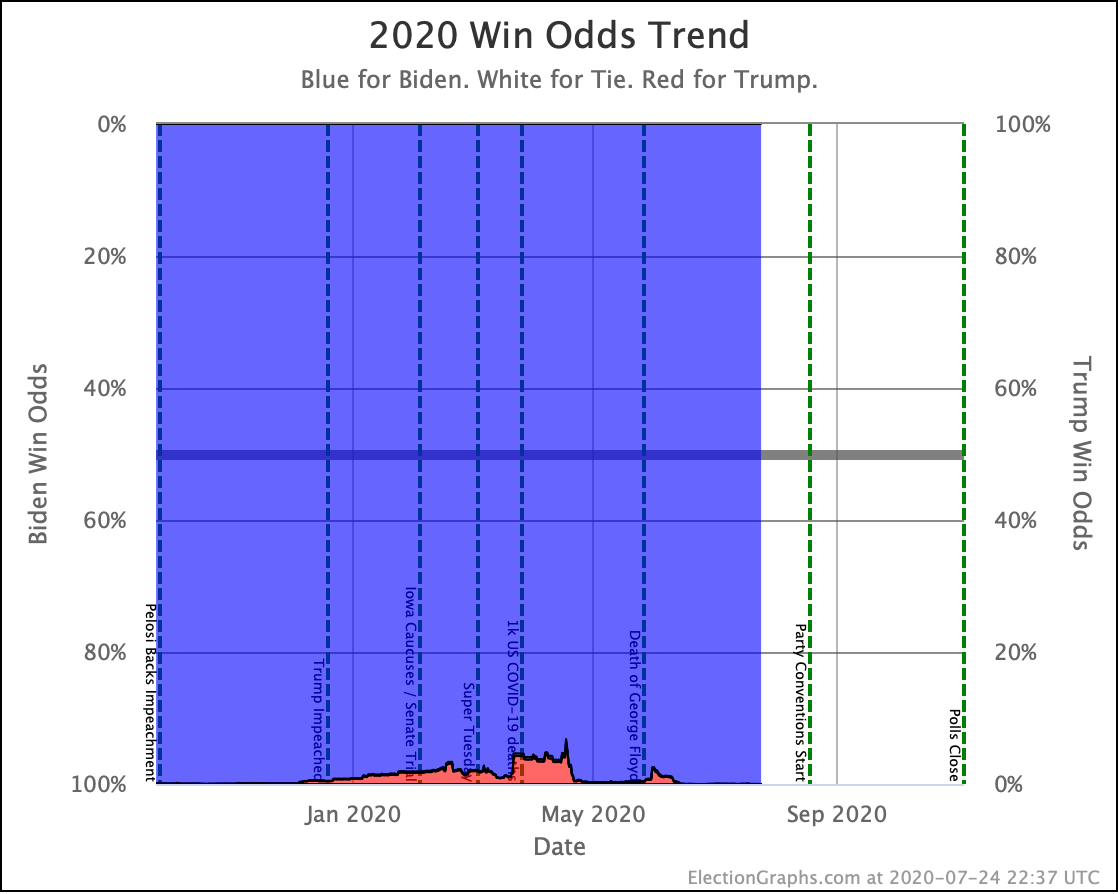
In terms of Biden's chances of winning if the election was held today (which it is not!), the odds are still pegged at a number which rounds to 100%. But if you look at the unrounded number, it is 99.9931%, which is not quite as good as the 99.9977% in the last blog post.
The risk for Biden would not be in the odds if the election were held today. At the moment, Biden has a very strong lead, large enough that we wouldn't expect a different outcome due to systematic polling error or anything like that. No, the risk is that there are still 102 days until election results start coming in, and there is time for the situation to change.
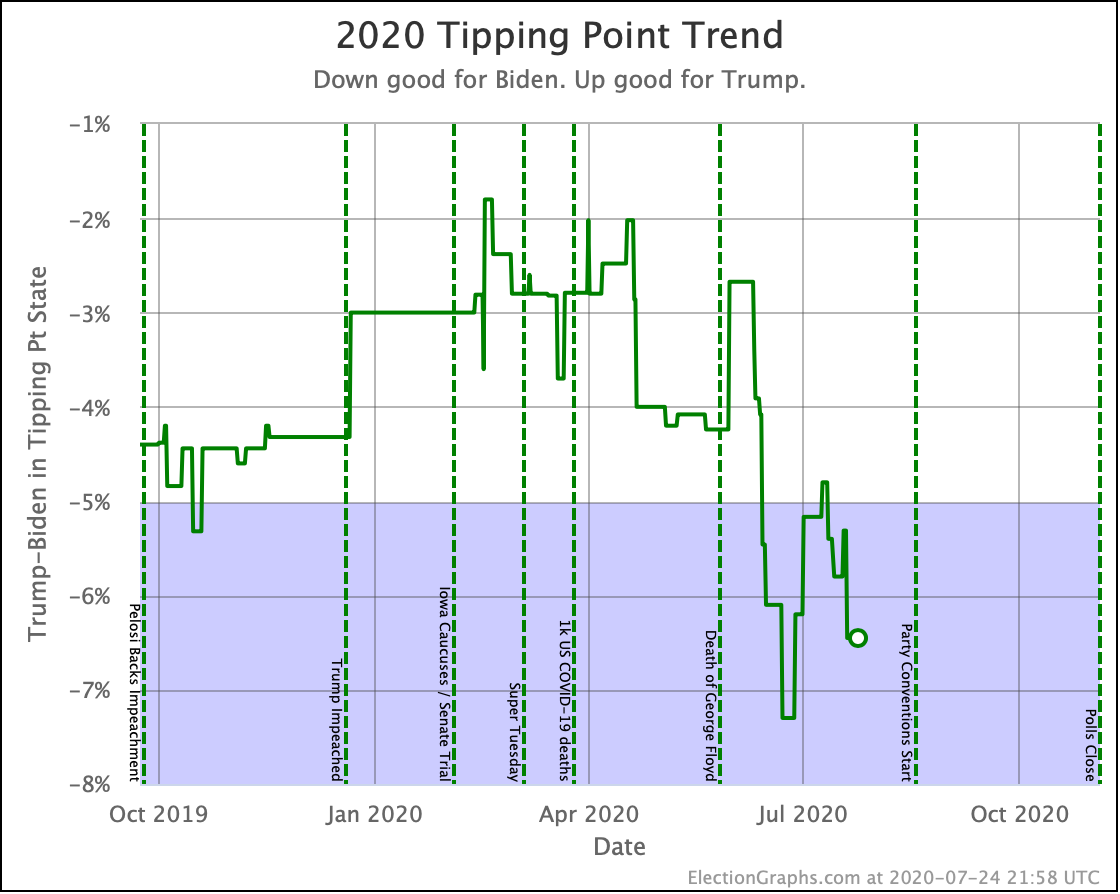
Which brings us to the tipping point, which measures just how much things have to change to flip the winner.
Last time we noted the movement from Biden by 2.7% to Biden by 7.3% in less than two weeks. Since then, Trump improved in this metric to only losing to Biden by 4.8% in the tipping-point state but then slipped again, now losing by 6.5%.
The thing that this chart helps us remember is how fast things can change with the right events in the news. If Biden can gain 4.6% in two weeks, then given the right combination of events, he could lose 4.6% in a similar period. If that were to happen, he would only be ahead by 1.9% in the tipping point state… just barely better than the 1.6% lead Clinton had in the tipping point on Election Eve 2016, so clearly within the realm that things could go the other way.
But that isn't where things are today. Today Biden has a huge lead. The question is if he keeps it over the next 102 days.
As we have in the last couple of posts, let's make a quick comparison of where Biden is today and where Clinton was at the same point in 2016.
| <102 Days Out> | 2016 | 2020 |
|---|---|---|
| Expected Case | Clinton by 144 | Biden by 168 |
| Tipping Point | Clinton by 2.8% | Biden by 6.5% |
Biden continues to be significantly stronger than Clinton was.
Now a quick look at the spectrum of states that are either actively in play, or could be if there is a significant movement toward one candidate or the other:
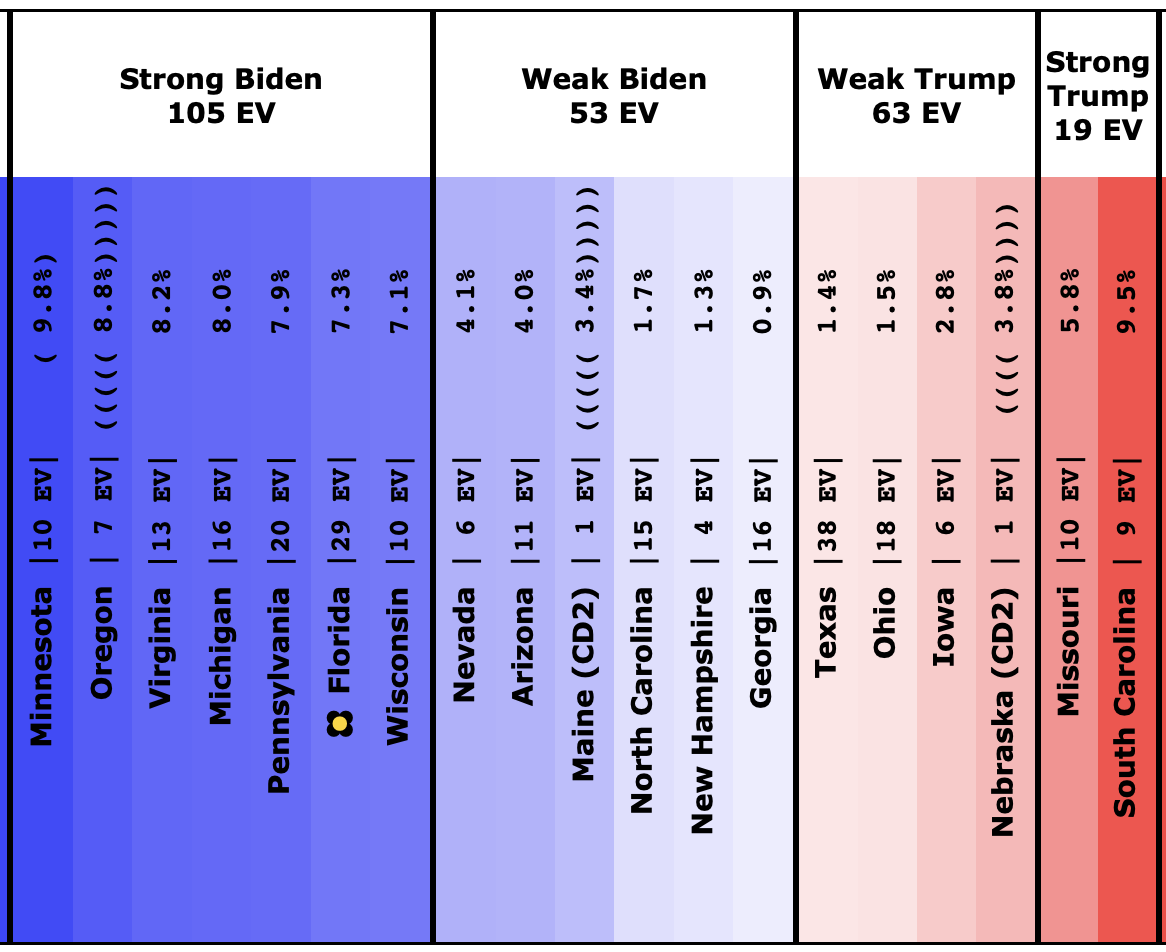
Here is what it looked like in our last update:
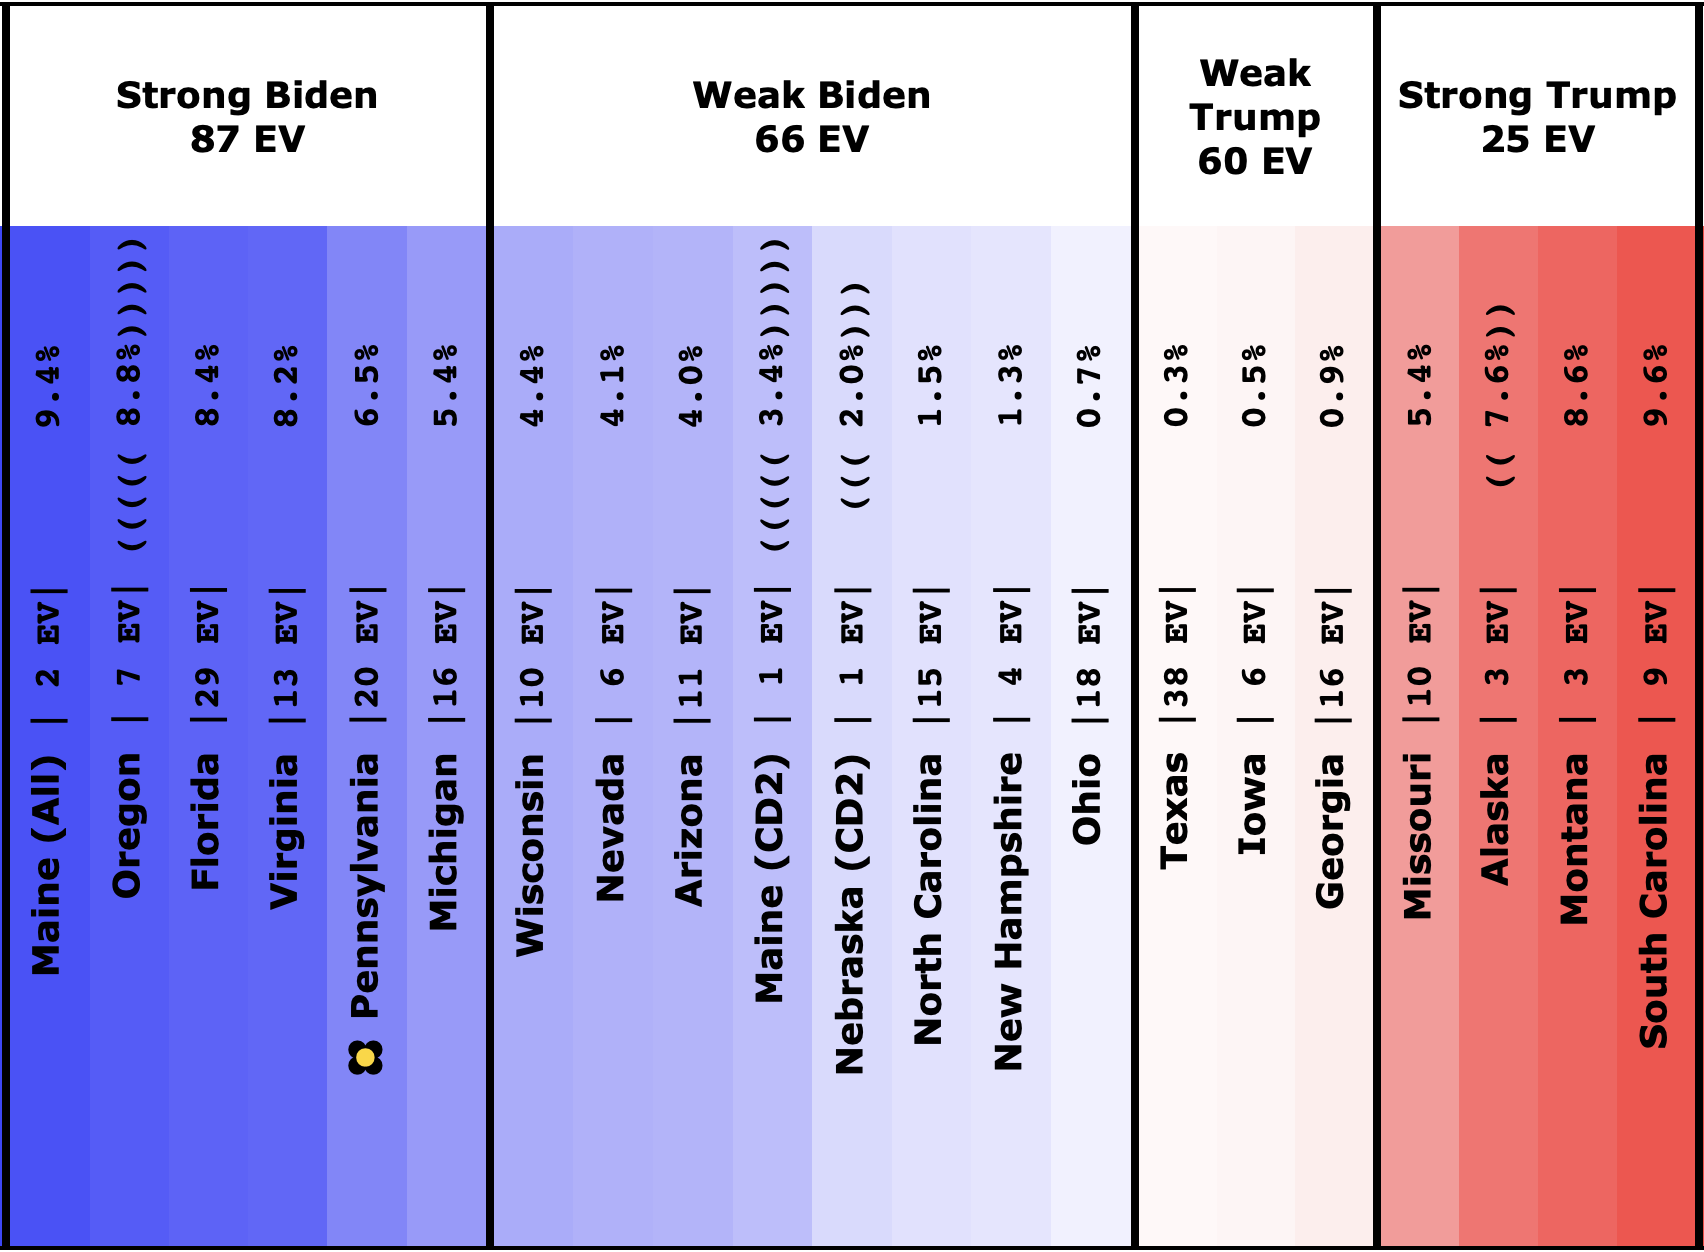
And here is how it looks today:
Fundamentally, while at the moment Biden can win without ANY of the close states, at the same time there are a LOT of "Weak Biden" states that are stealable by Trump with a relatively small move in the polls, so it wouldn't take a lot to change this picture dramatically.
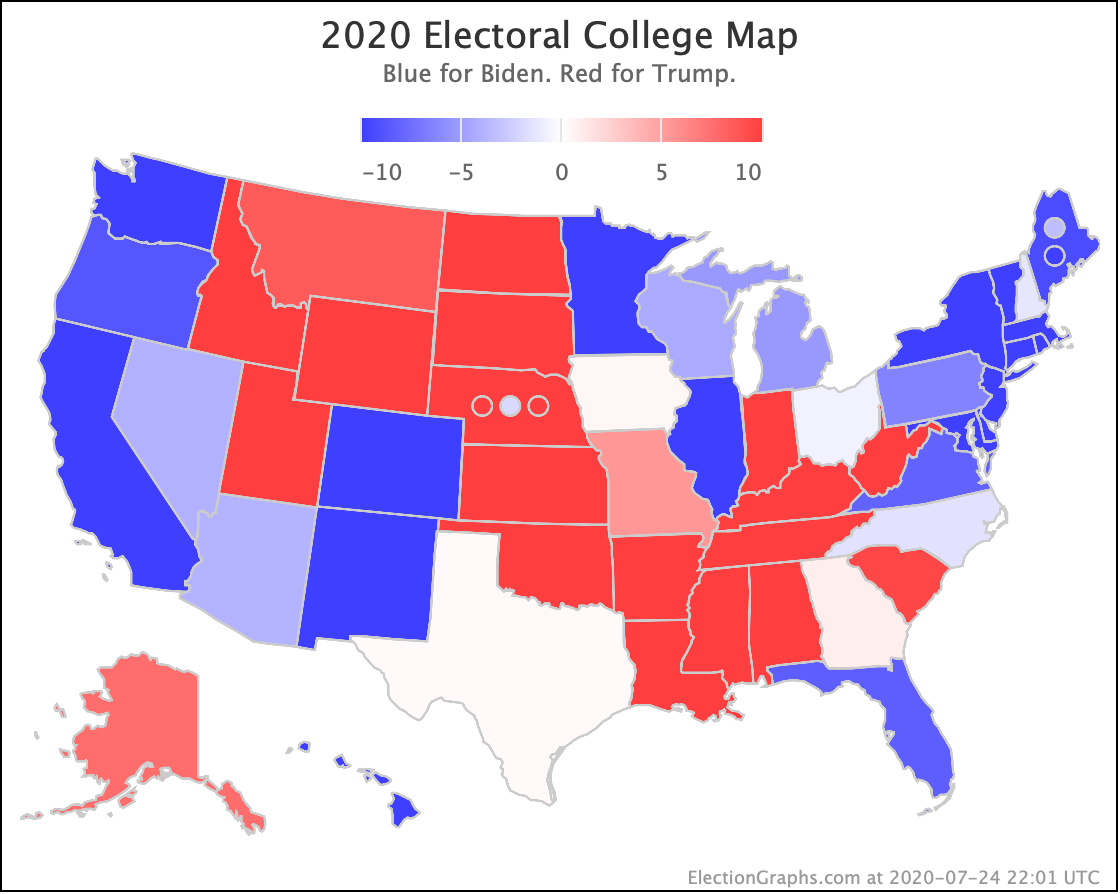
Finally, the current map:
102.0 days until polls start to close on election night. Stay tuned!
For more information:
This post is an update based on the data on the Election Graphs Electoral College 2020 page. Election Graphs tracks a poll-based estimate of the Electoral College. The charts, graphs, and maps in the post above are all as of the time of this post. Click through on any image for current interactive versions of the chart, along with additional details.
Follow @ElectionGraphs on Twitter or Election Graphs on Facebook to see announcements of updates. For those interested in individual poll updates, follow @ElecCollPolls on Twitter for all the polls as I add them. If you find the information in these posts informative or useful, please consider visiting the donation page.

One thought on “Biden Plateau?”