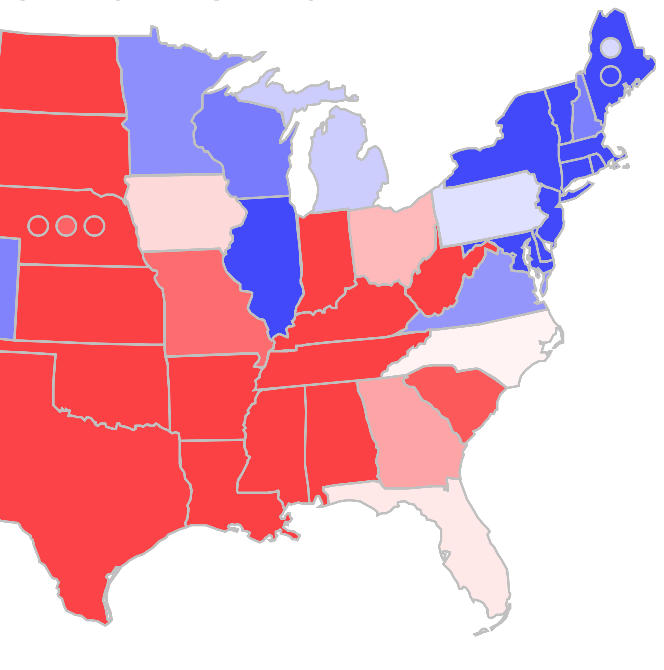
It isn't quite time to get everything launched properly for the 2020 version of Election Graphs… but 2020 is getting closer and closer. Here at Election Graphs HQ, I've been occupying myself with other things for a while, like launching the Wiki of the Day podcast a little over a year ago, and continuing with my weekly current events podcast Curmudgeon's Corner, but it is well past time to start getting things ready for 2020.
Behind the scenes I've done some additional analysis of the 2008 through 2016 election results that will inform what I do for 2016. I'll post a bit about that soon.
But first just to note the immediate changes to the site itself. The 2016 charts and graphs have been moved off the front page of Election Graphs in favor of a blog format where the analysis posts and such will live. In the last cycle, these had been posted on my personal blog, but now they will live natively on Election Graphs proper.
I haven't built out the new detail pages for 2020 yet. Those will be coming over the next few months. My target is to launch fully right after the 2018 general elections are over.
The archival material is still there of course, just tucked away a bit. For those looking for that:
- Election 2016 Overview
- Election 2016 Primary Delegate Race Charts
- Election 2016 General Electoral College Polling Charts
- Election 2016 related blog posts
- Election 2016 Post Mortem
- Archive of 2008, 2012, and 2016 election analysis
Thanks again to everybody who followed our analysis in 2016. I'm looking forward to doing it all again for 2020.
Stay tuned.
