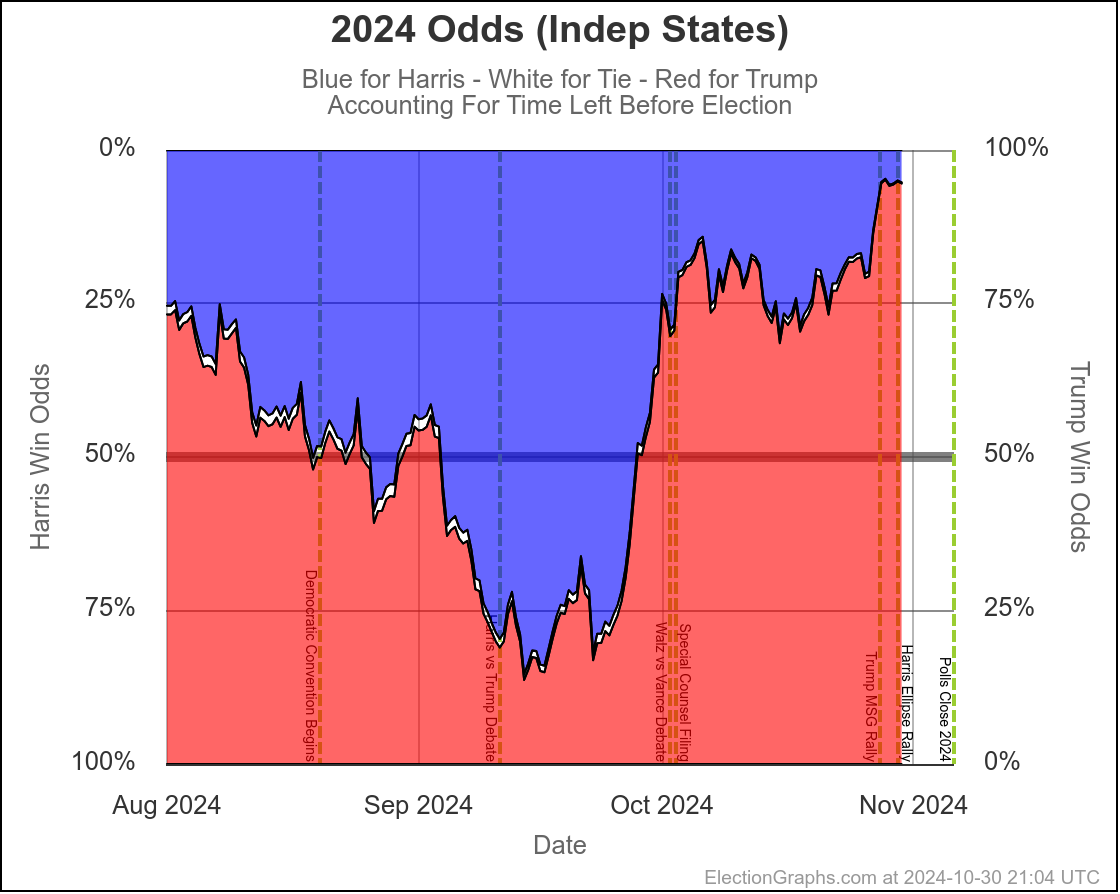
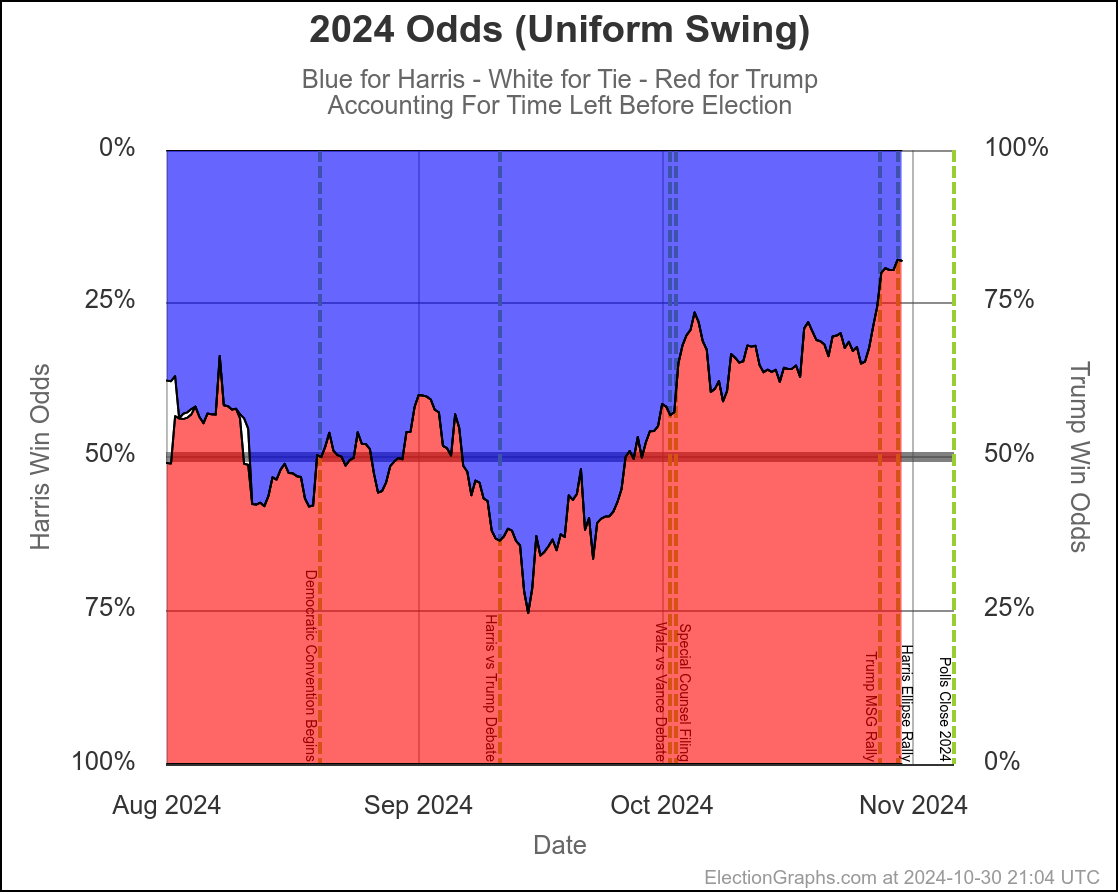
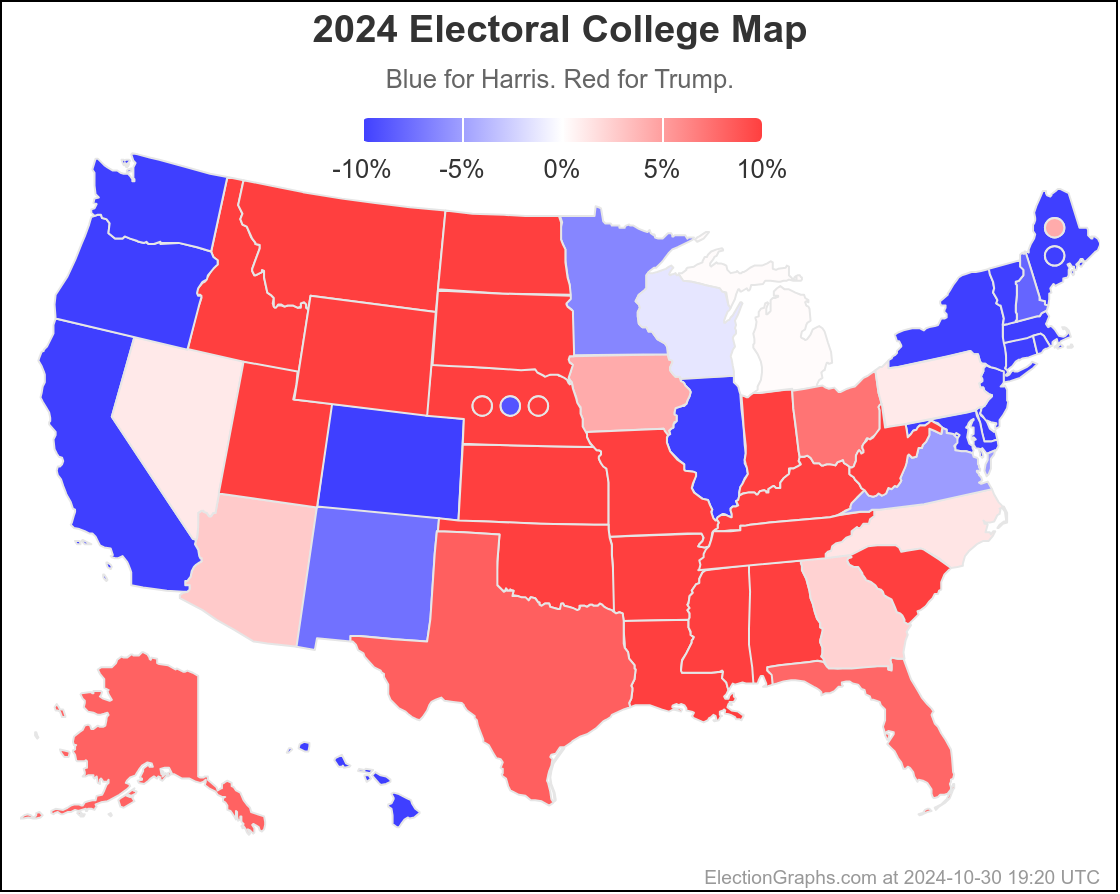
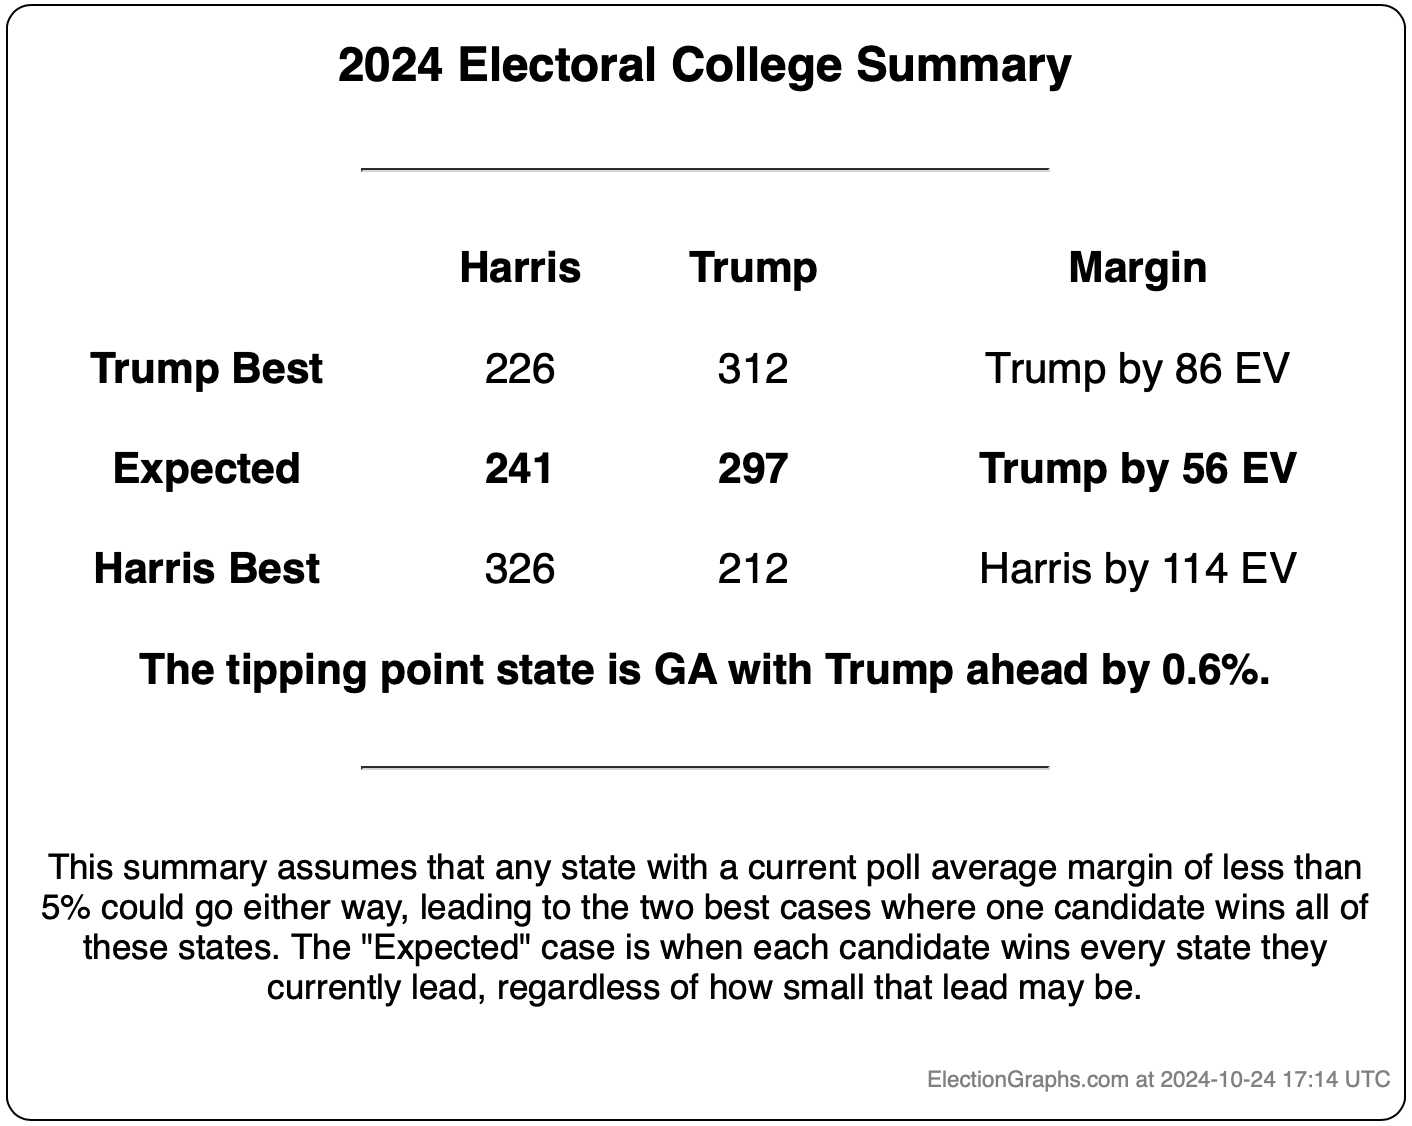
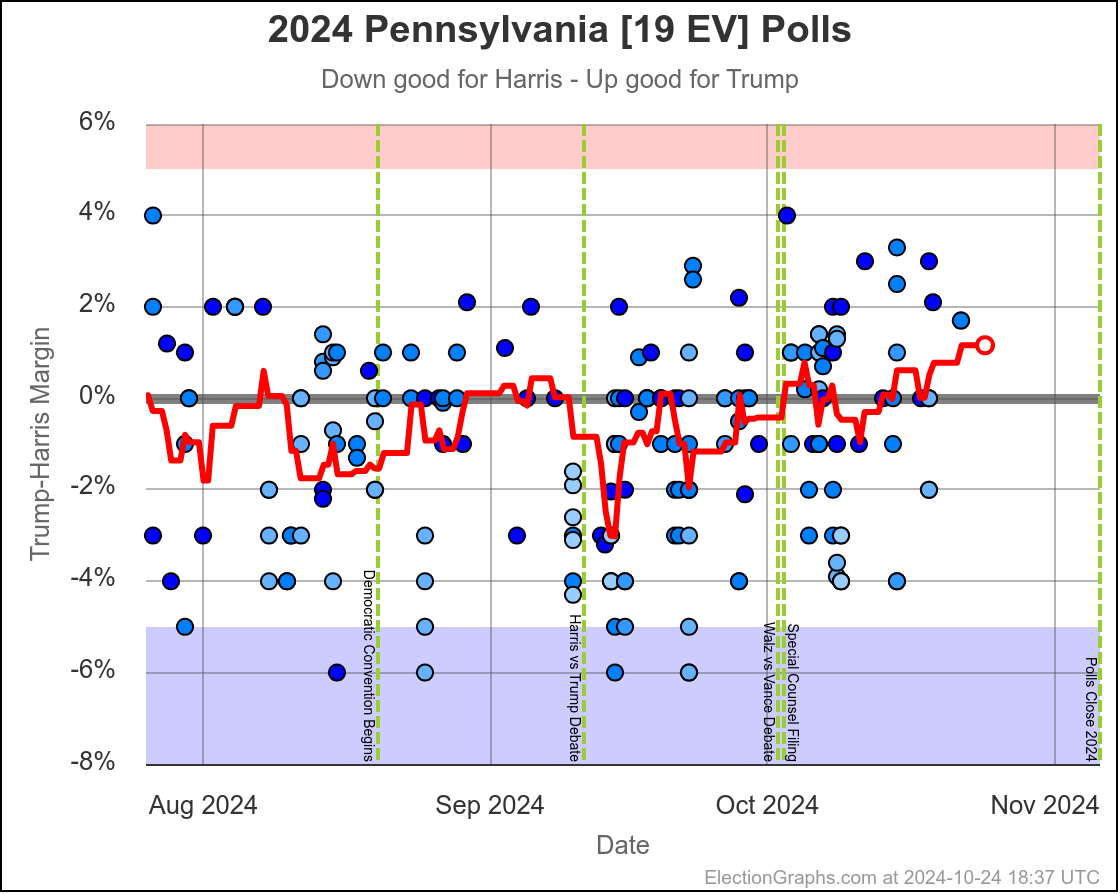
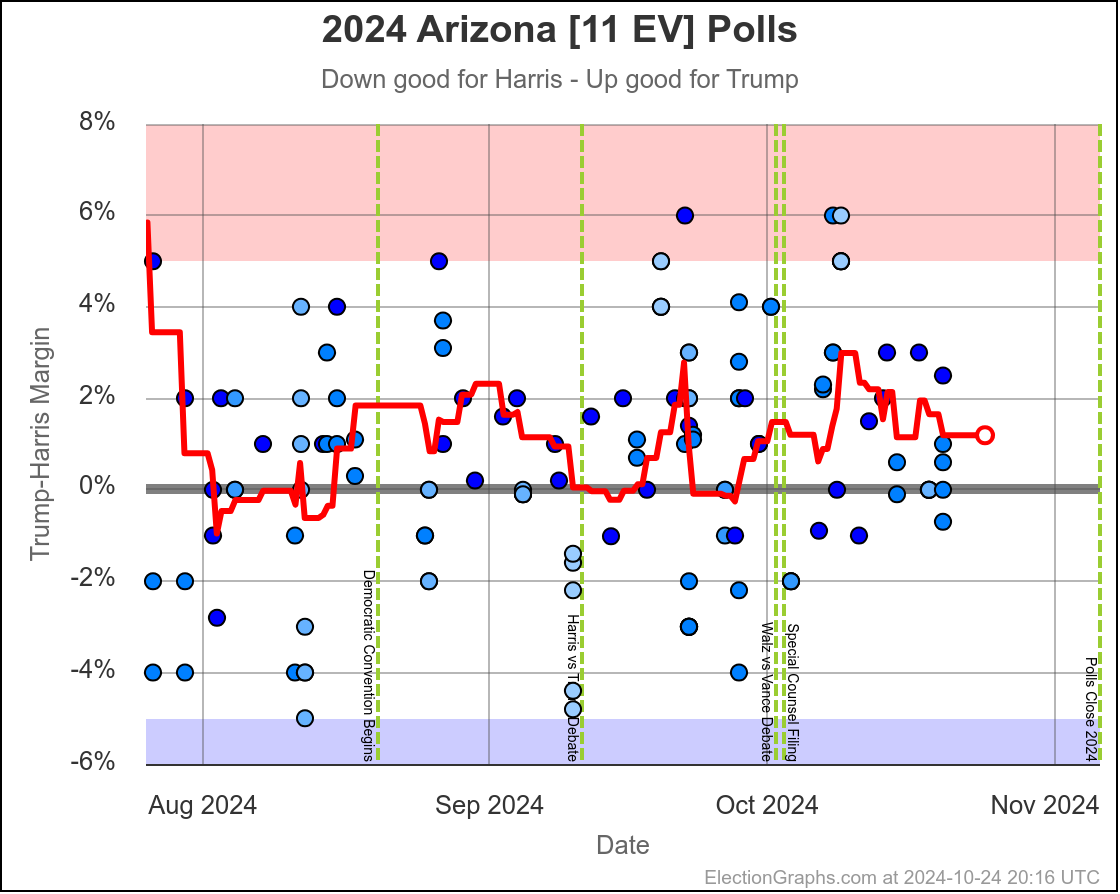
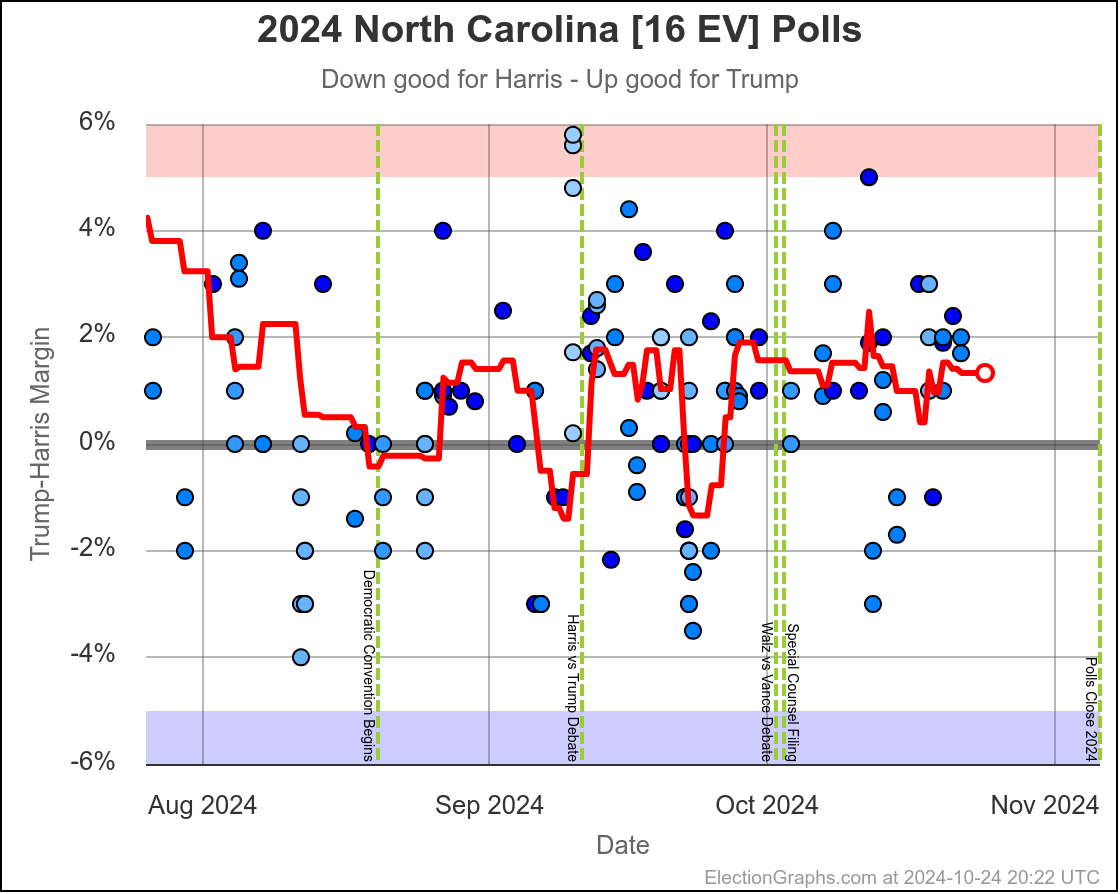
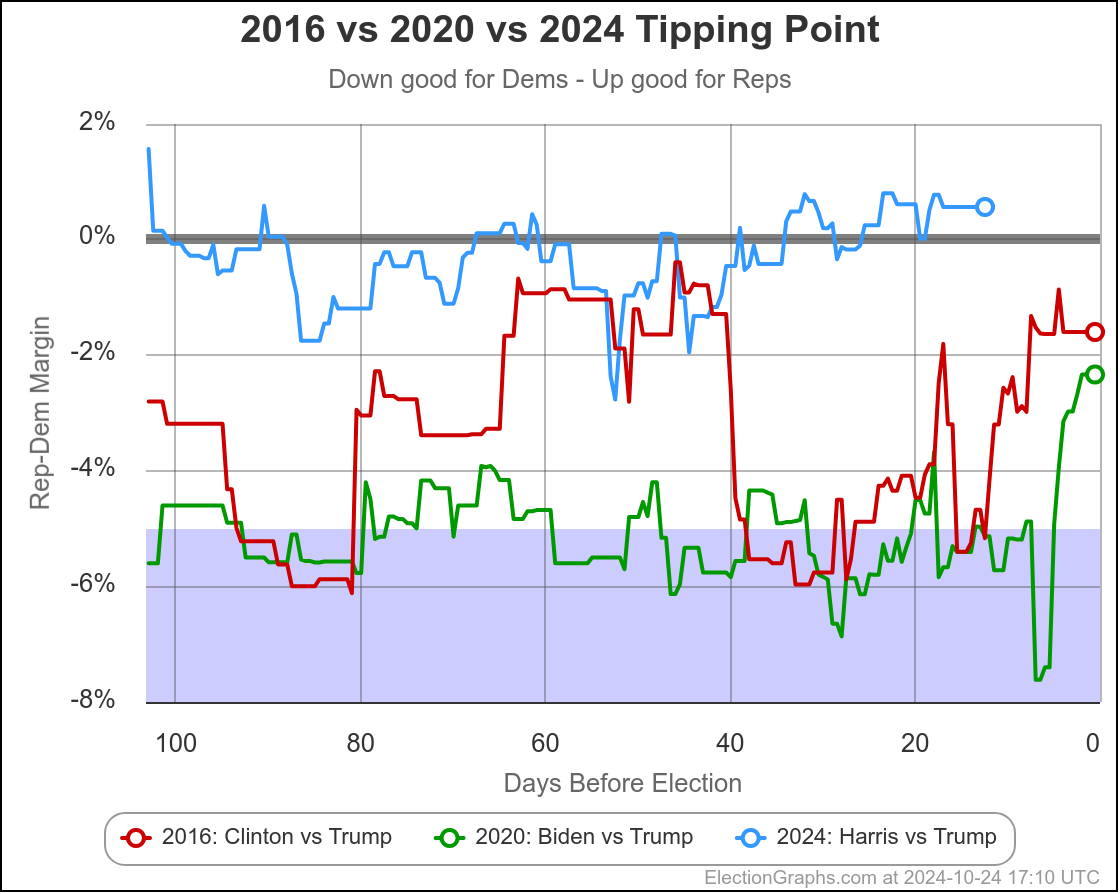
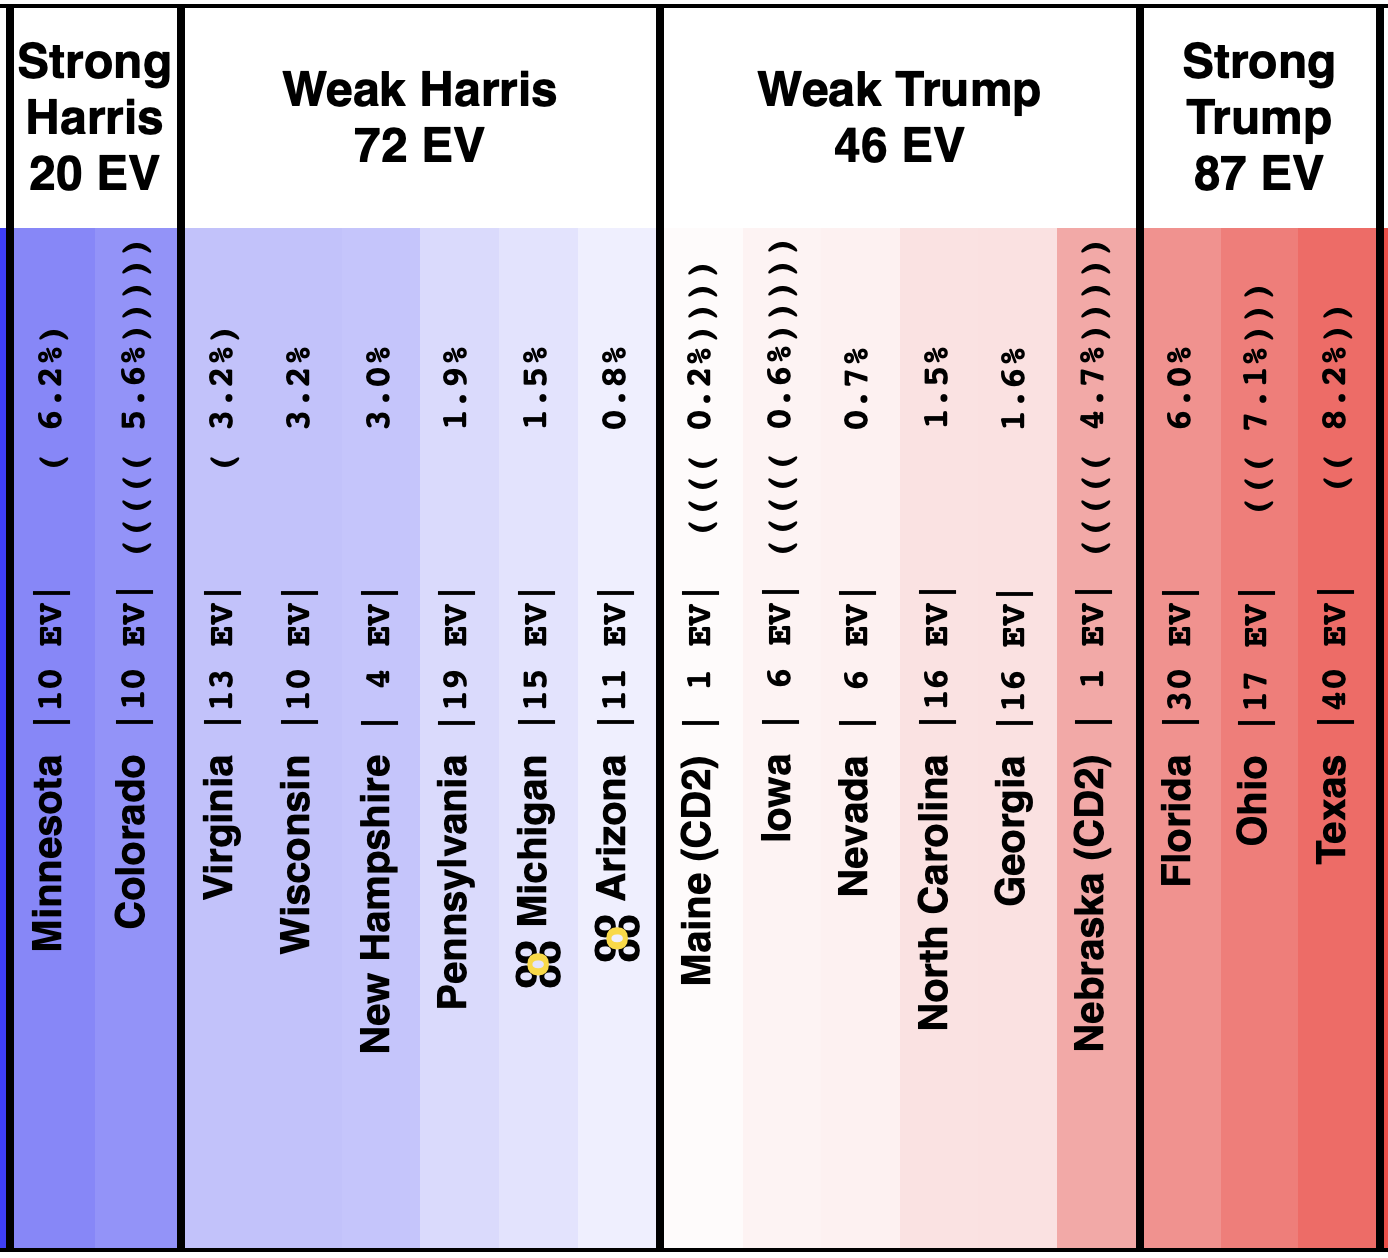
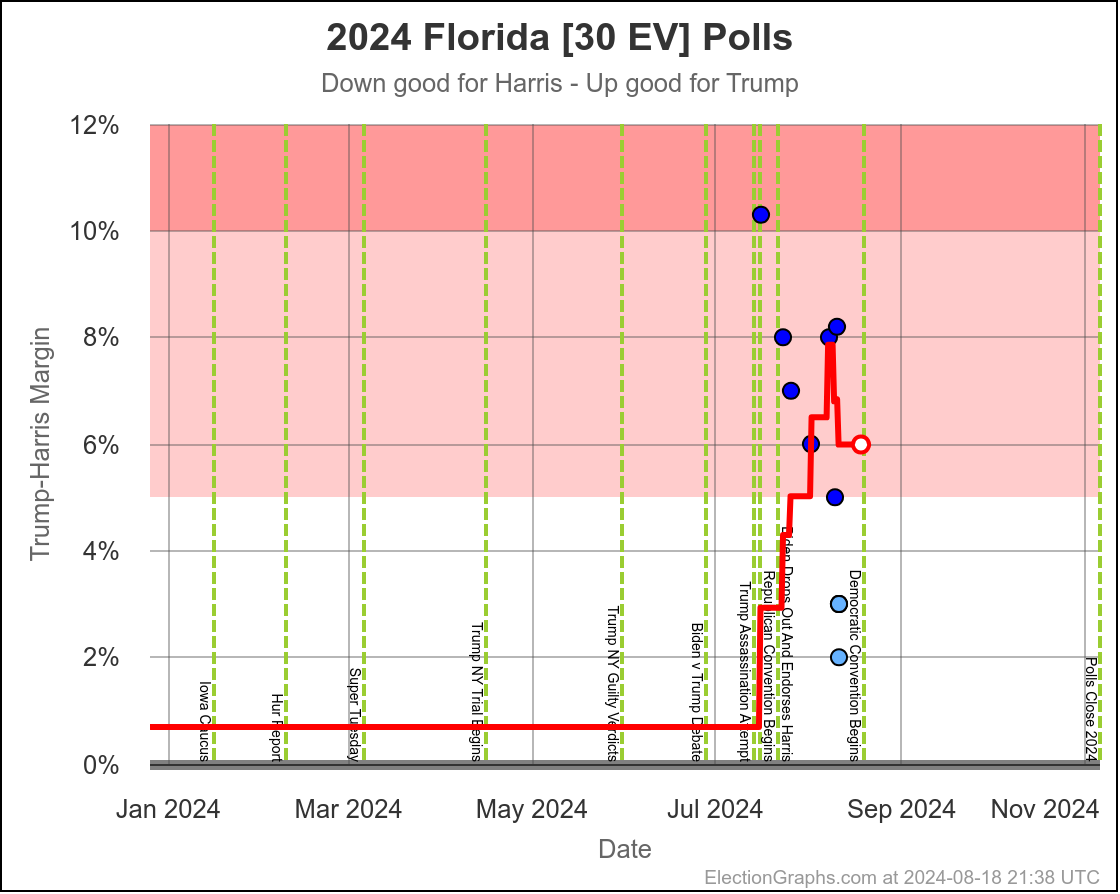
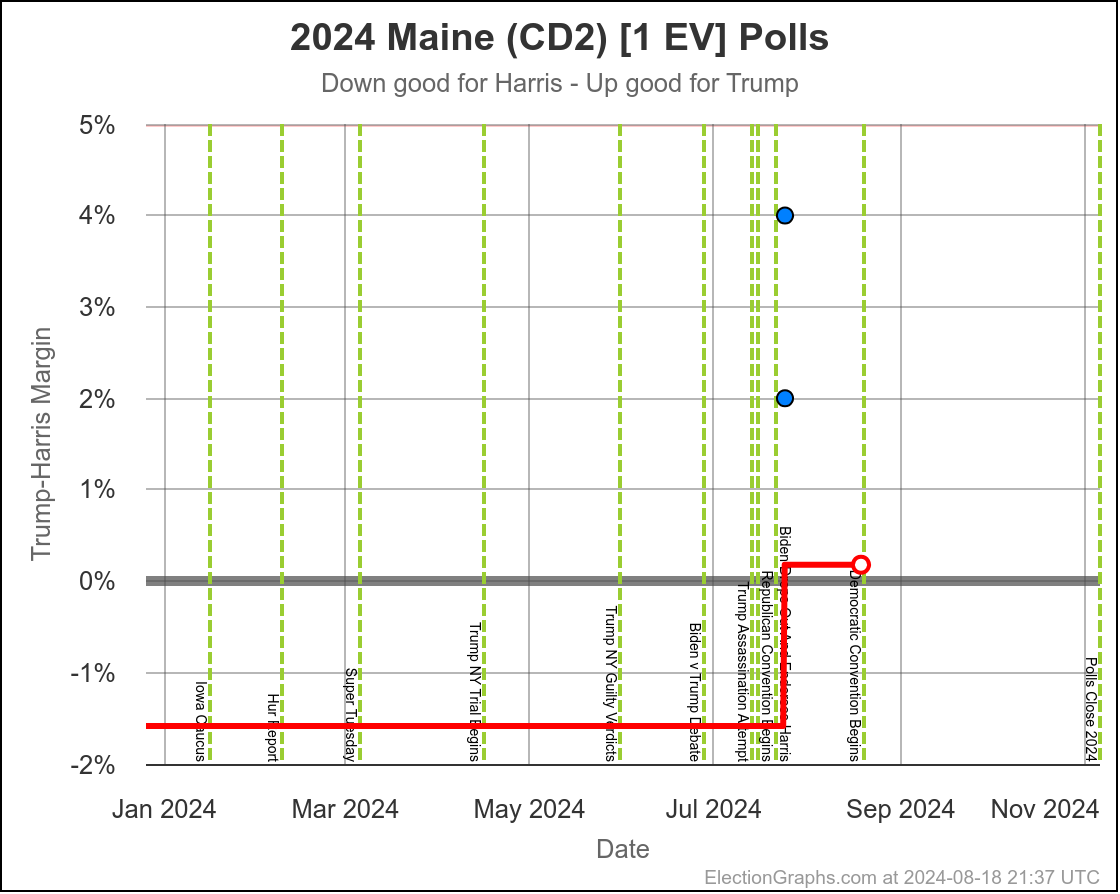
Preliminary Results Comparison

Vote totals are still preliminary, it will be weeks until they are finalized. But we know who won and we have a bunch of preliminary data.

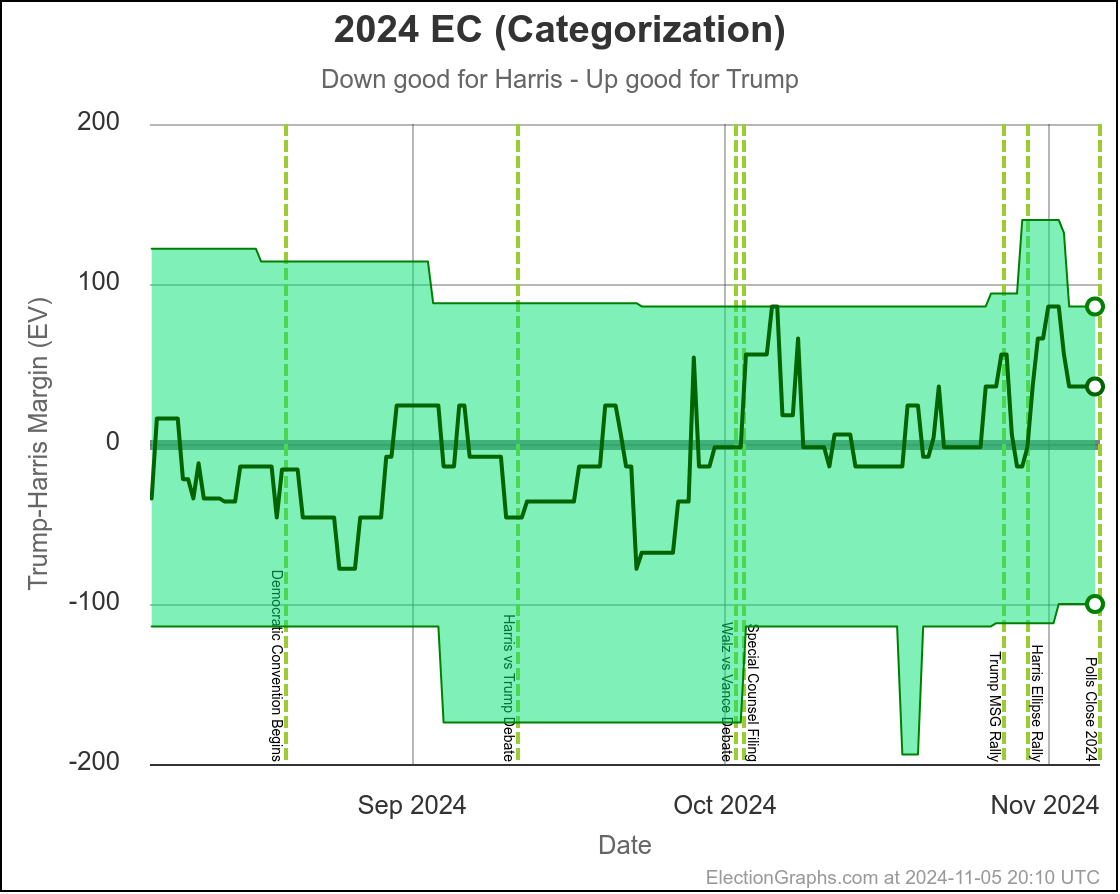
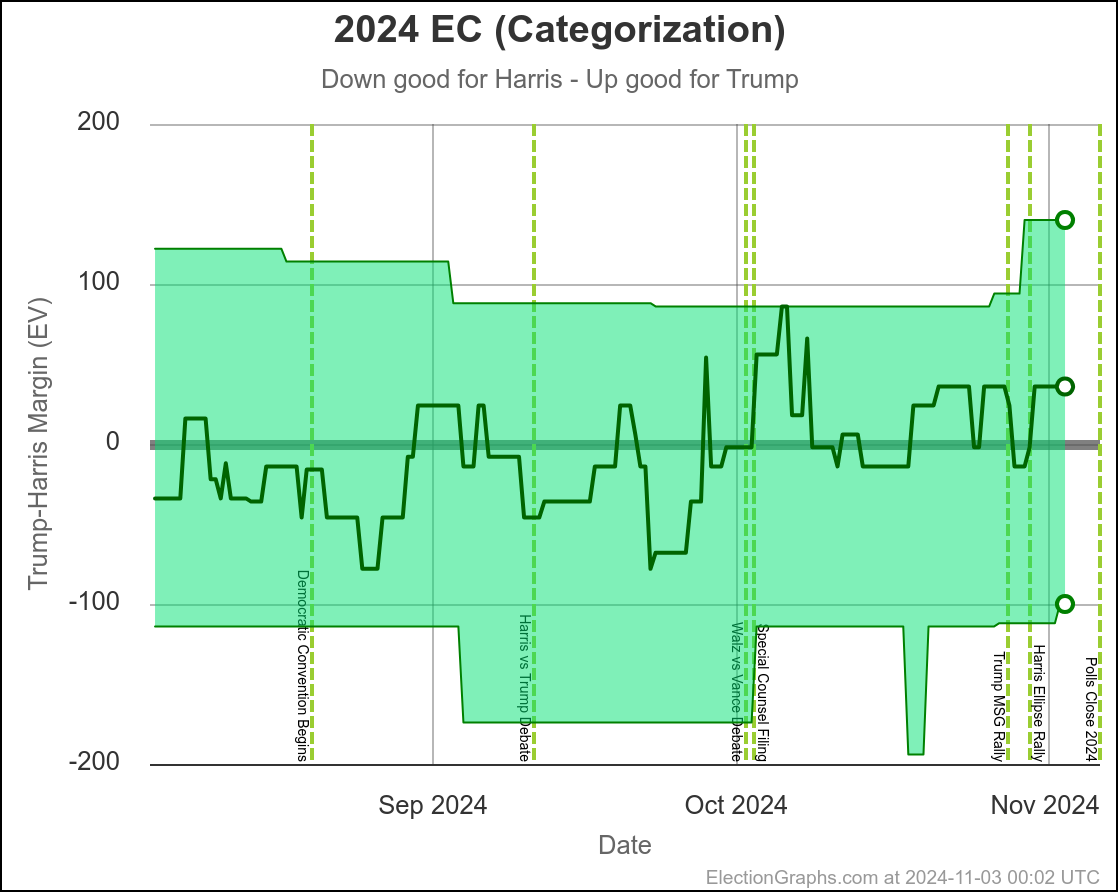
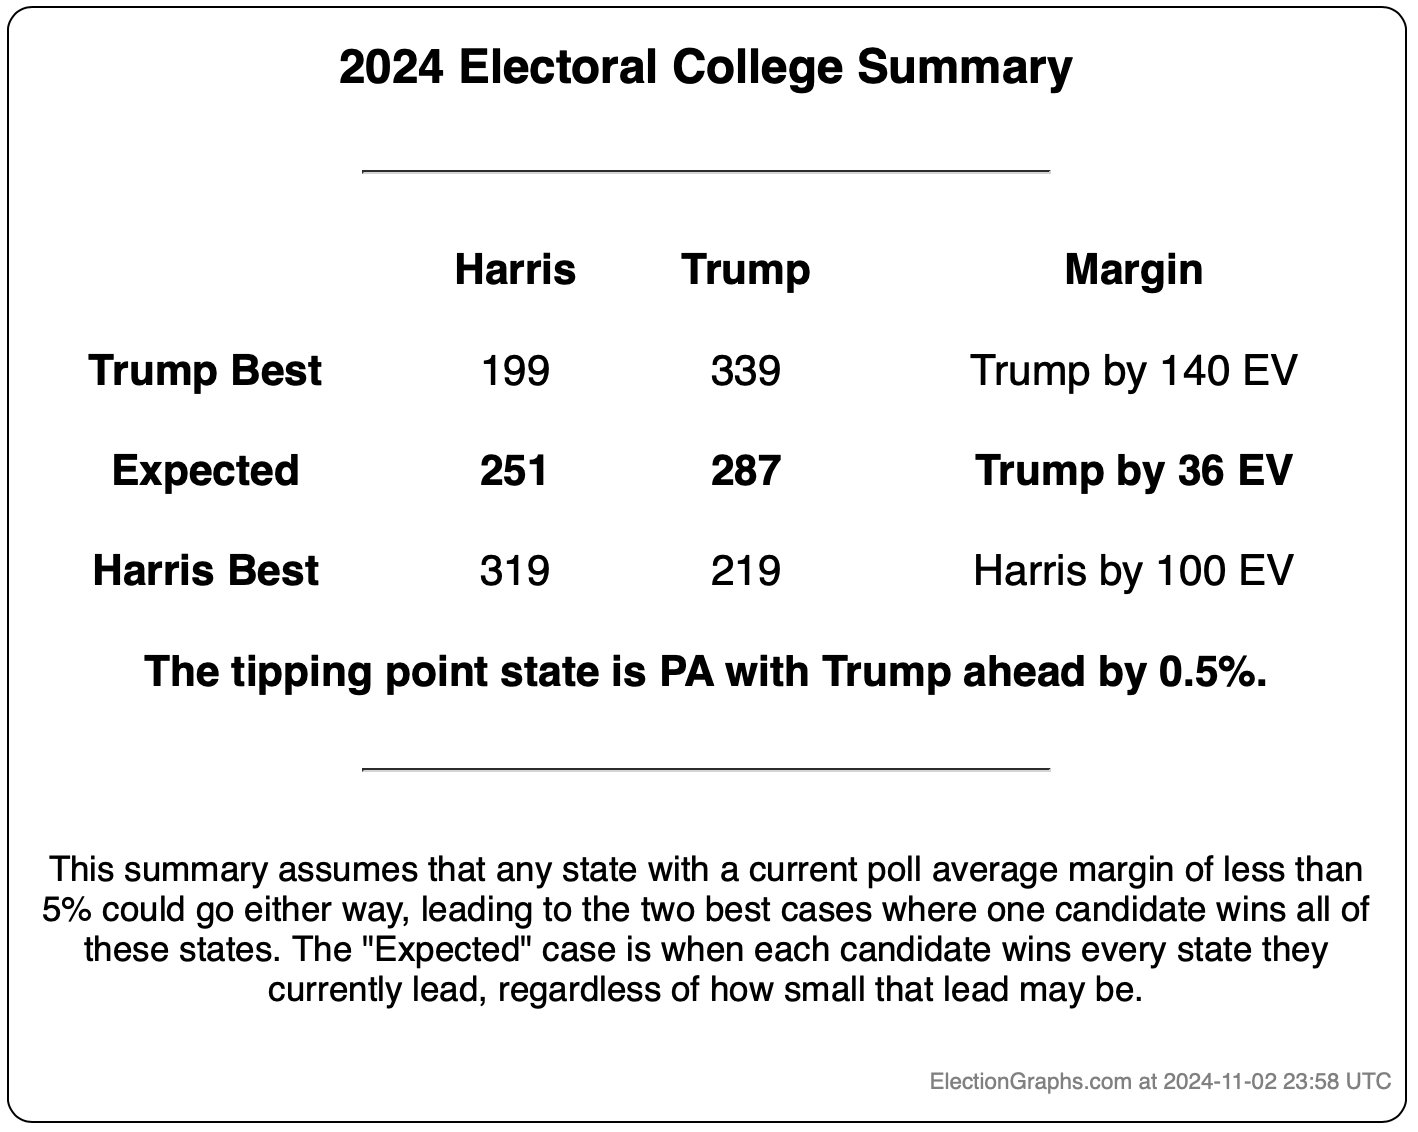
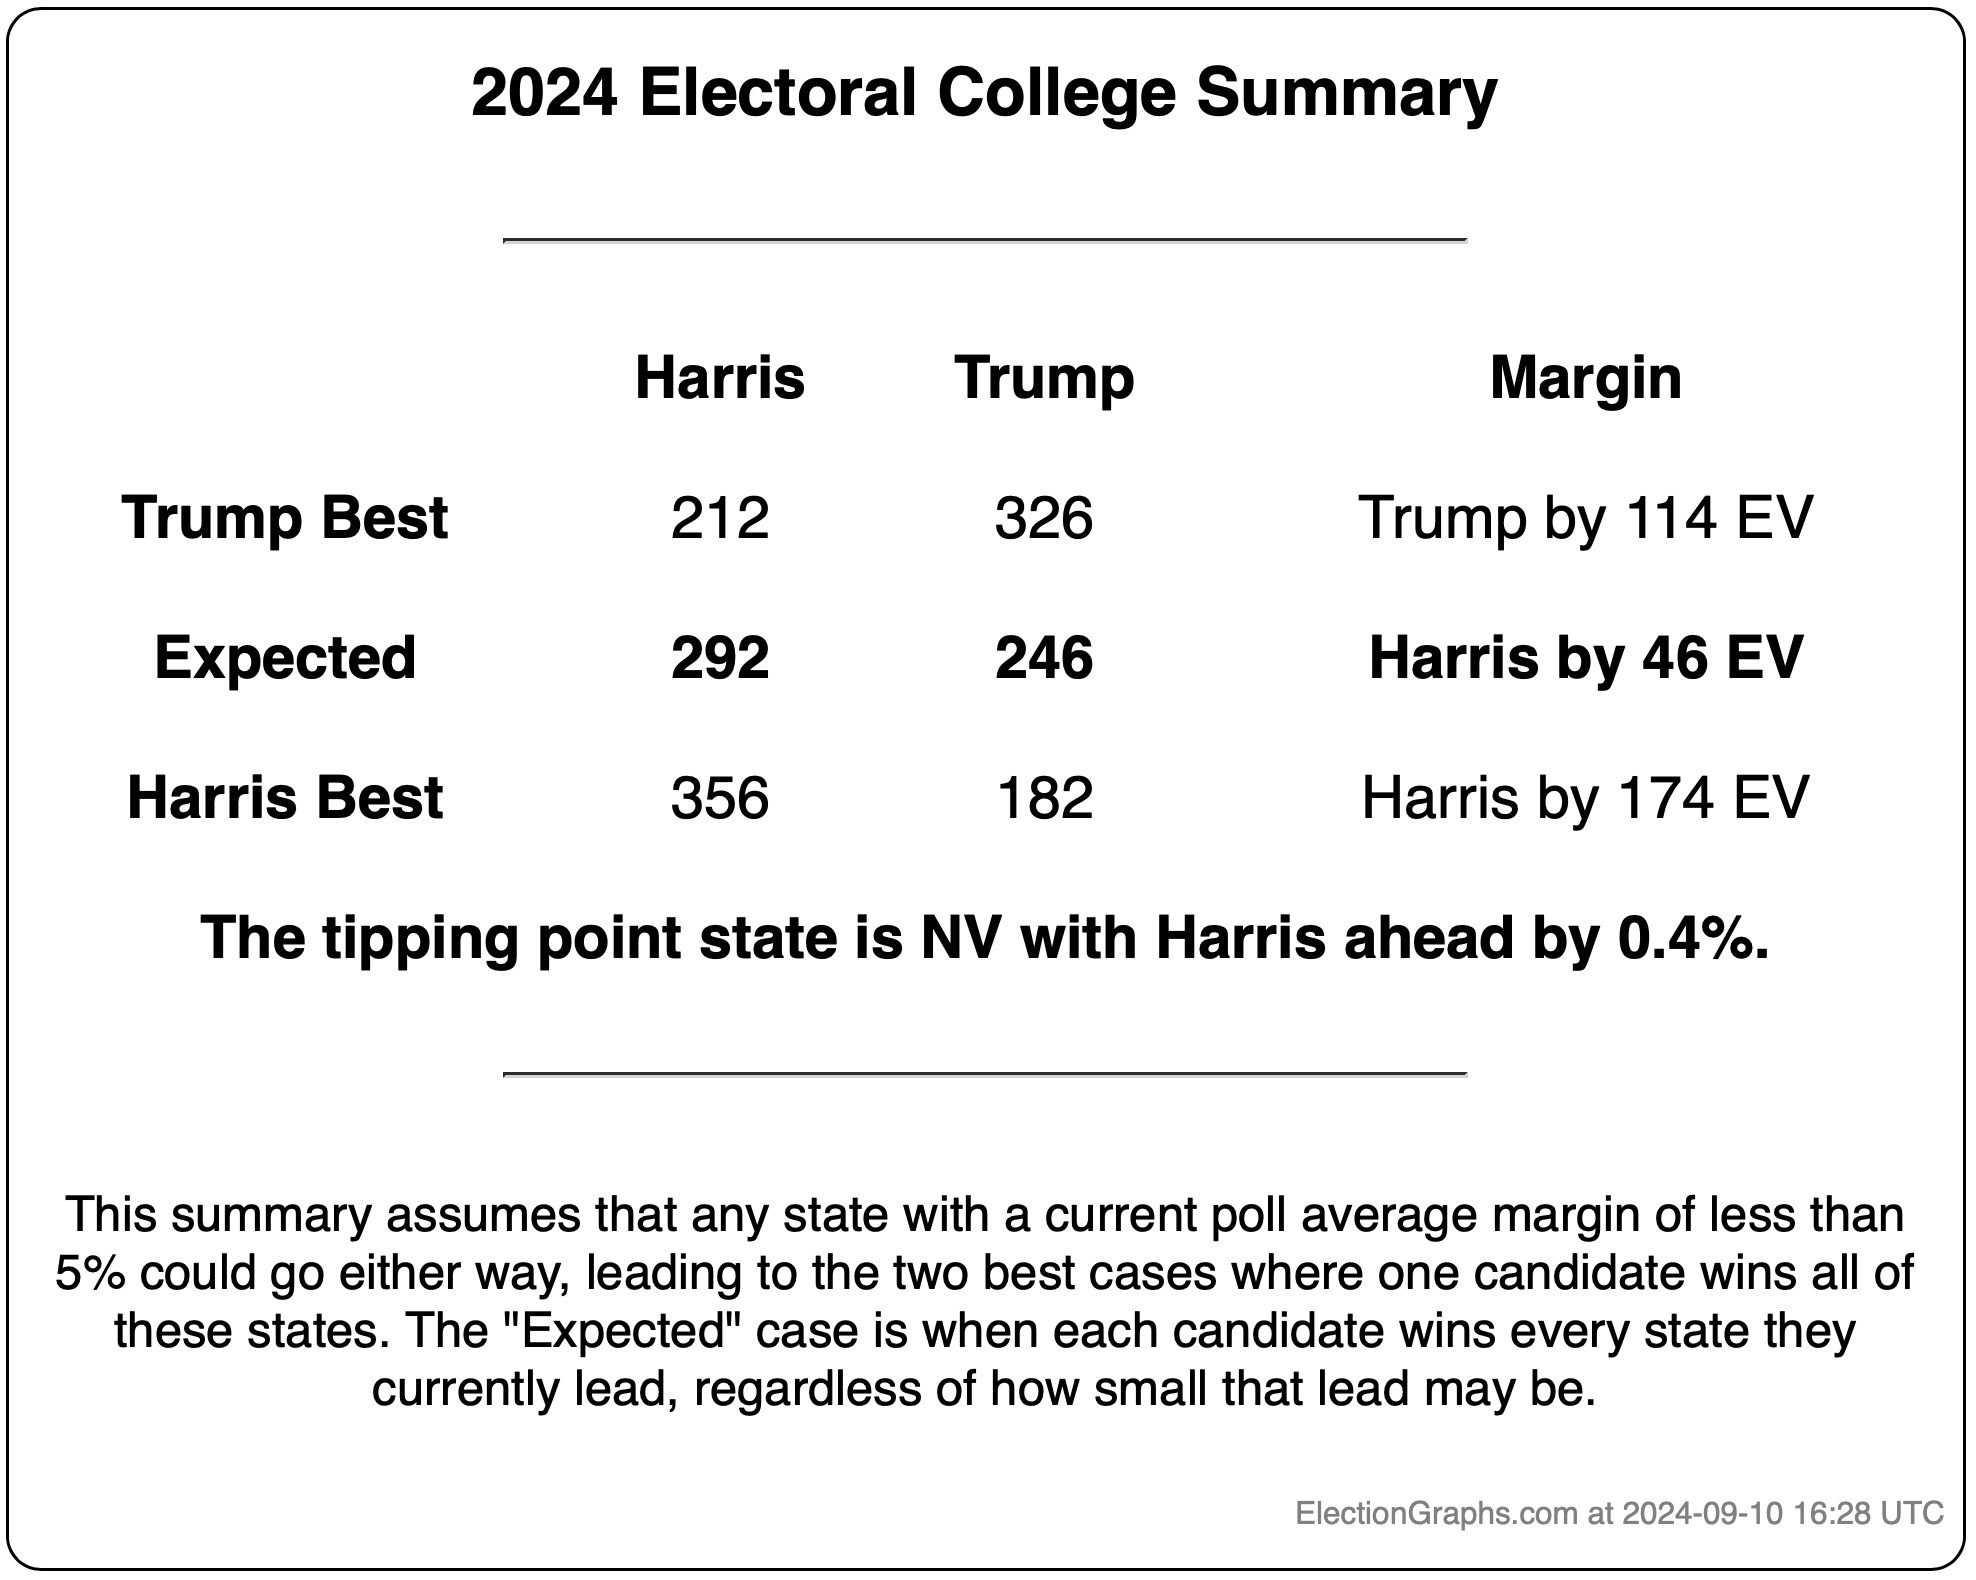
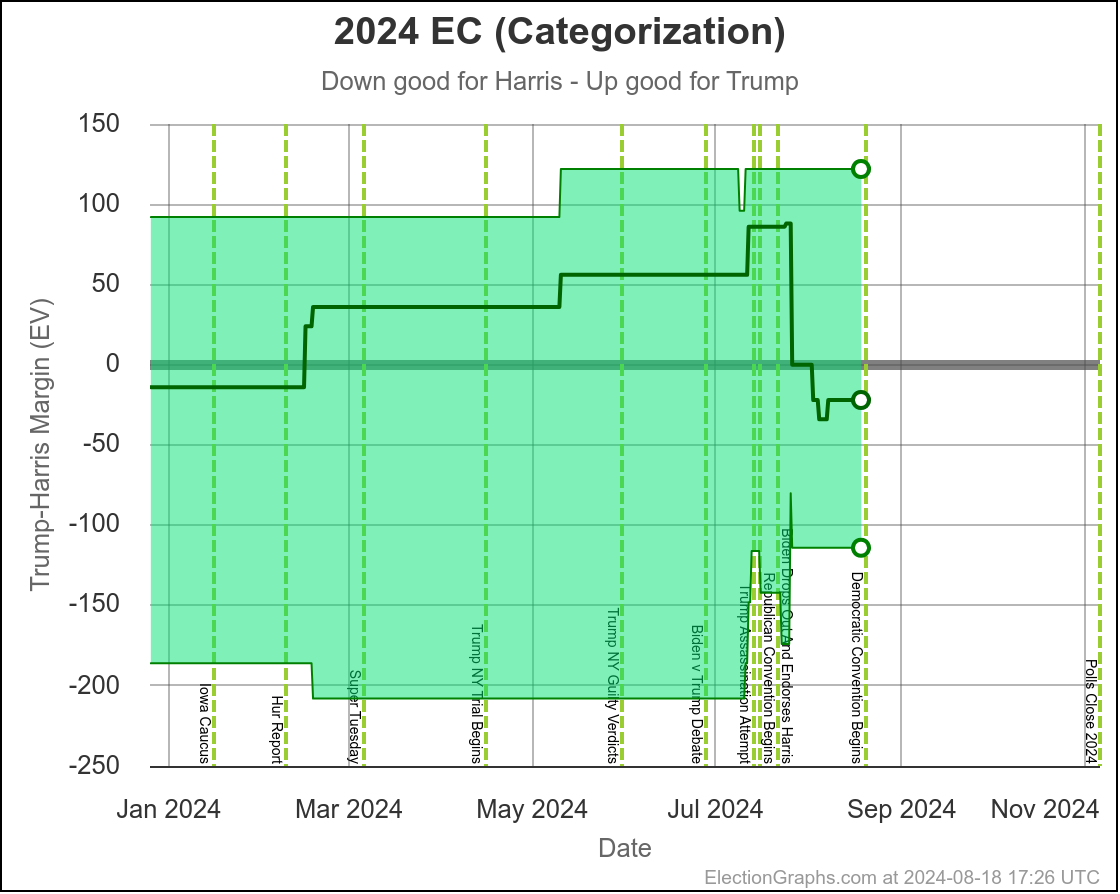
So first of all, this means the "Categorization View" got two states wrong in the end (Wisconsin and Michigan).

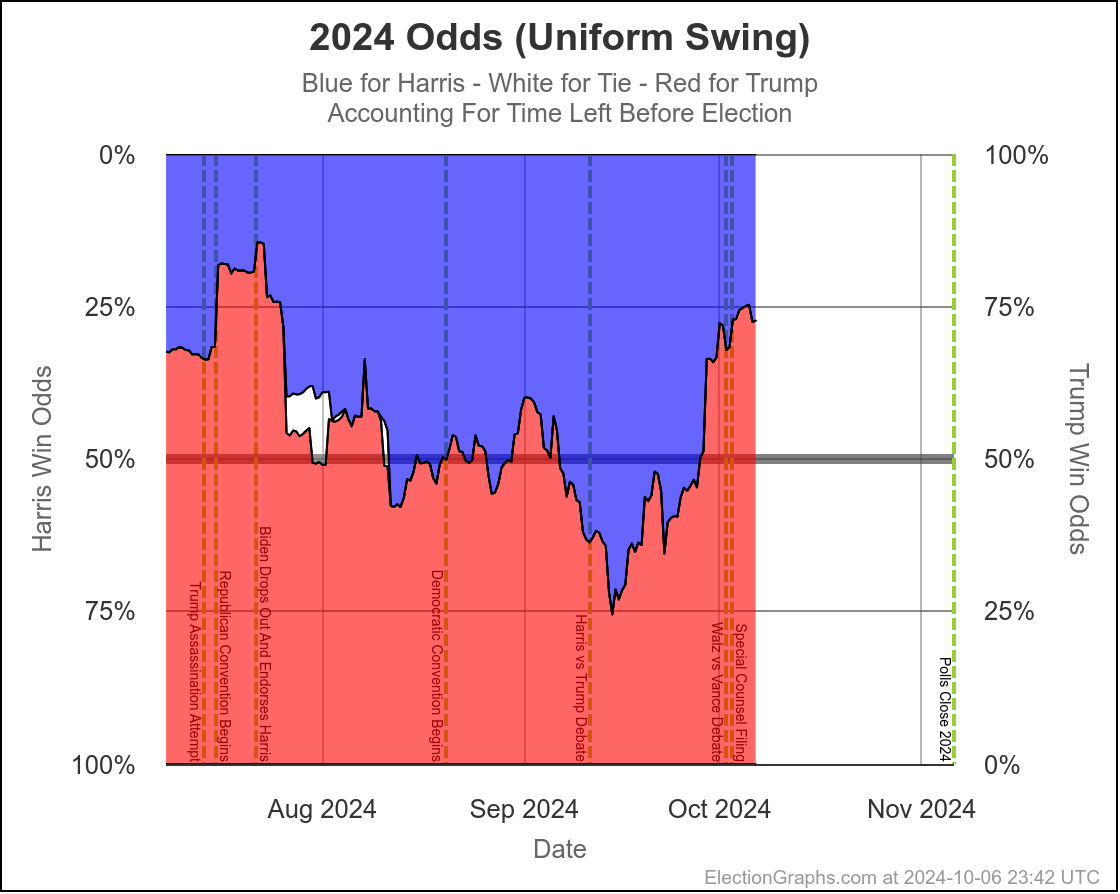
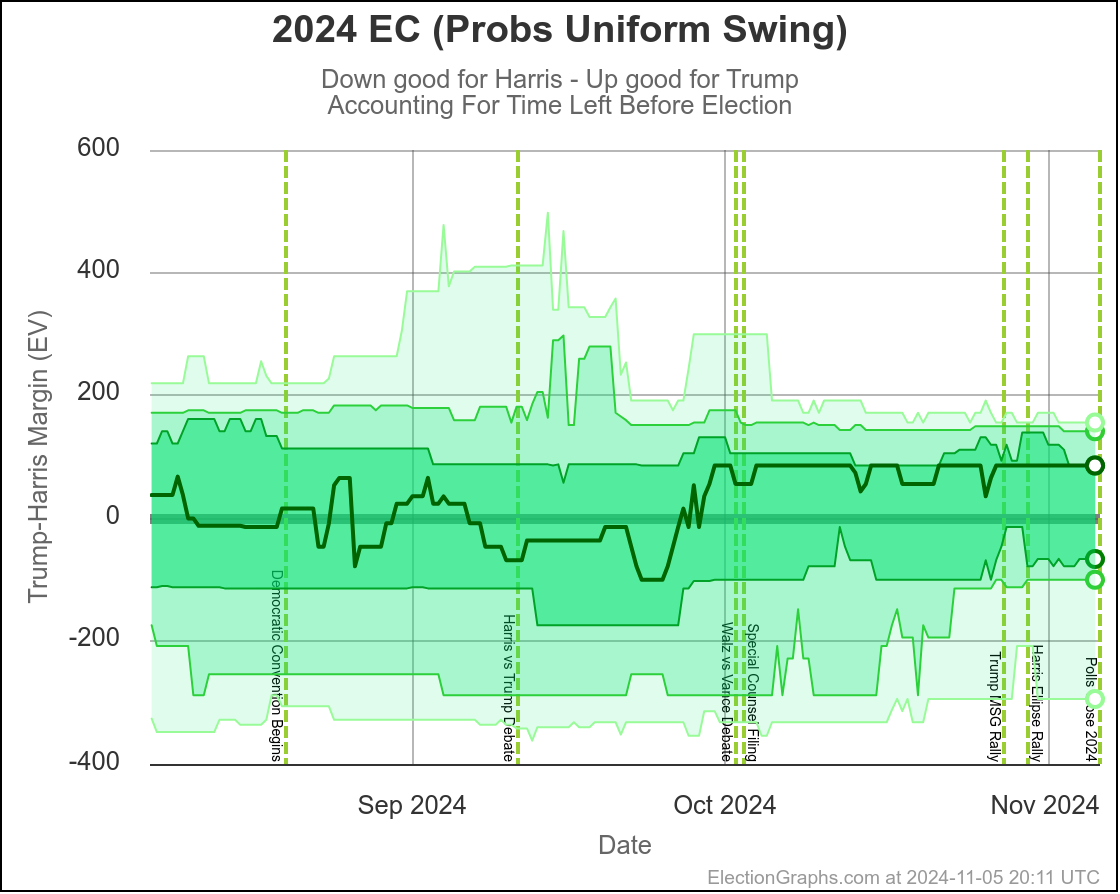
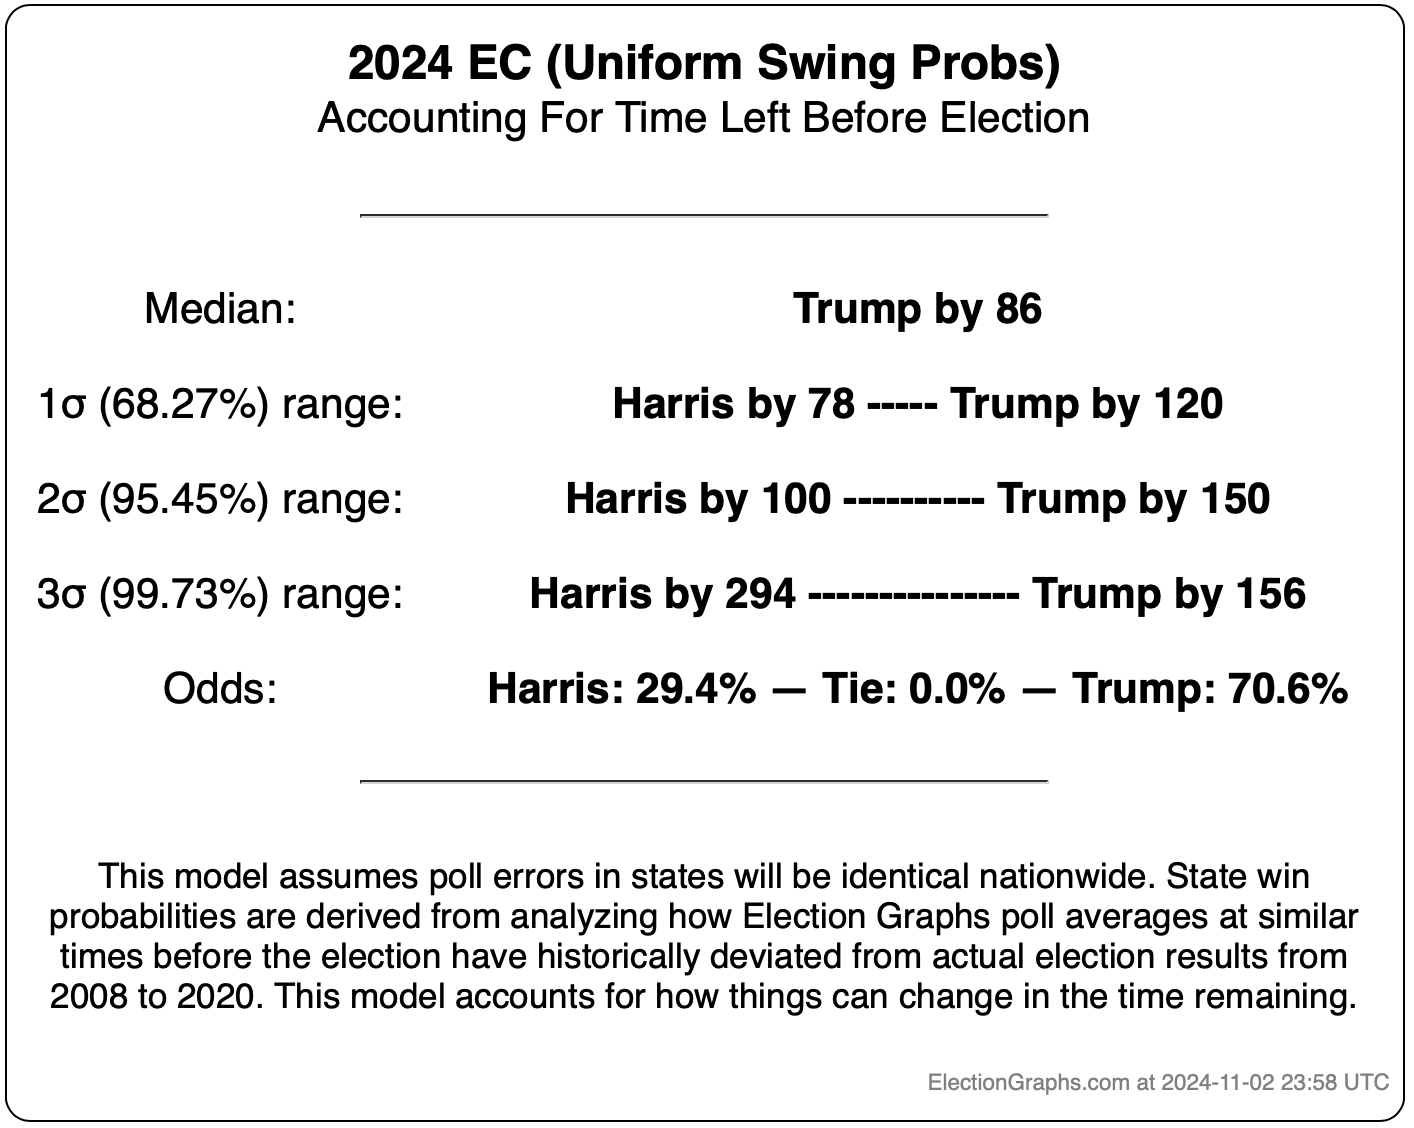
Meanwhile the "Uniform Swing" model showed a median result of Trump winning by 86 electoral votes… which is exactly what happened.

This is the model that took into account the magnitude and direction of poll errors from 2008 to 2020 to estimate what would happen this time.

The essential result in the median case (simplified) was to not count a state as blue unless the Democrat led by more than 1.2%. That turned out to be a good bet, and resulted in a spot on prediction.

So I would say Election Graphs did pretty well this cycle.

I thought it was worth taking a first look at how the EG poll averages did vs reality in terms of state by state margin differences too. The preliminary actuals are from DDHQ as of 17 UTC on Nov 7th.

For the moment I'm only looking at the states (and ME-2 and NE-2) where the EG margin was under 10%.

Here is the data:

Final EG Avg Prelim Actual Delta
Nebraska-CD2 Harris+8.9% Harris+7.8% Trump+1.1%
New Hampshire Harris+7.8% Harris+3.6% Trump+4.2%
Virginia Harris+6.1% Harris+5.2% Trump+0.9%
New Mexico Harris+5.8% Harris+5.7% Trump+0.1%
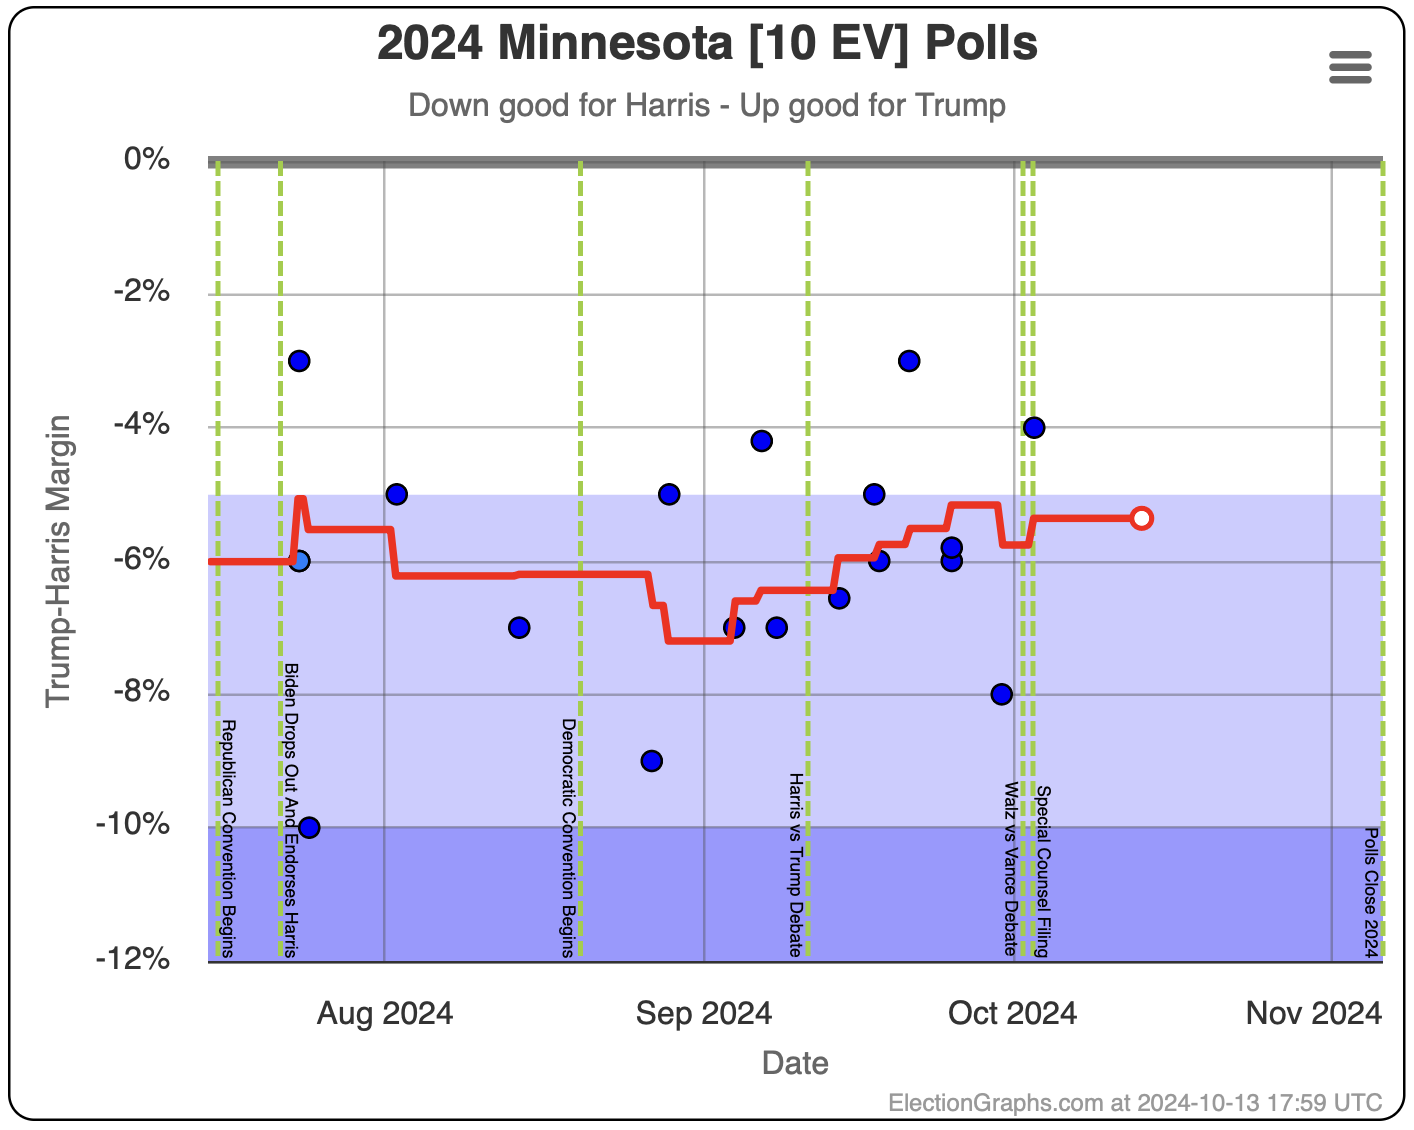
Minnesota Harris+5.3% Harris+4.3% Trump+1.0%
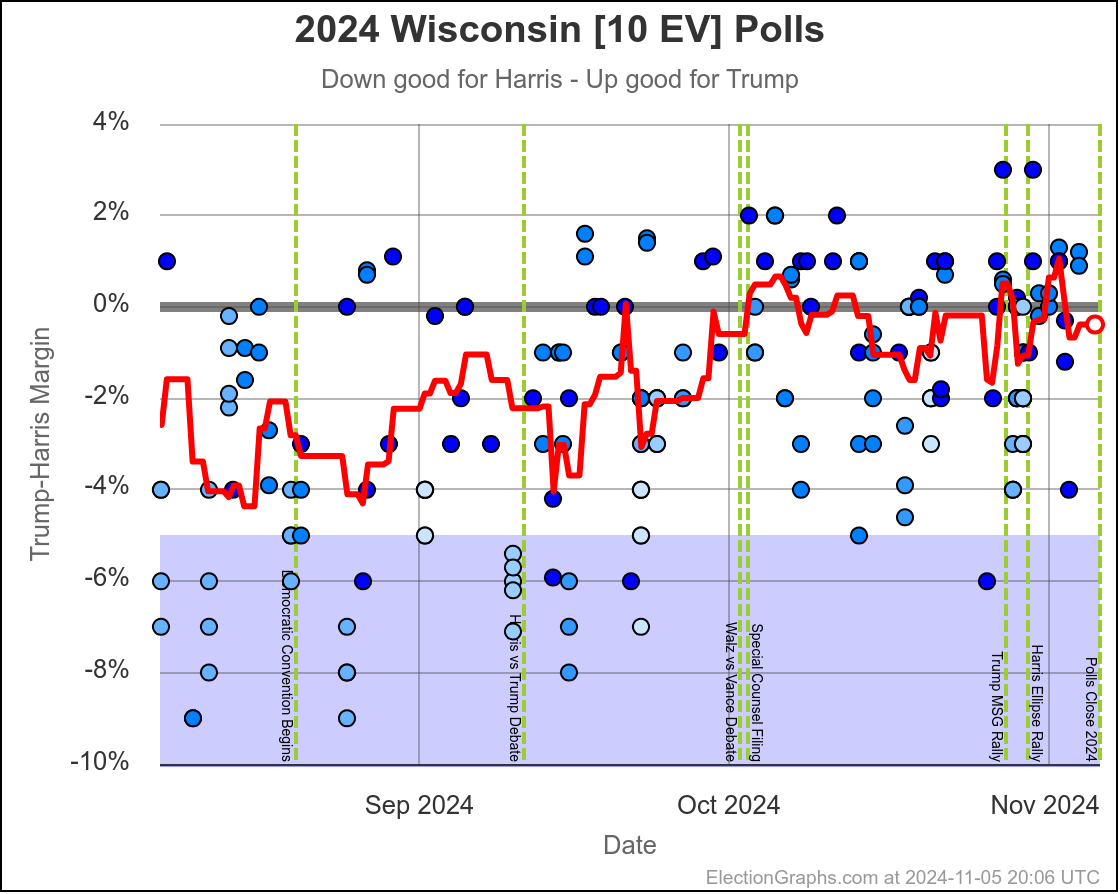
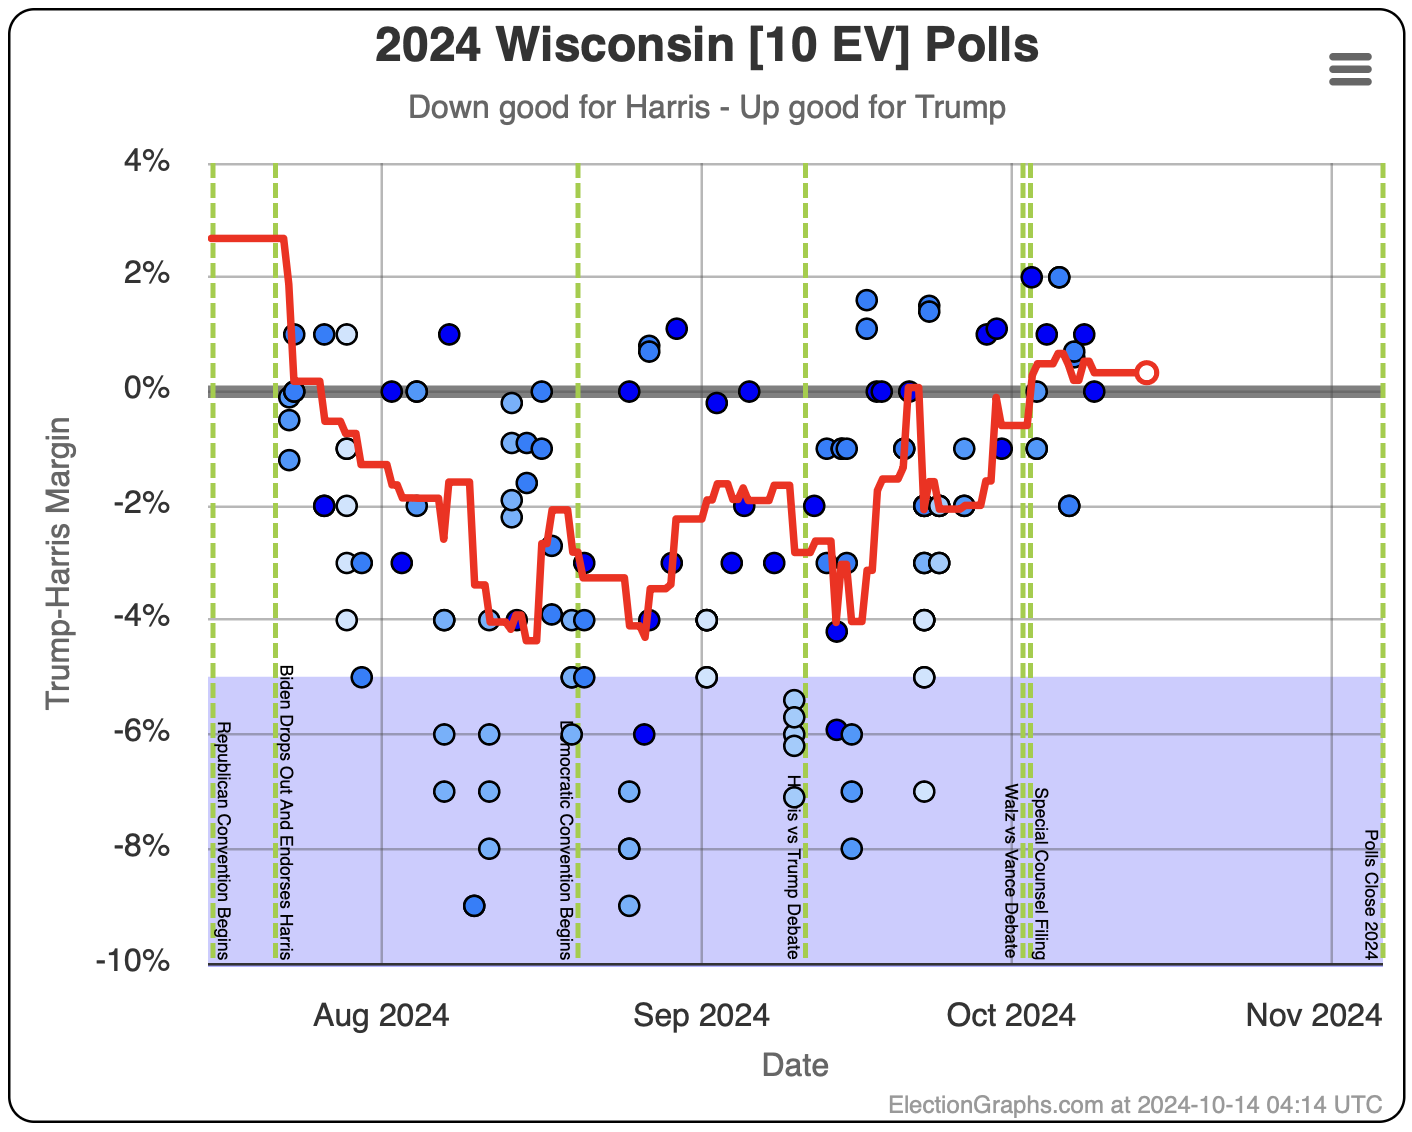
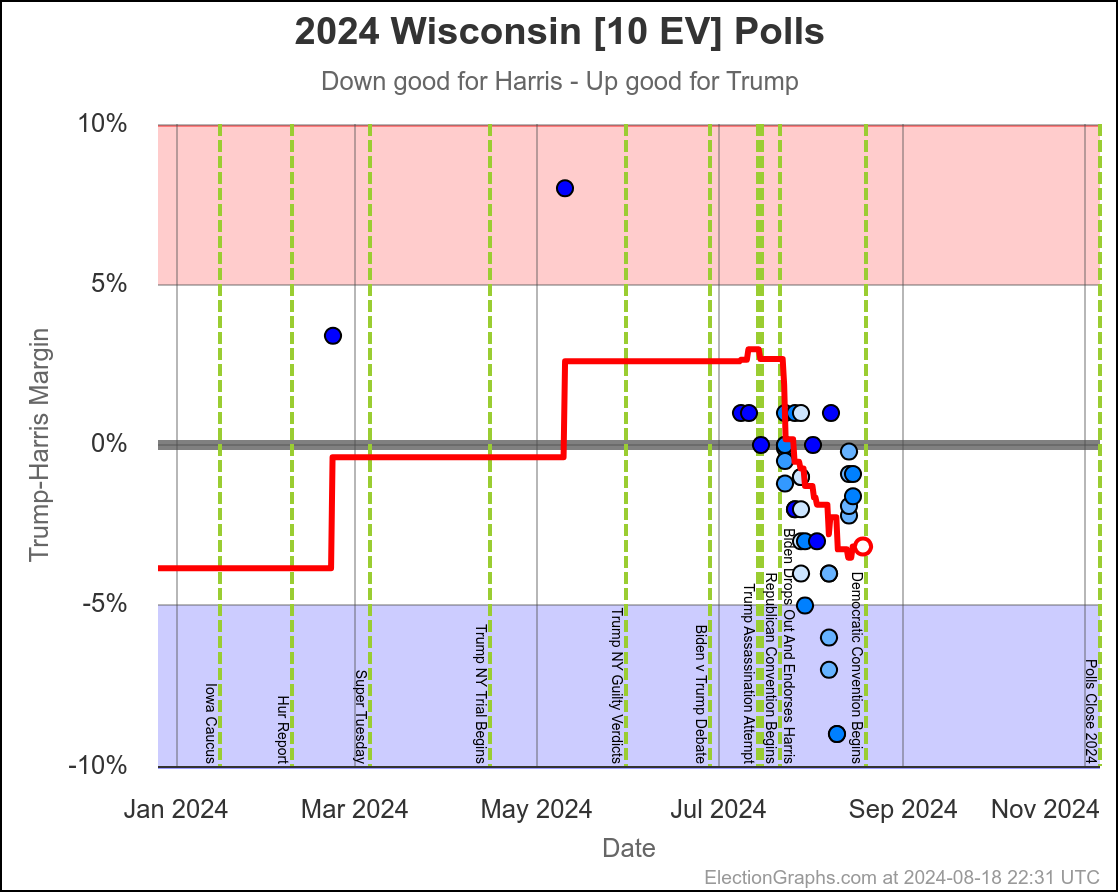
Wisconsin Harris+0.4% Trump+1.0% Trump+1.4%
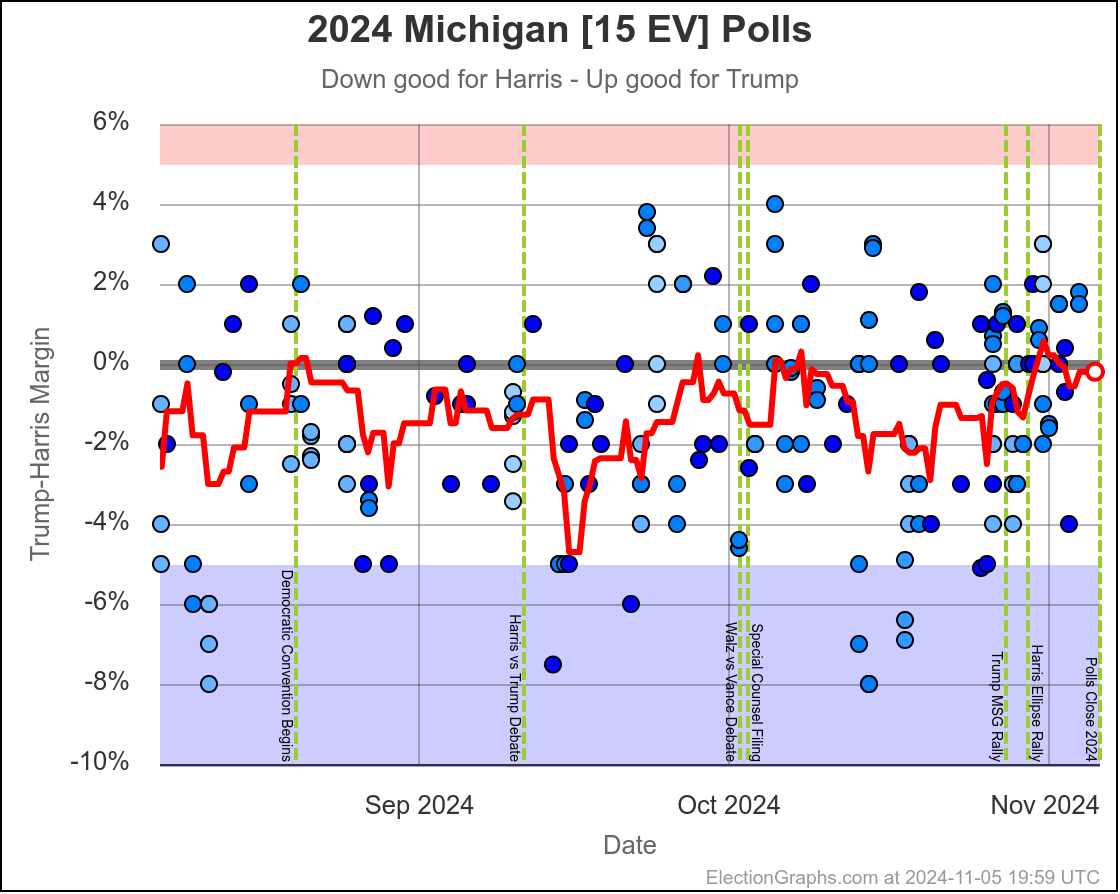
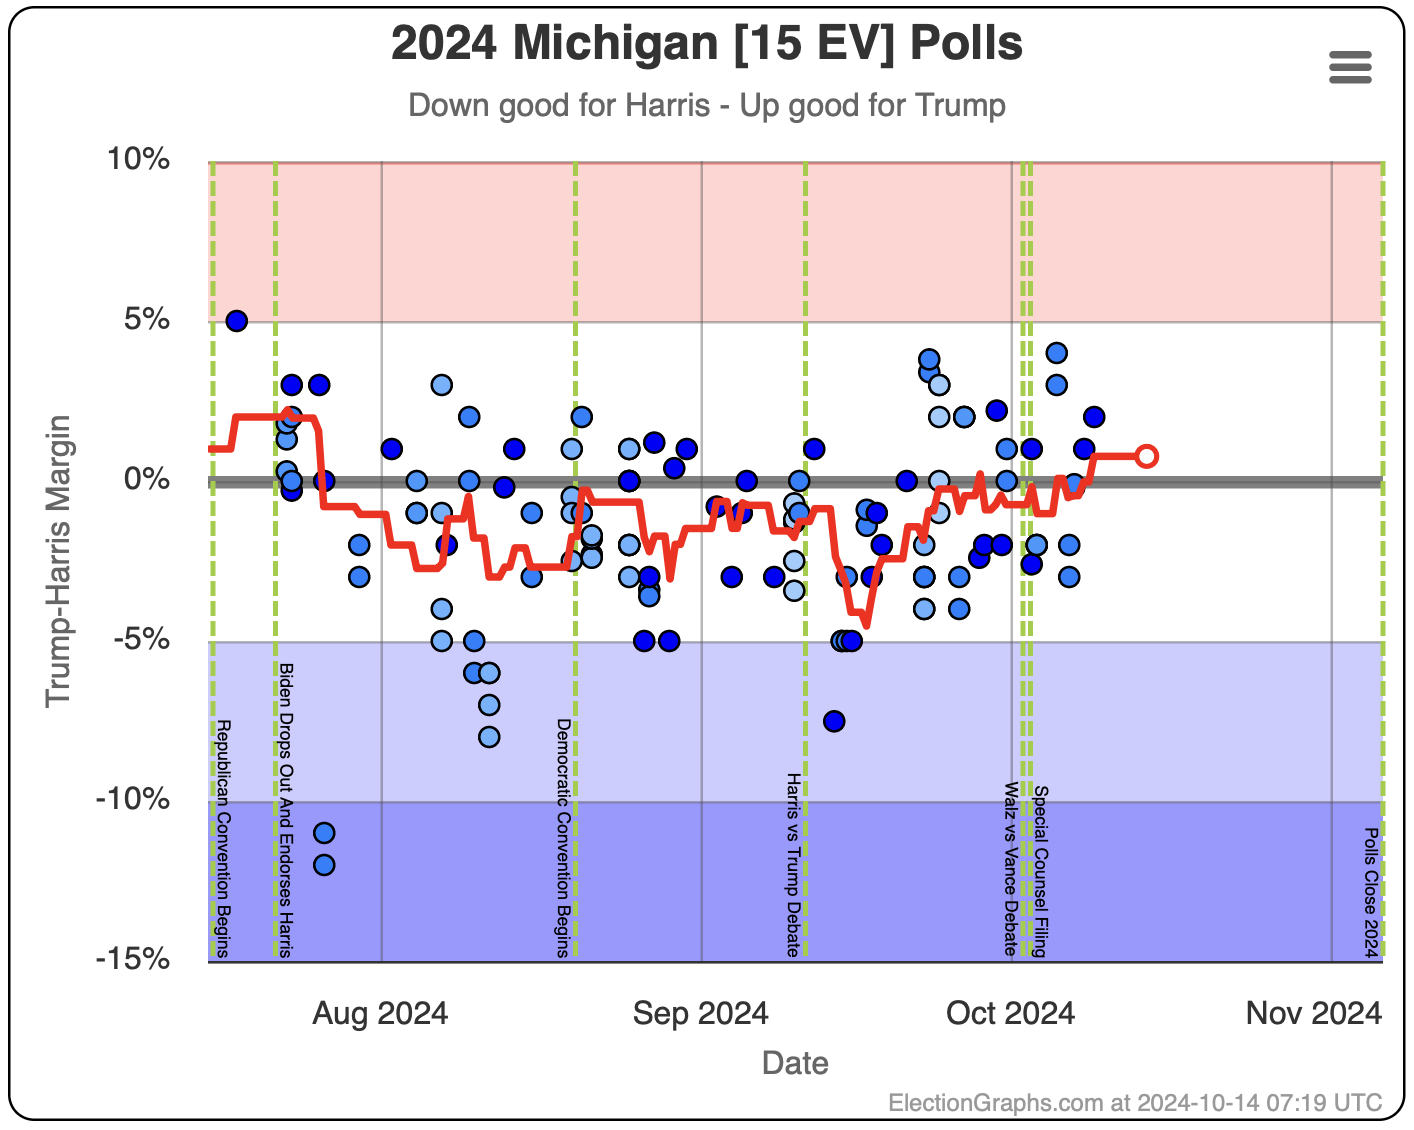
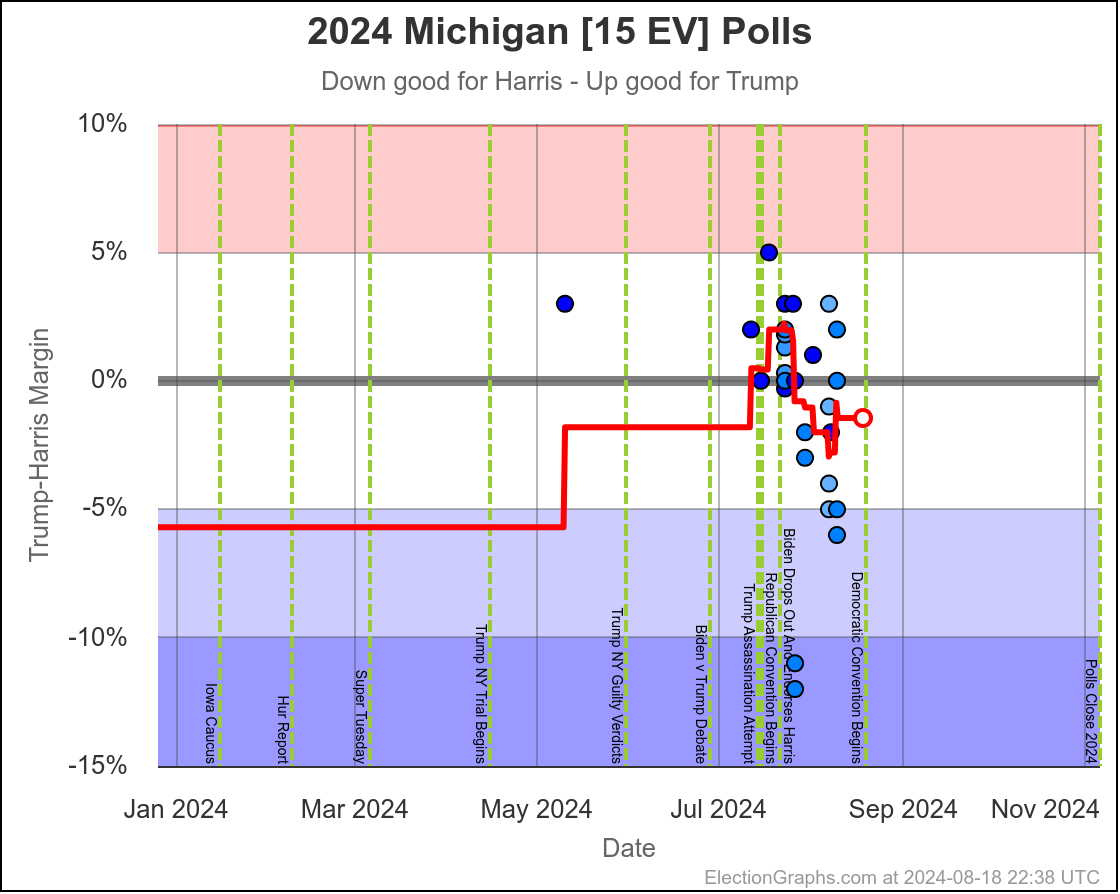
Michigan Harris+0.2% Trump+1.5% Trump+1.7%
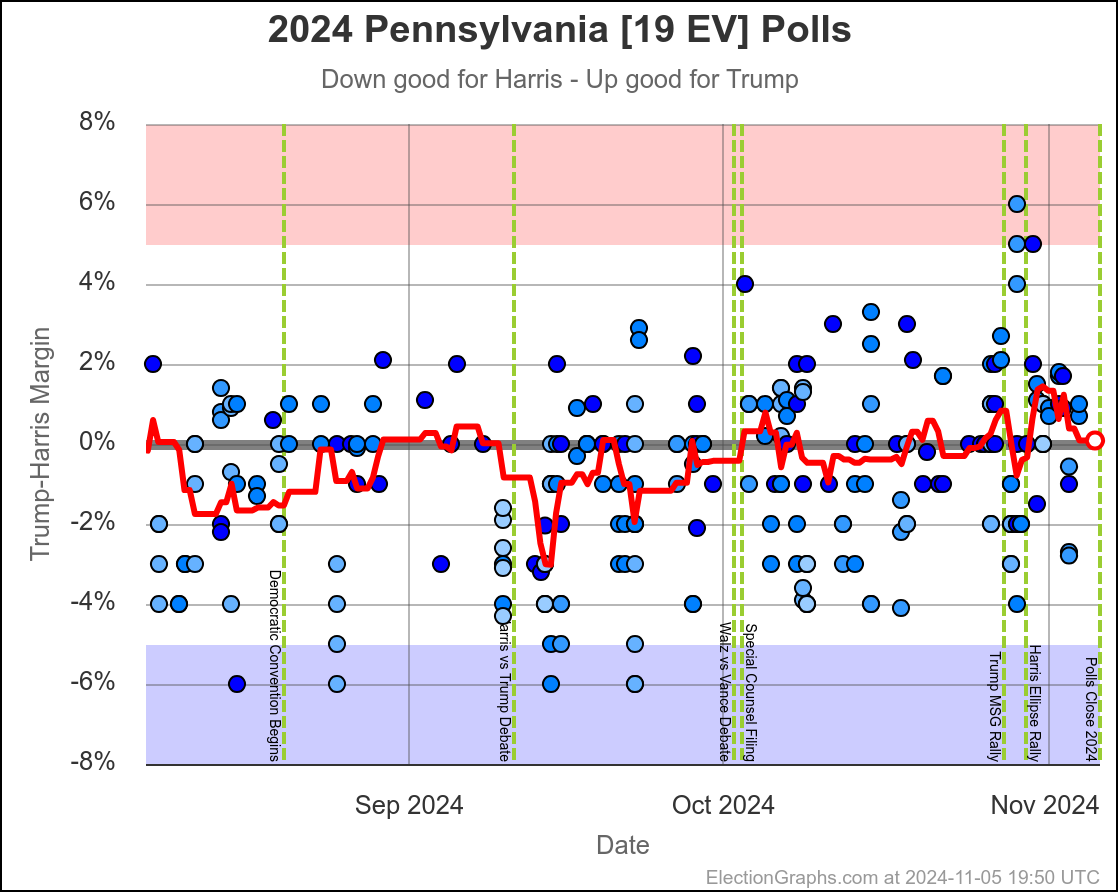
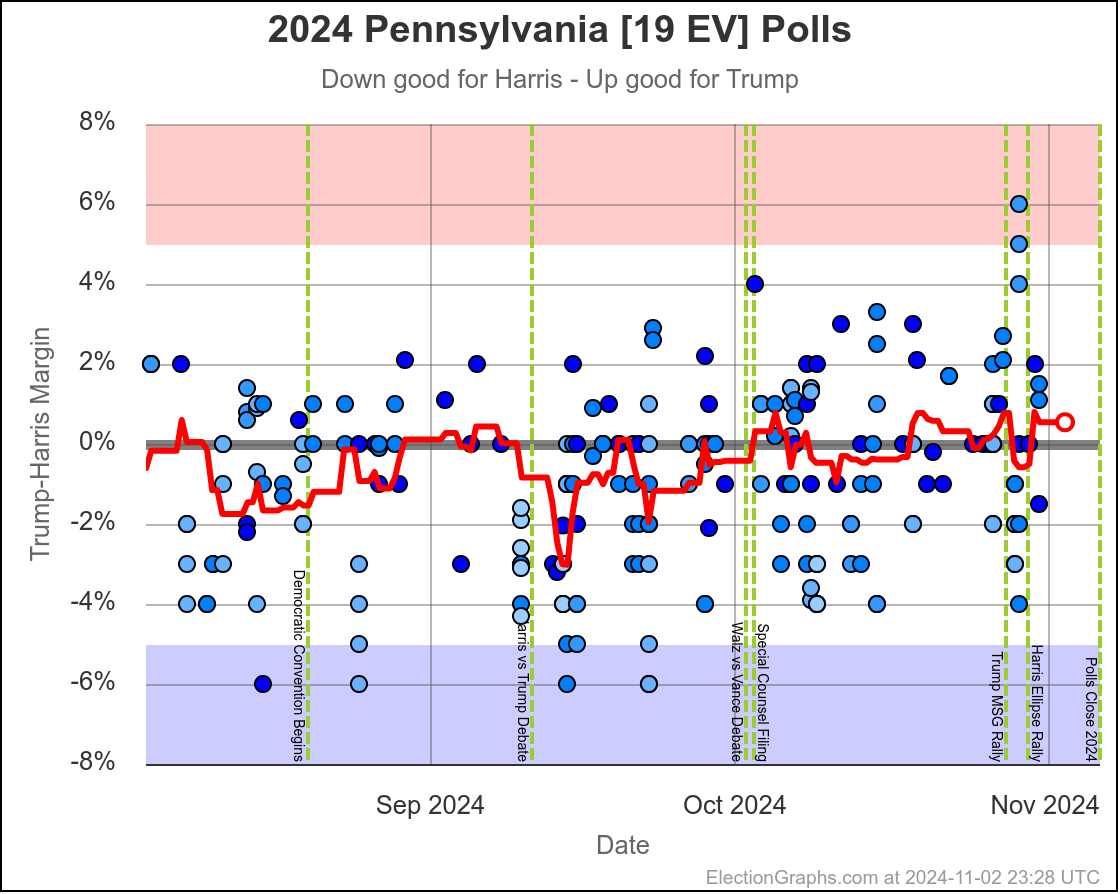
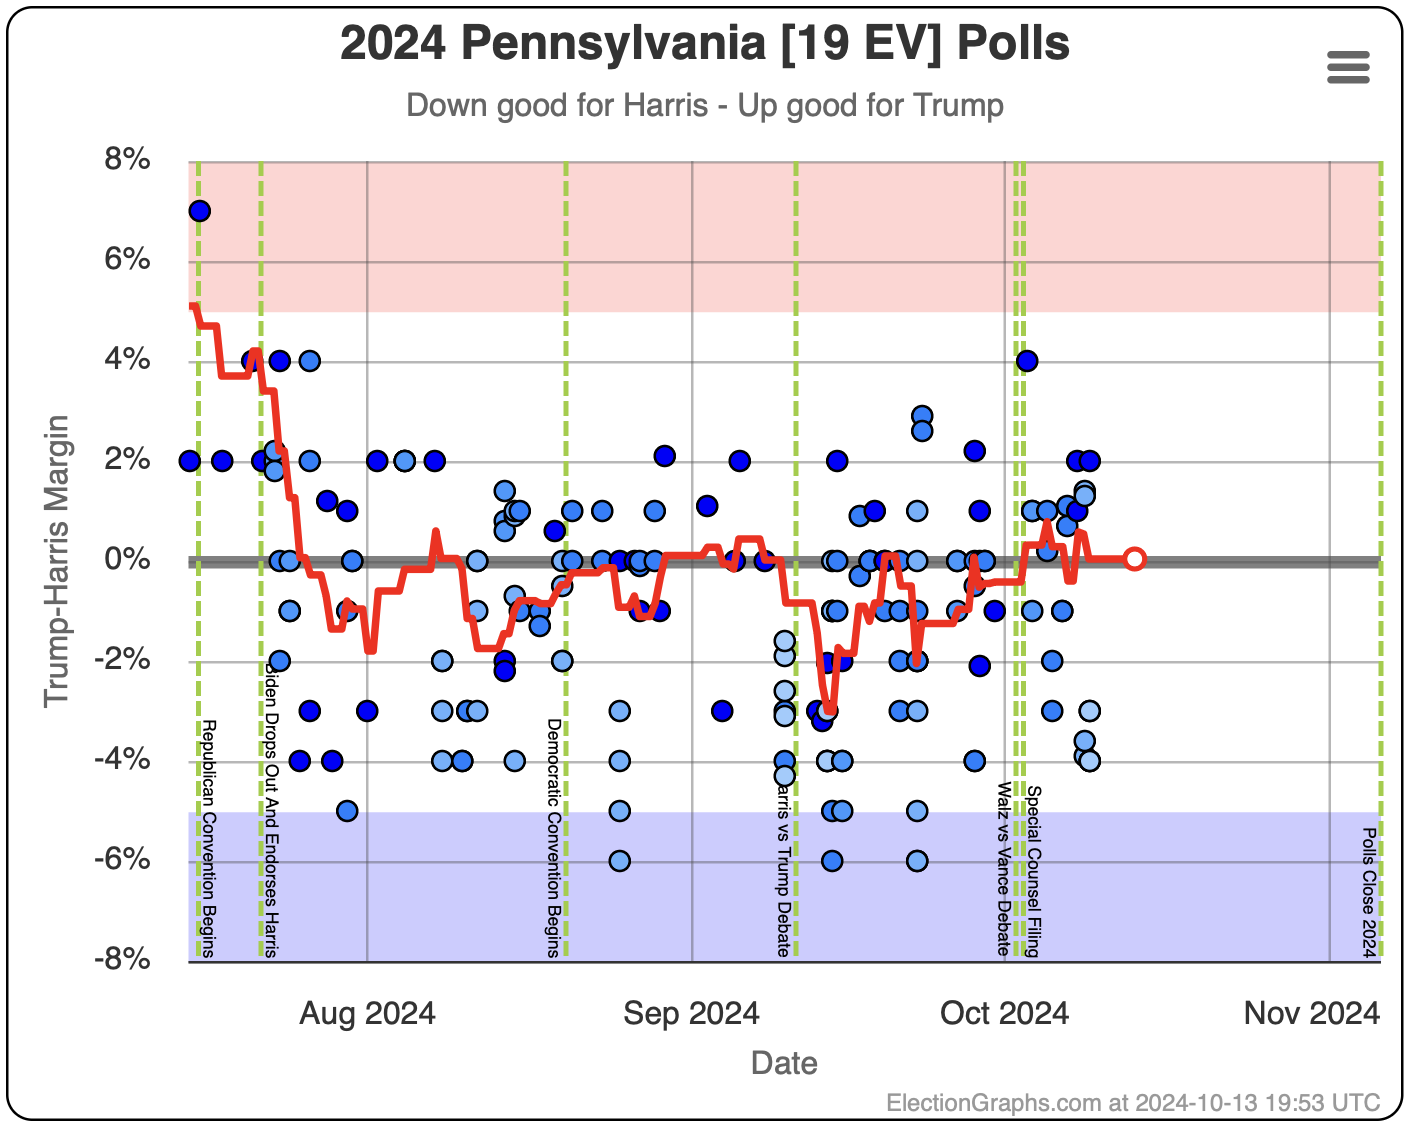
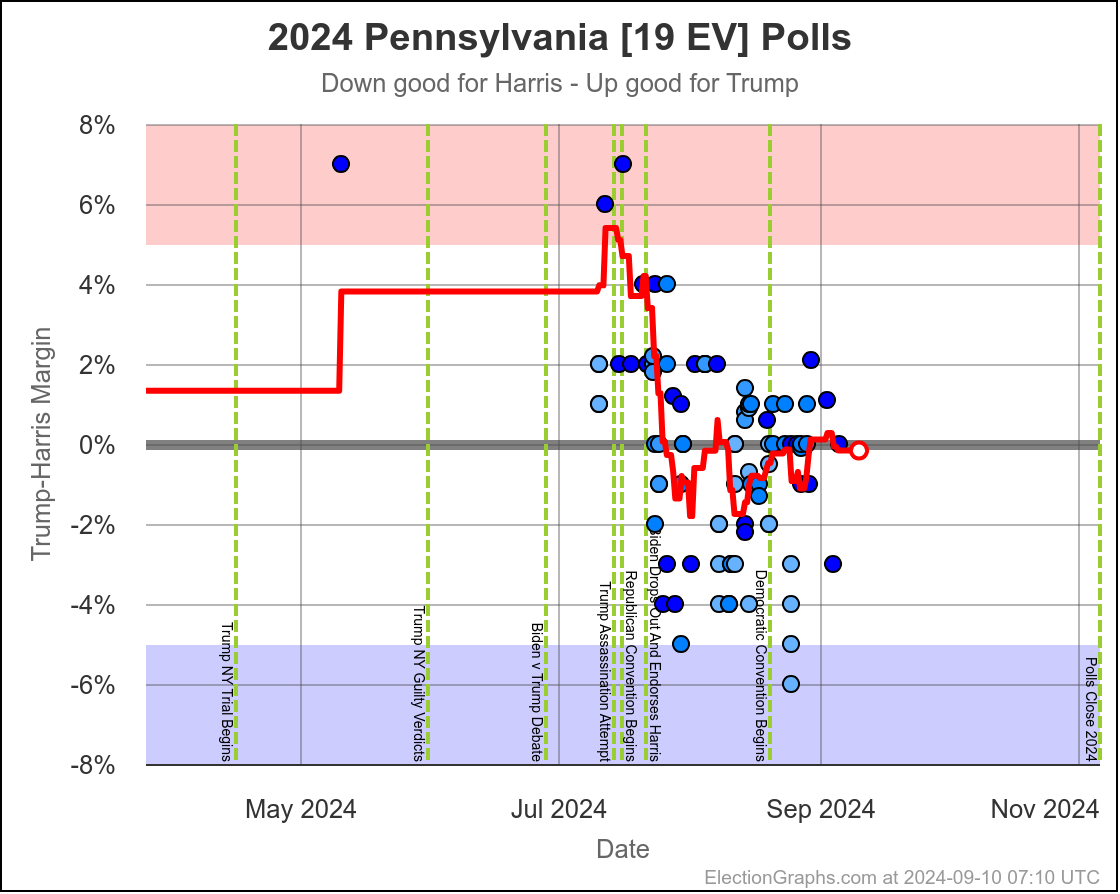
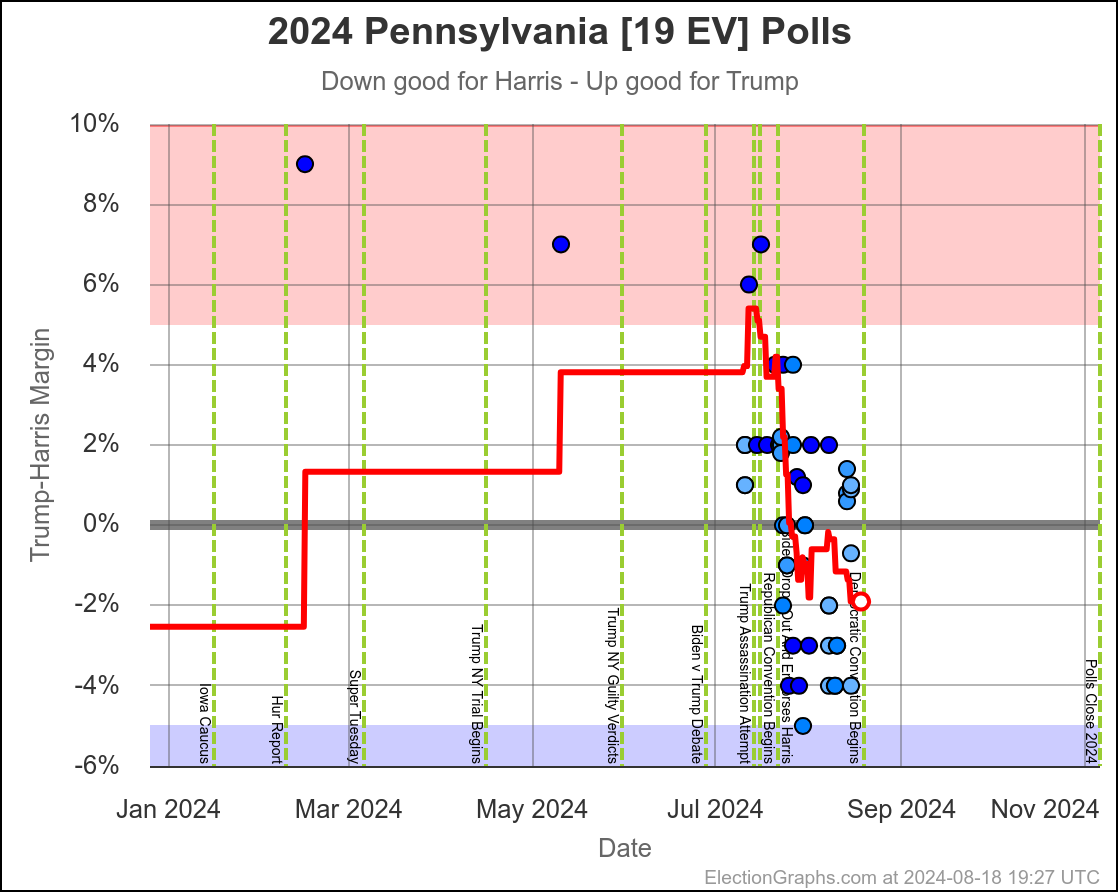
Pennsylvania Trump+0.1% Trump+2.0% Trump+1.9%
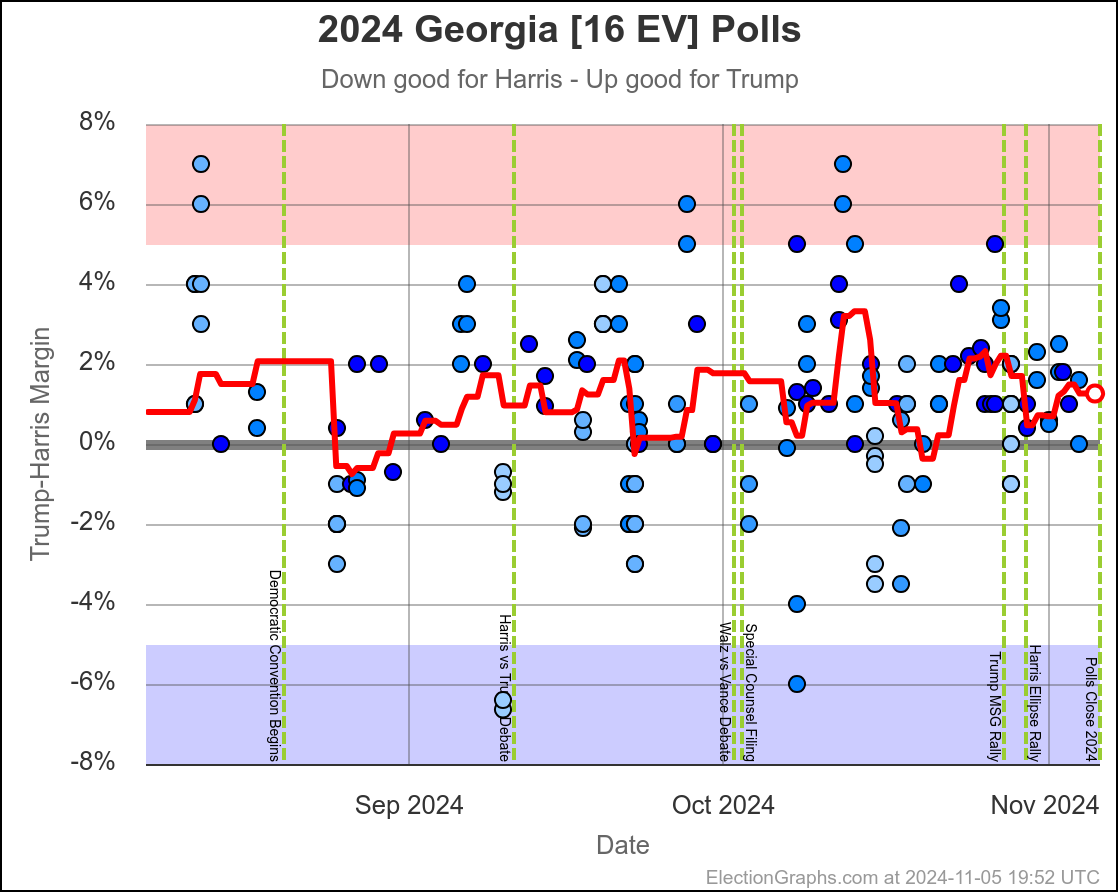
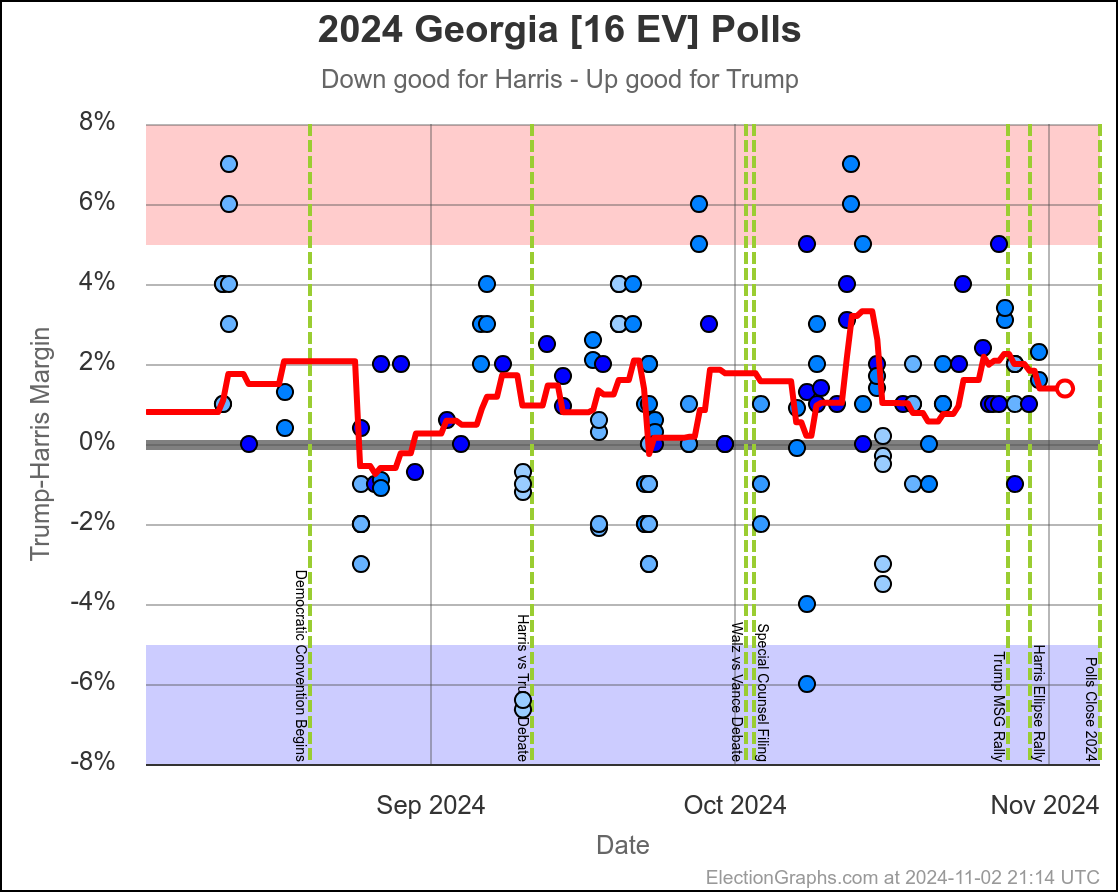
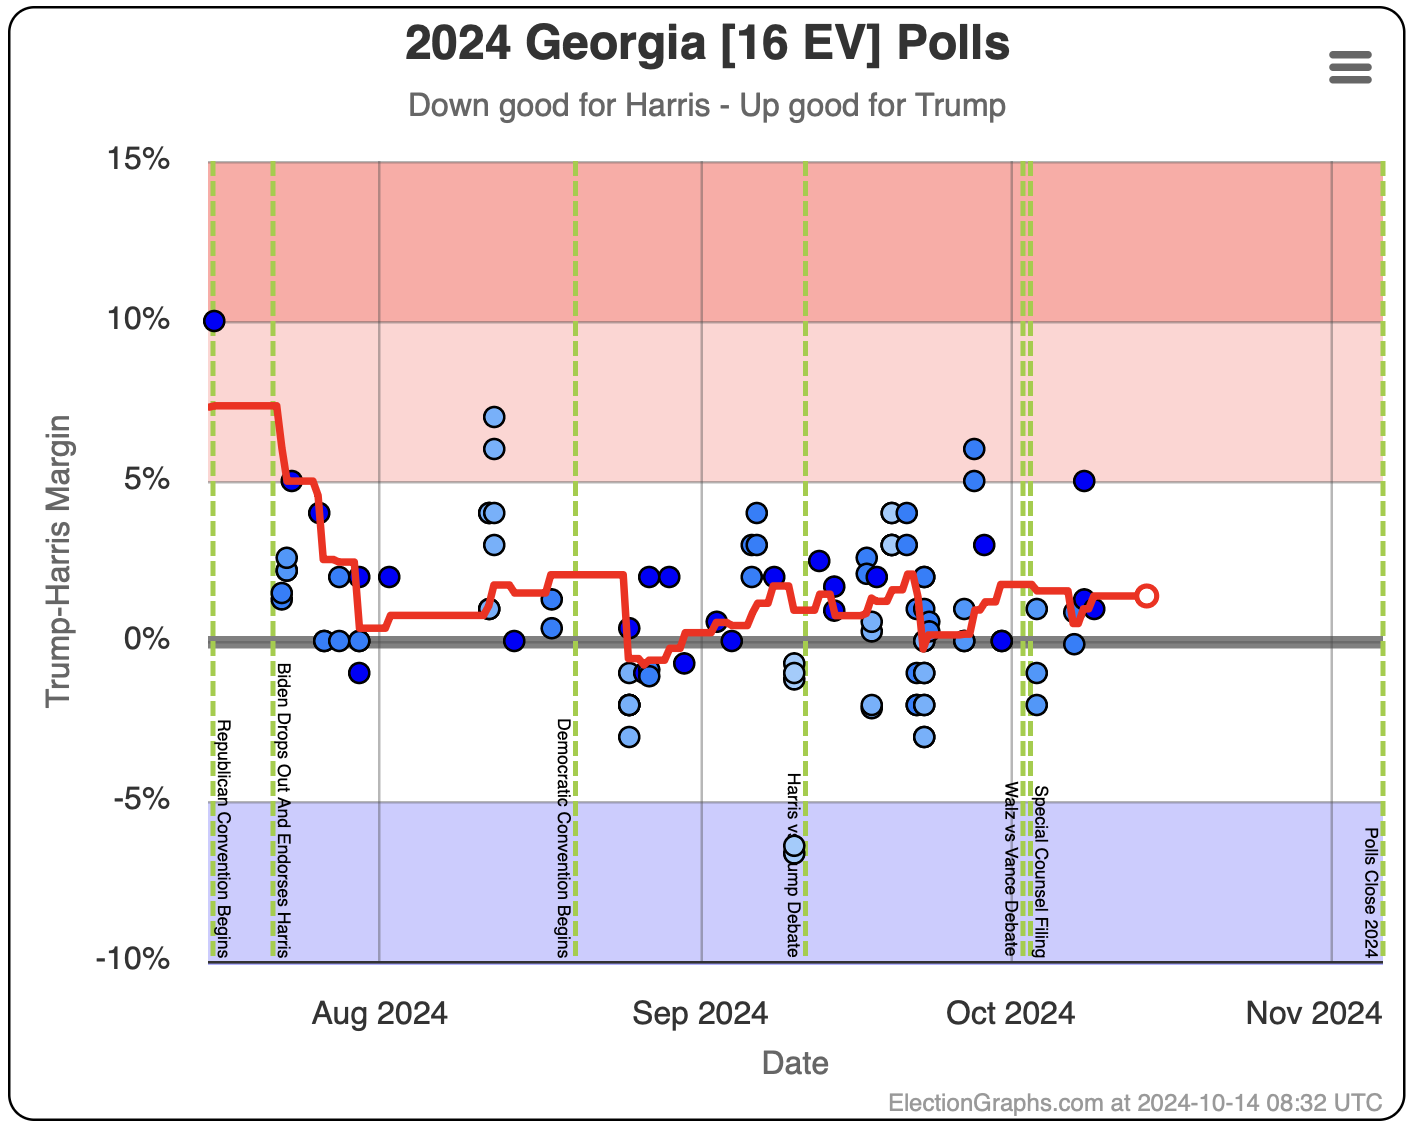
Georgia Trump+1.3% Trump+2.2% Trump+0.9%
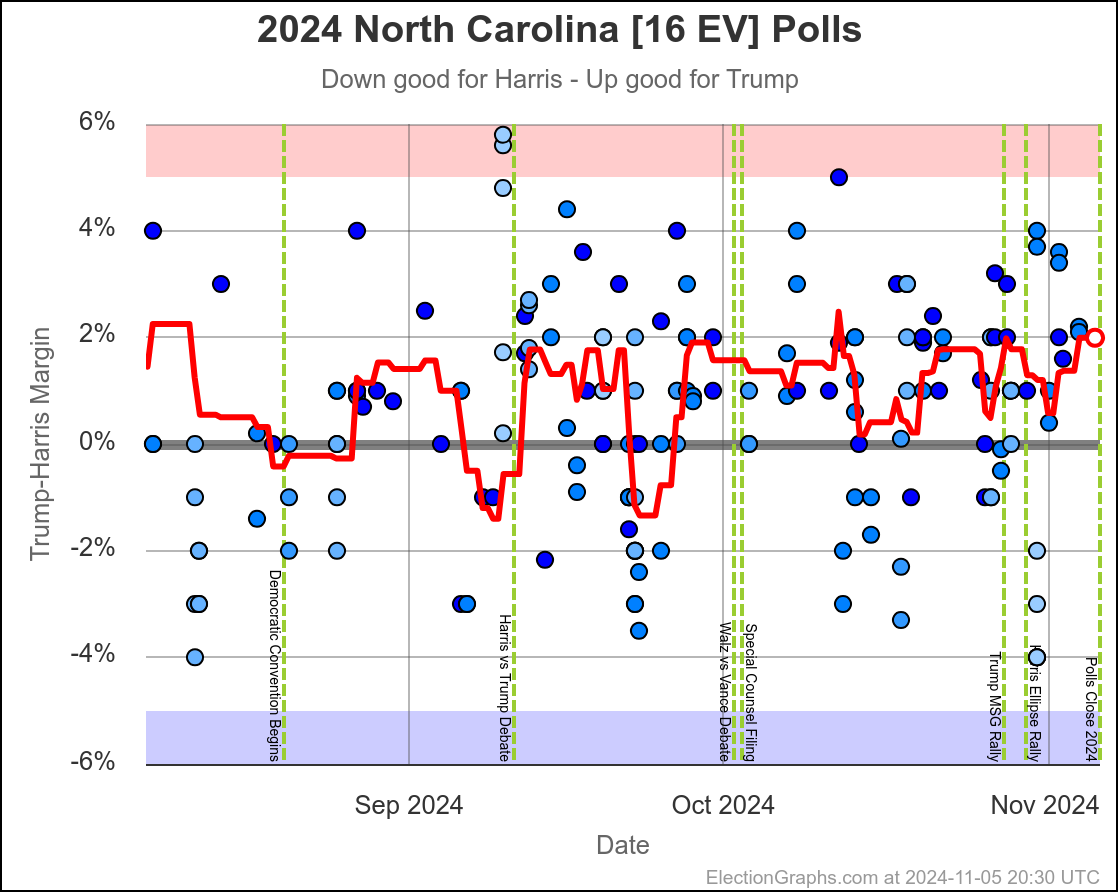
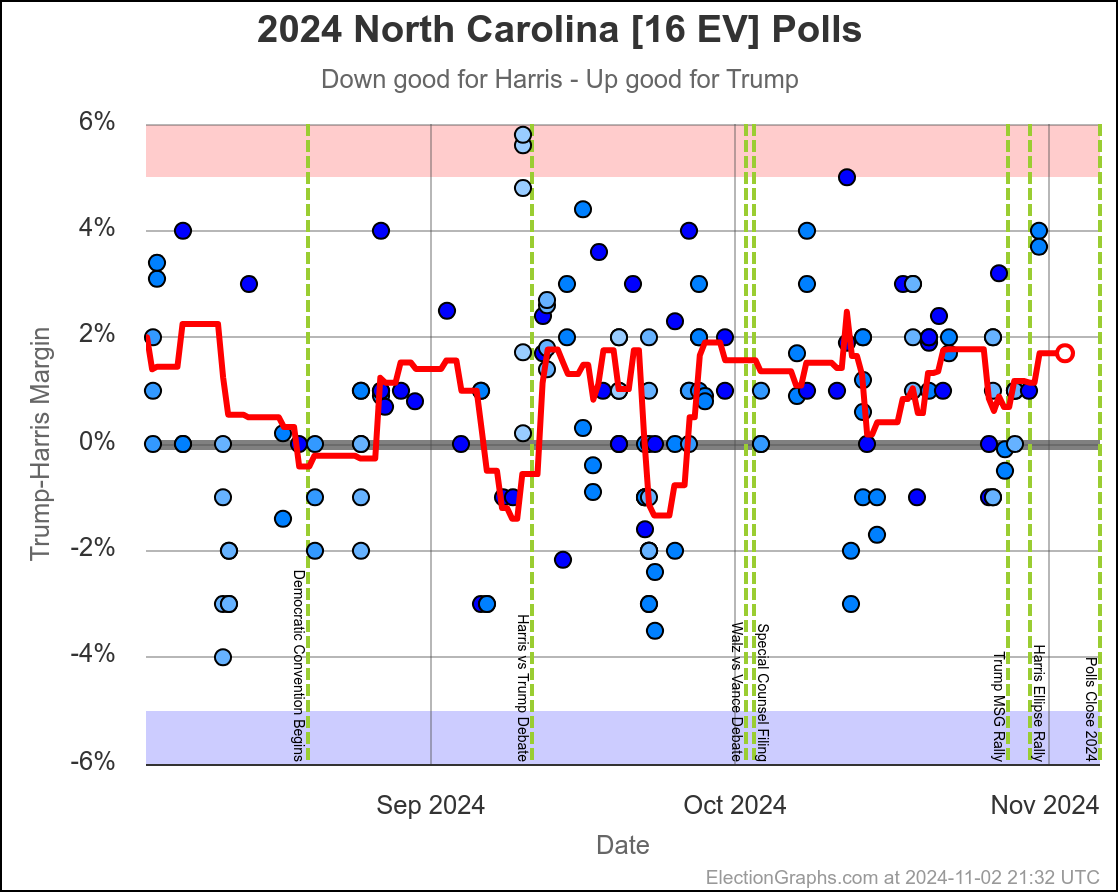
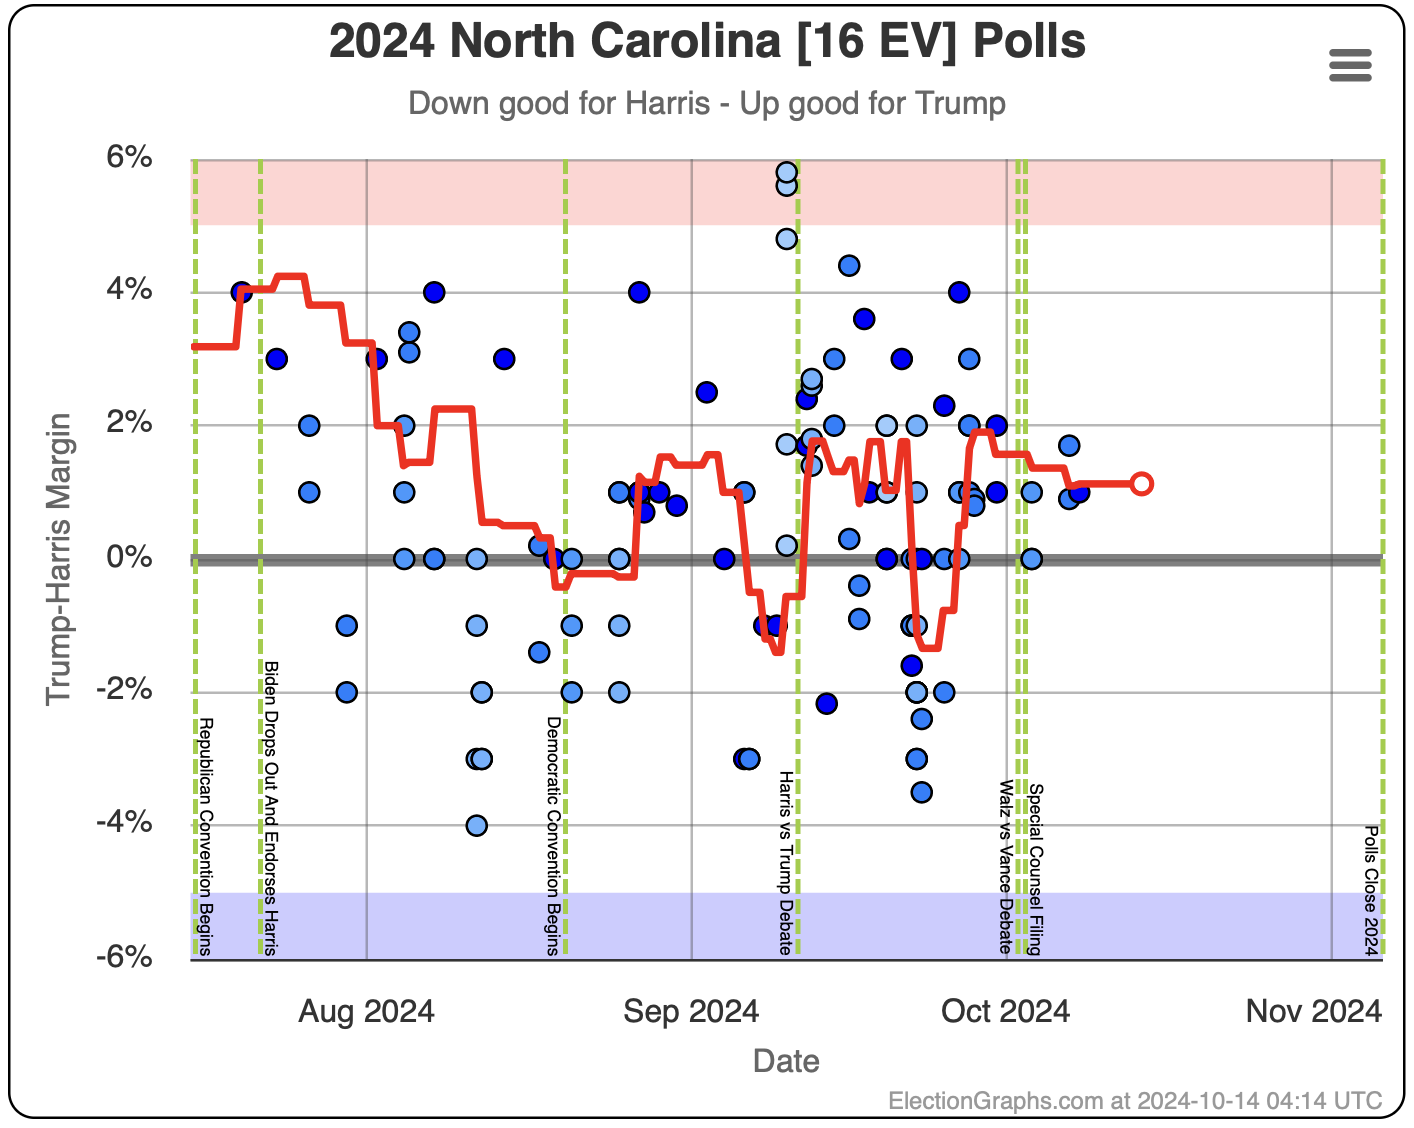
North Carolina Trump+2.0% Trump+3.4% Trump+1.4%
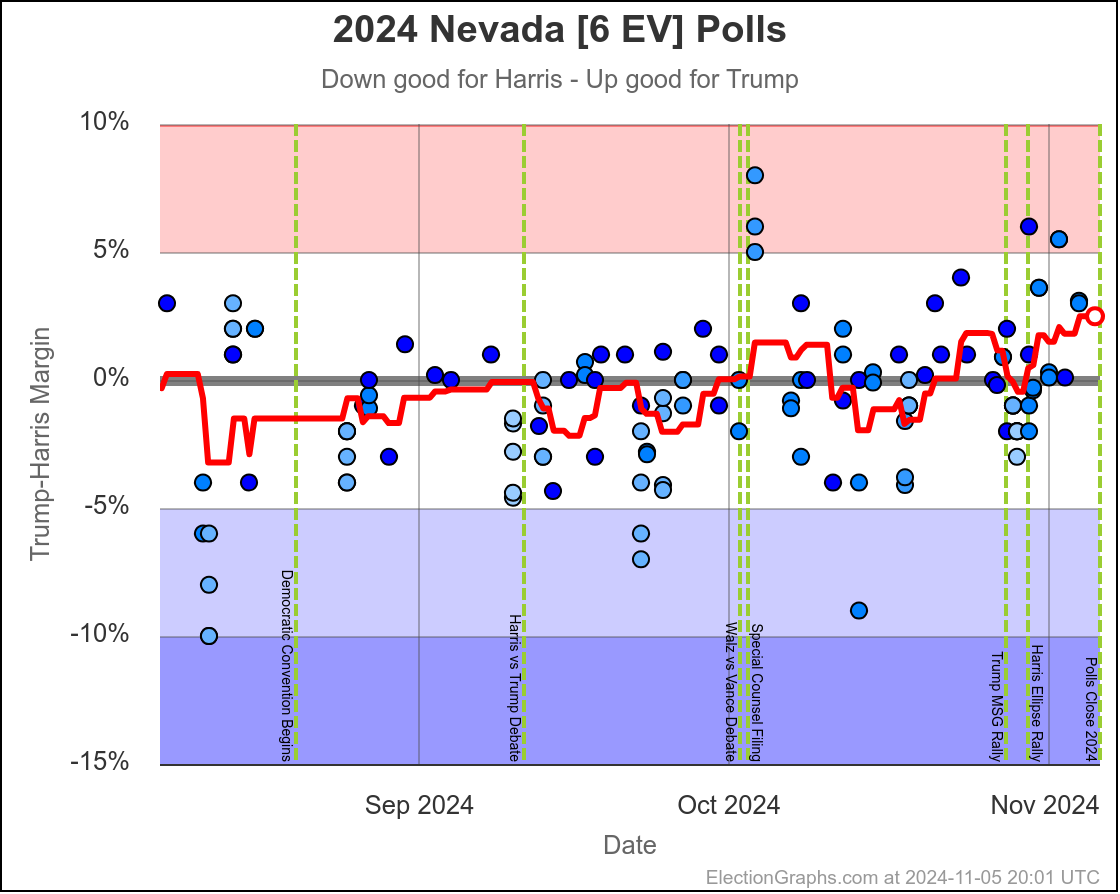
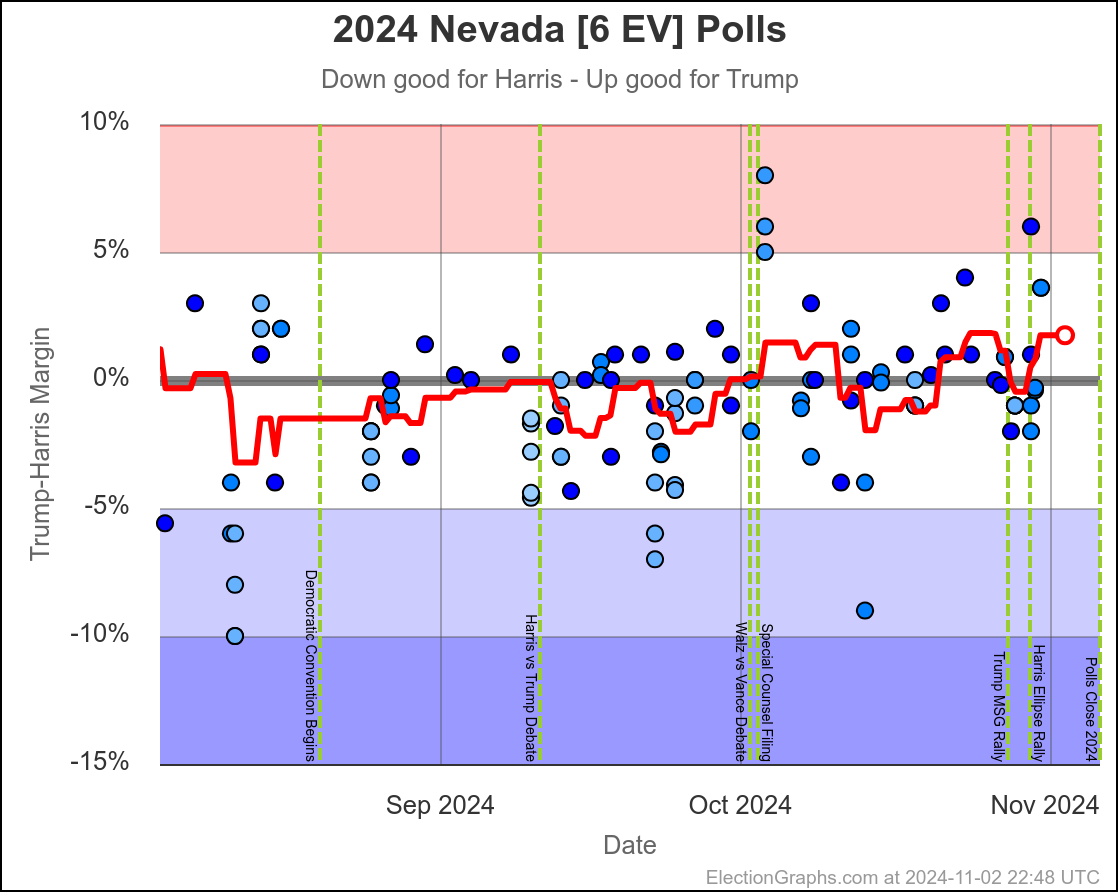
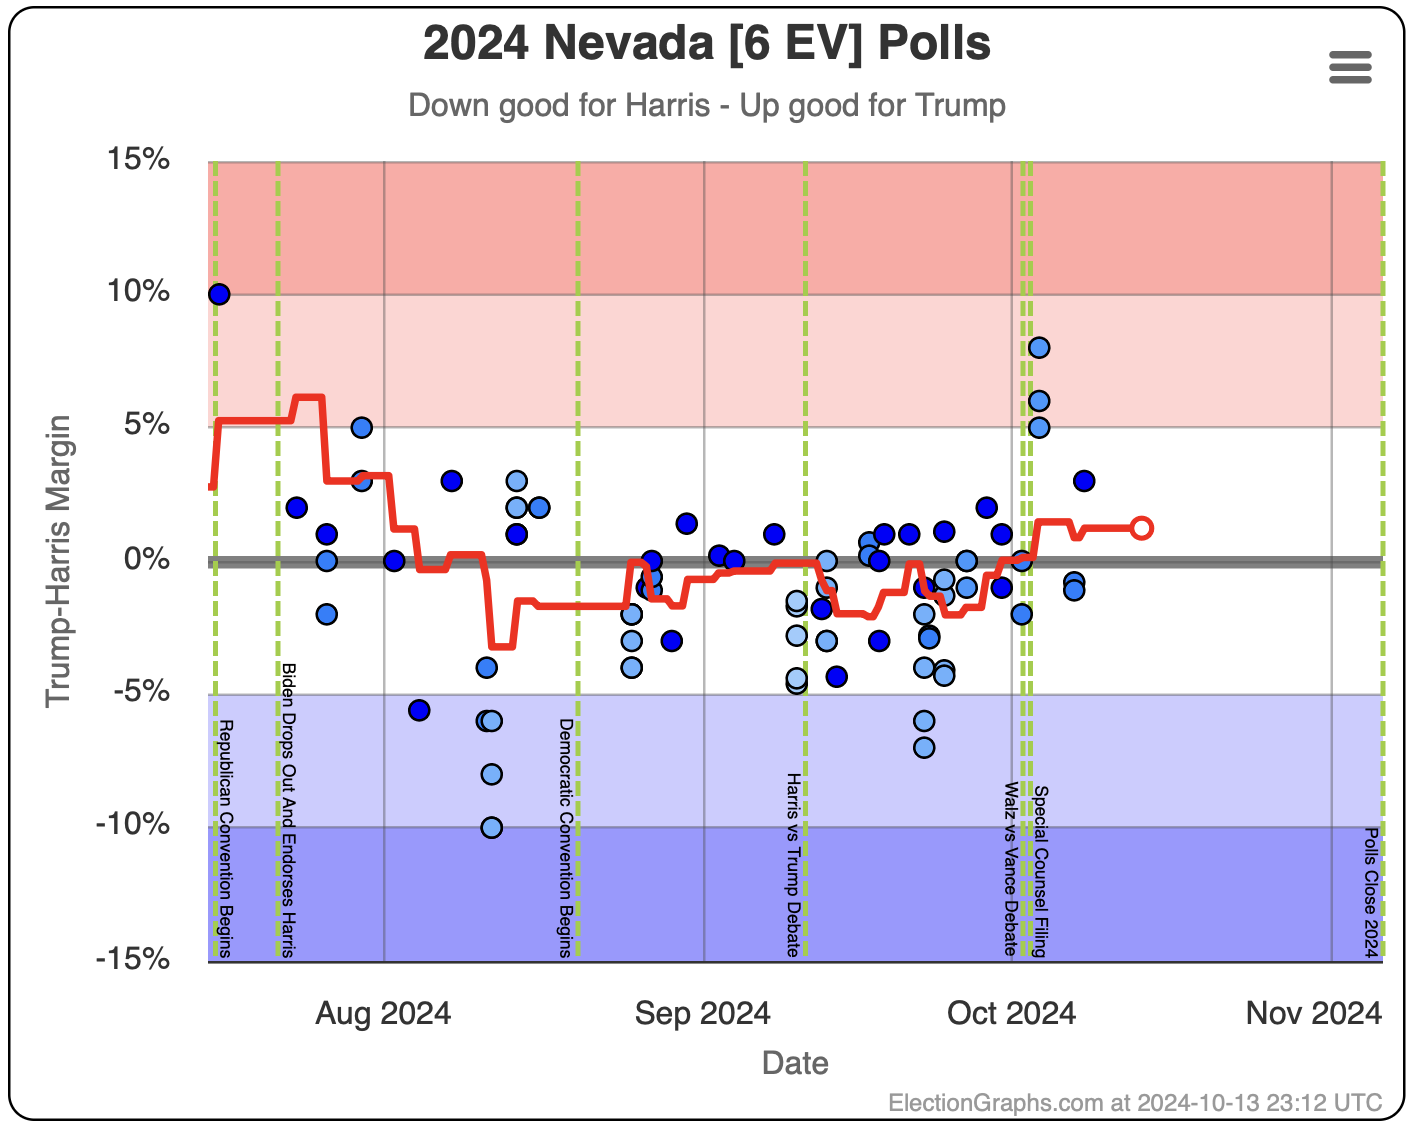
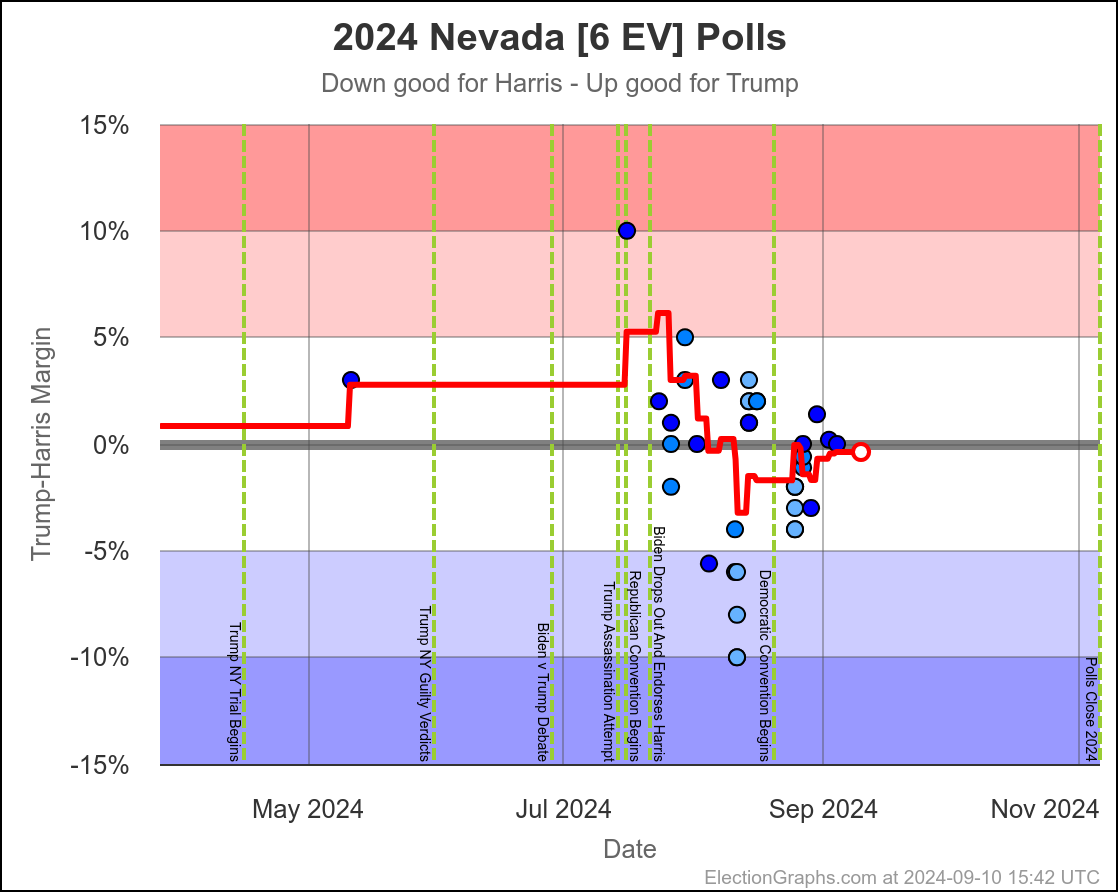
Nevada Trump+2.5% Trump+3.8% Trump+1.3%
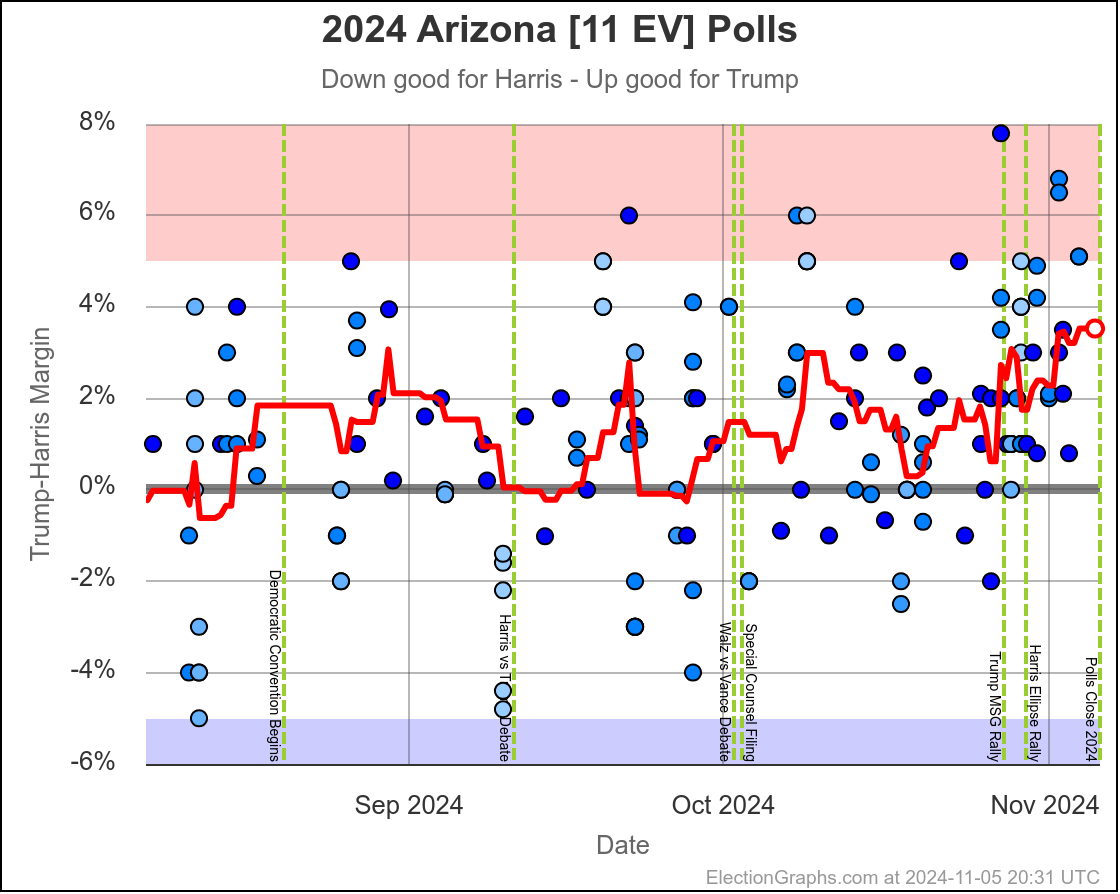
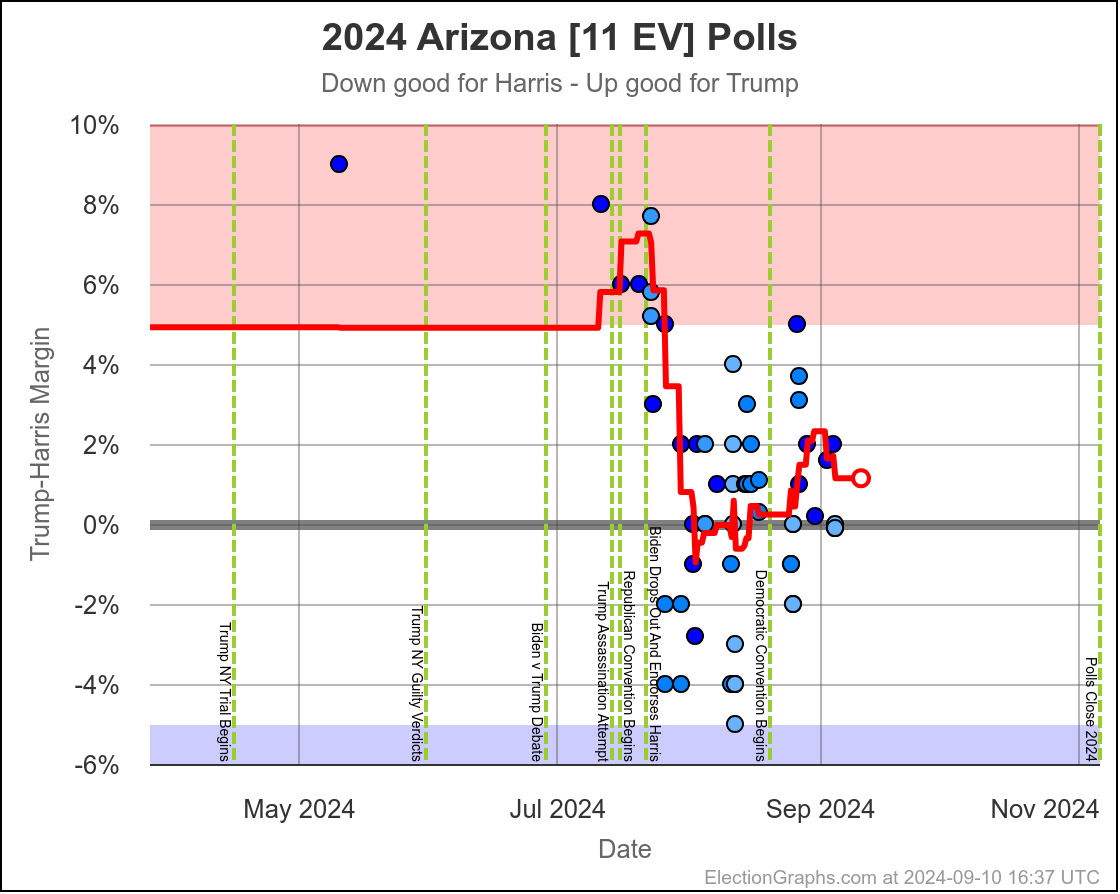
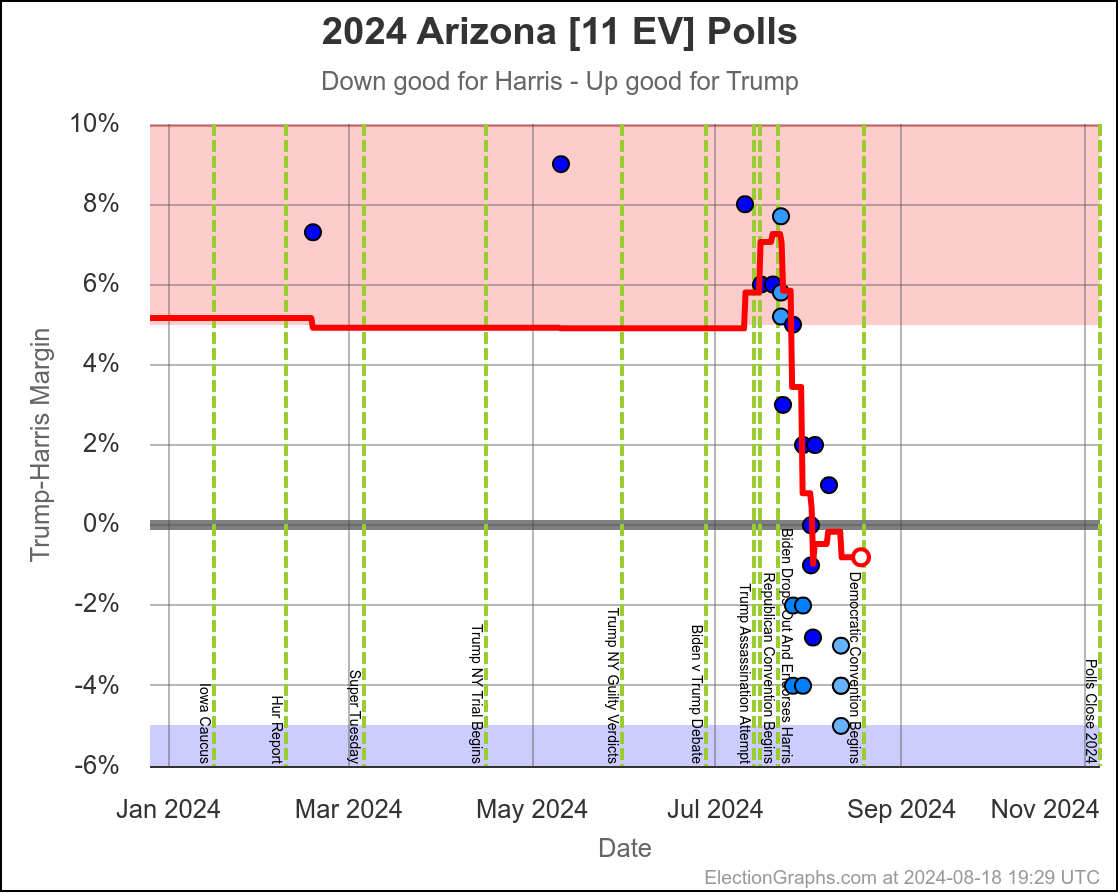
Arizona Trump+3.5% Trump+5.5% Trump+2.0%
Florida Trump+5.3% Trump+13.1% Trump+7.8%
Iowa Trump+5.5% Trump+13.2% Trump+7.7%
Maine-CD2 Trump+5.8% Trump+8.0% Trump+2.2%
Ohio Trump+7.8% Trump+11.3% Trump+3.5%
Alaska Trump+8.2% Trump+15.2% Trump+7.0%
Texas Trump+8.4% Trump+13.9% Trump+5.5%

Every single one underestimated Trump. Every single one.

This ranged from 0.1% in New Mexico, to 7.8% in Florida.

The average miss where EG margins were under 10% was a 2.9% miss.

For just the very closest states, the ones where the EG margin was under 5%, the average miss was a bit smaller at 1.5%.

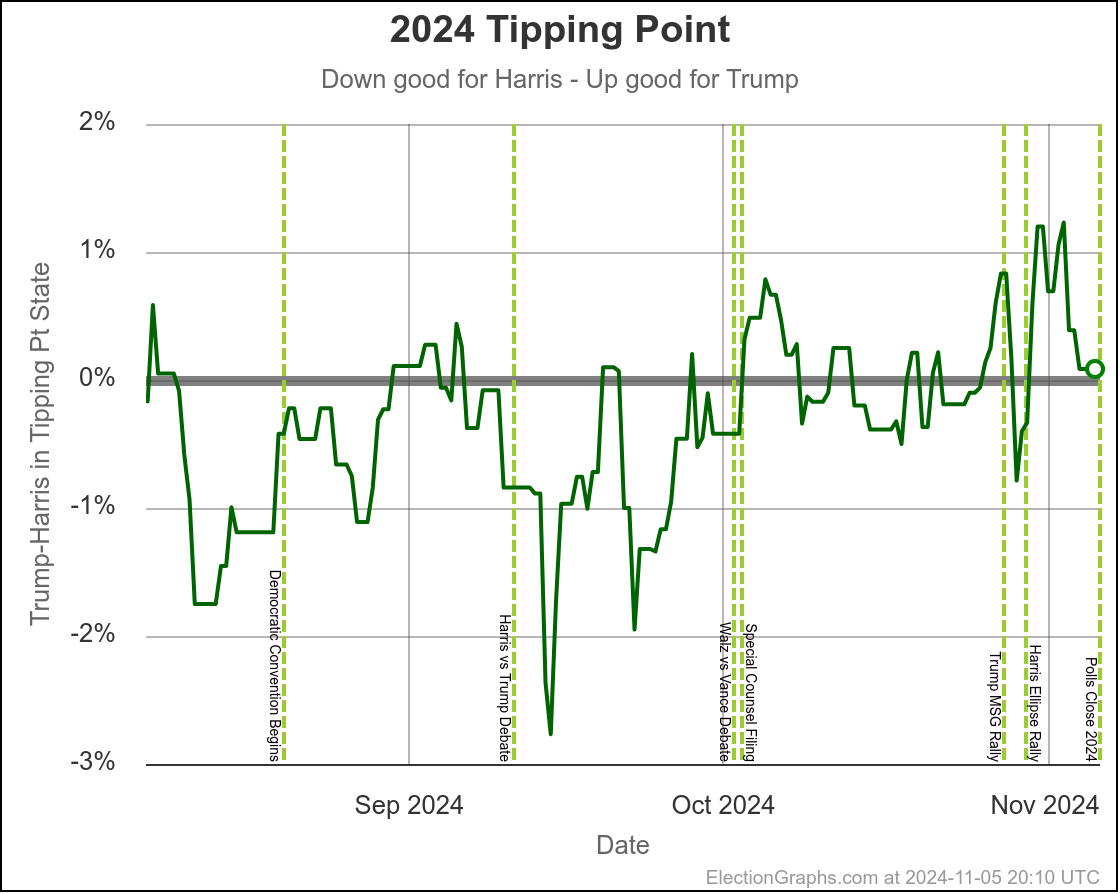
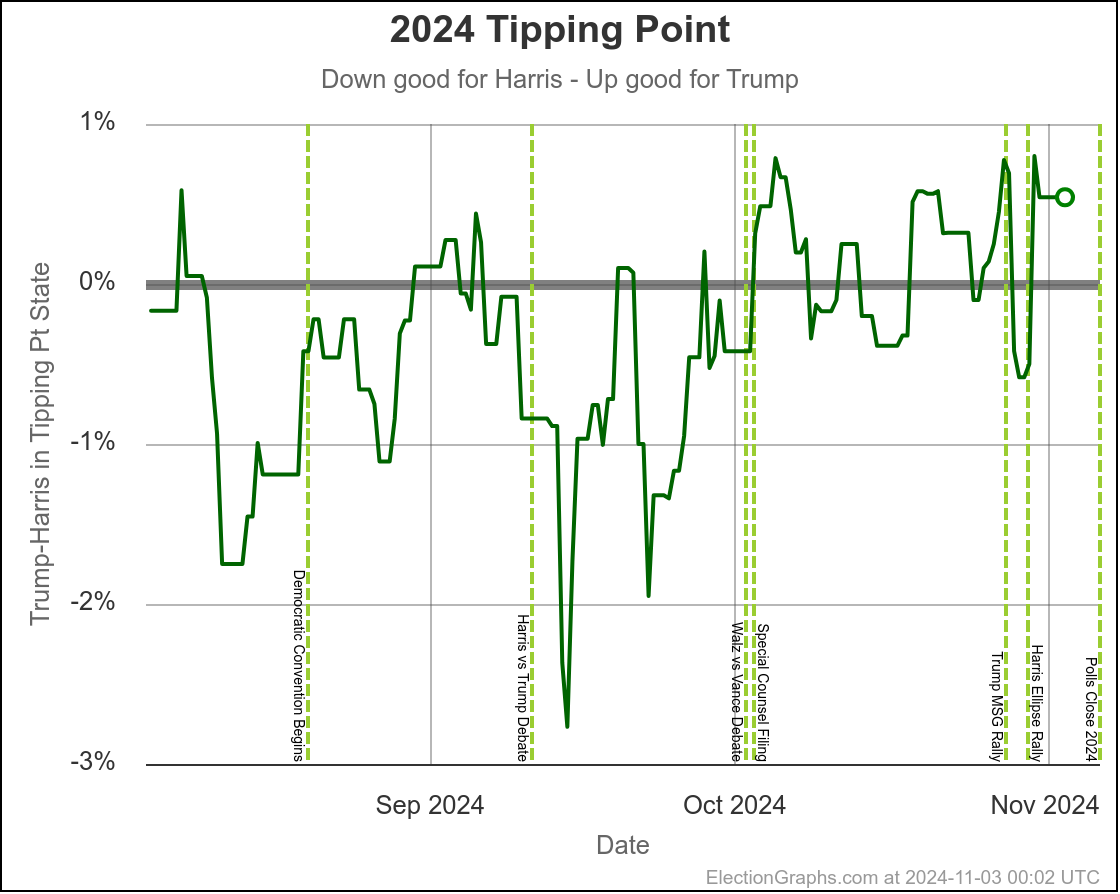
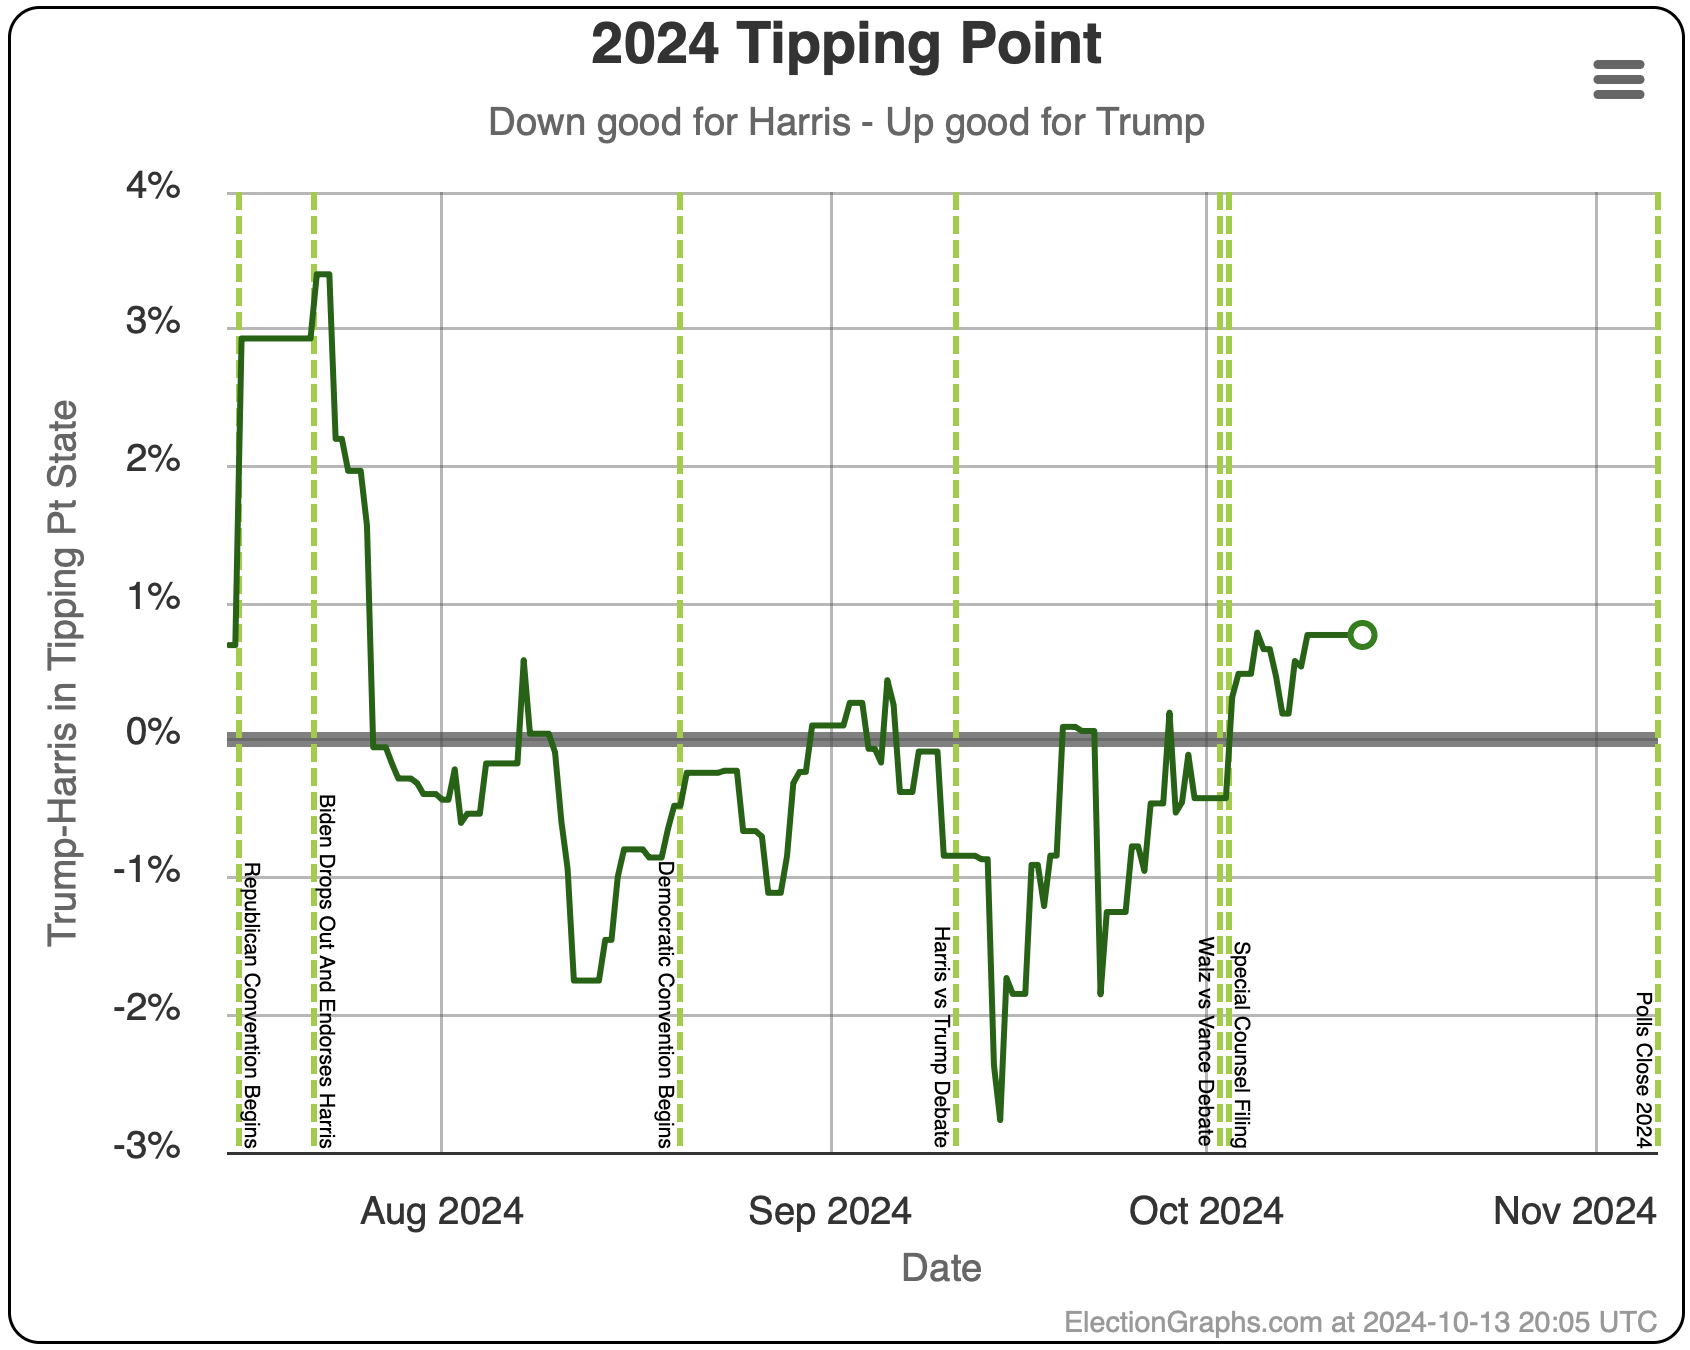
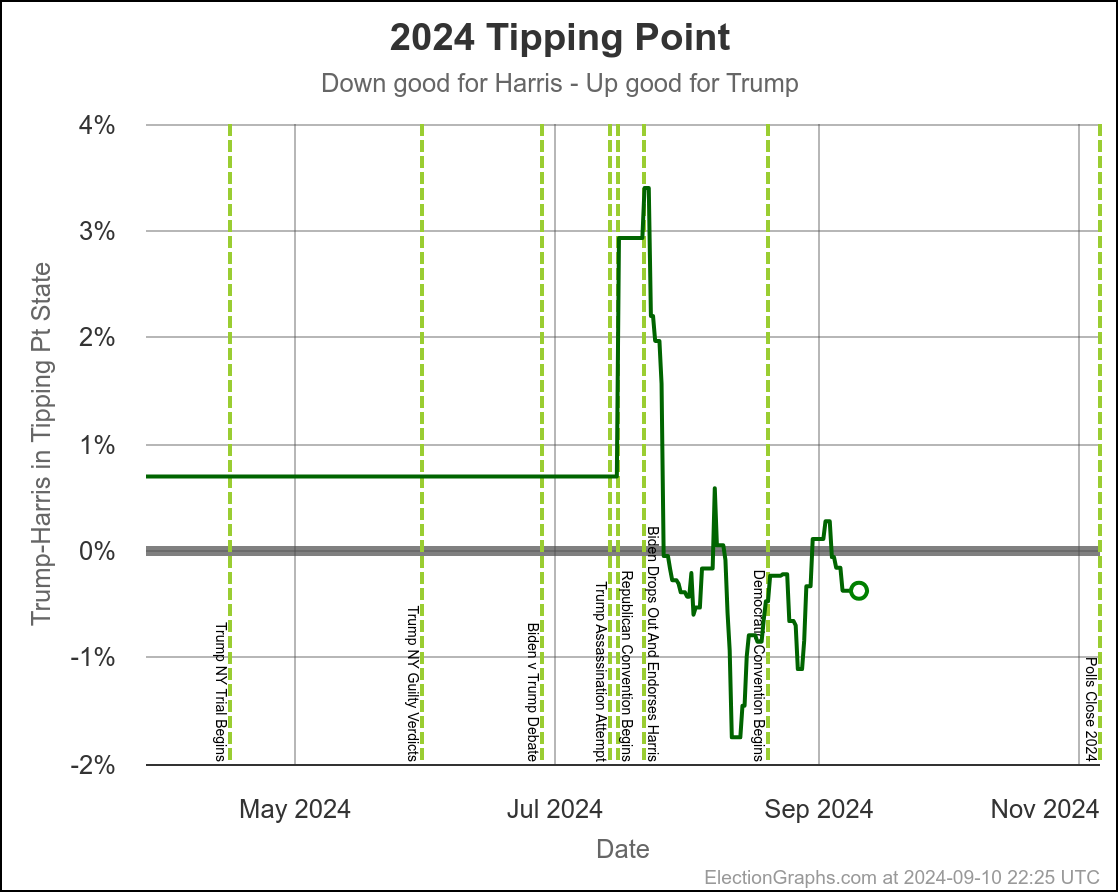
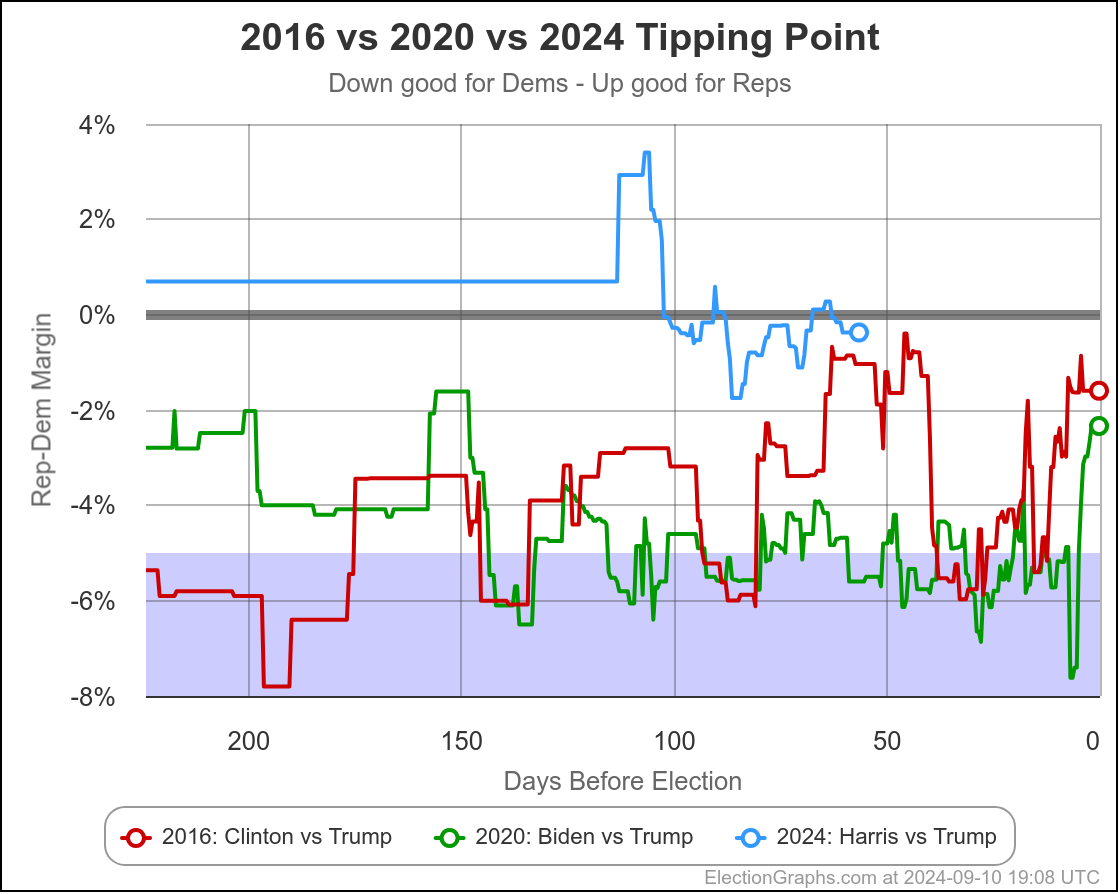
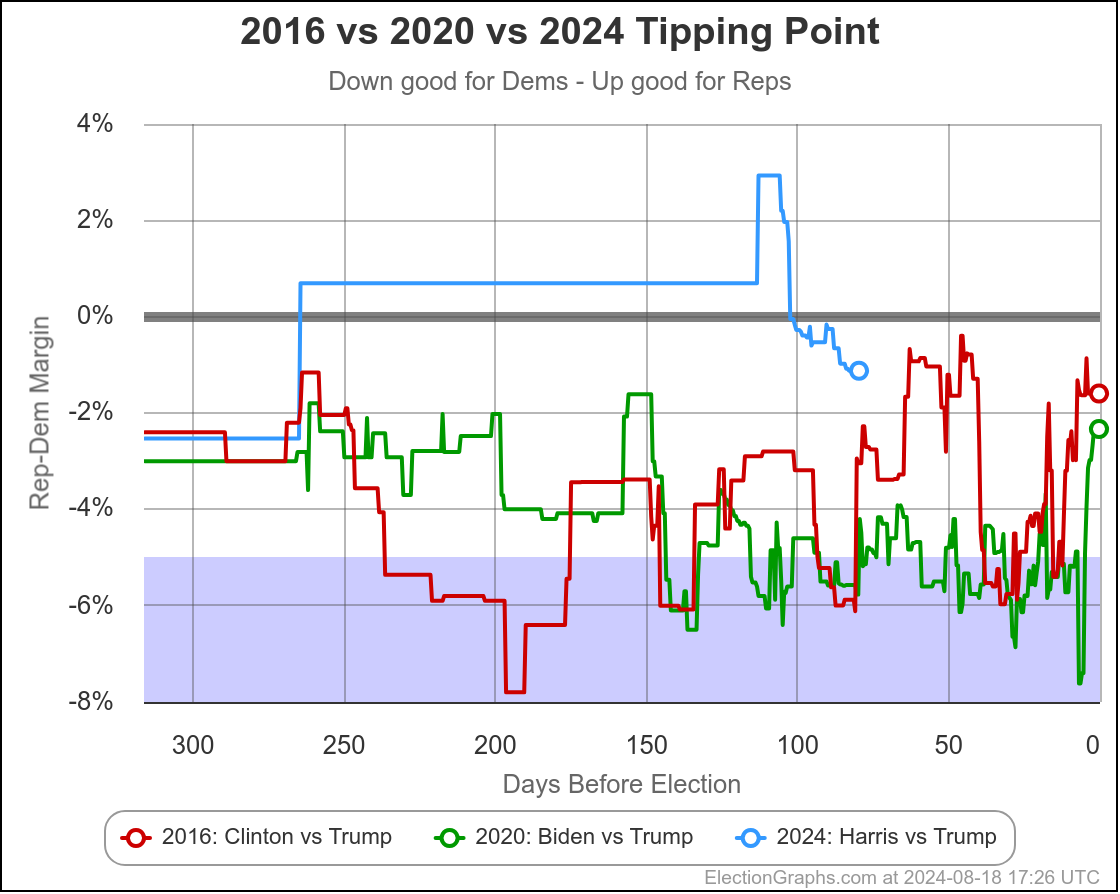
And the tipping point was off by 1.8%.

Let's compare that tipping point error to previous cycles. From the Election Graphs FAQ:

  • 2008: Obama's tipping point was 3.45% better than predicted.
  • 2012: Obama's tipping point was 0.89% better than predicted.
  • 2016: Trump's tipping point was 2.36% better than predicted.
  • 2020: Biden's tipping point was 1.41% worse than predicted.

A 1.8% miss in the tipping point is actually better than 2008 or 2016, but worse than 2012 and 2020. So right in the middle.

So as polling errors go, this is actually pretty typical.

But of course the part that will cause the most consternation is that this is the third cycle in a row that the polls have missed in the same direction.

If the direction of the polling error was just random with a 50/50 chance, there is a 12.5% chance of the error being in the same direction three times in a row. Which, hey, isn't small enough for us to say there is something systemic wrong. There could be for sure. But it also could just be bad luck.

When we set up for 2028 though, the models will be based on polling error data from 2008 through 2024, and 2024's miss means 3 out of 5 cycles will have underestimated the Republican, so rather than it needing the Democrat to be ahead by 1.2% to have even odds of winning a state, they are going to need more than that for sure.

It makes it really tempting to not just show odds on Election Graphs, but show maps and the "spectrum of the states" and such based on the calculated odds rather than the straight averages. Maybe even show "unskewed" poll averages. But that feels icky in a way. But maybe as an option. I'll think about it.

Well, there is a lot of data crunching that I'll need to do to set things up for 2028, and I probably won't start that until at least 2026, so that may be a little premature.

In any case, thanks everyone for following Election Graphs this cycle. If I don't post again before then, see you for the 2028 race!

0 Days Out: Election Day

It has been 3 days since my last post.

It is now Election Day. This is my last pre-election post.

I usually do some sort of post-election post-mortem, but usually not until at least when the Electoral College does in December, but maybe not until after January 6th, or maybe not even until I start setting things up for the next election cycle, which may be a couple of years. So don't hold your breath. It all depends if I have time and if I feel the inspiration. 🙂

For anybody interested, my Curmudgeon's Corner cohost Ivan and I will be live streaming our reactions as the vote counting unfolds tonight over at the Curmudgeon's Corner YouTube channel. We expect to start at 0 UTC. That's 7 PM Eastern, 4 PM Pacific. Join us!

Four and eight years ago I live blogged results here as they came in. I won't be doing that this year. There are better sources of live return information. Pick your favorite. I might post some updates or thoughts over at @ElectionGraphs@newsie.social on Mastodon if you want to check in on that.

As of 20 UTC (3 PM Eastern, Noon Pacific) I closed the books on adding new polls to Election Graphs for 2024. If there are any more straggler polls, sorry, they won't be included. Everything in this post now reflects the final state before polls start to close.

One last TL;DR, which should look very familiar:

Harris's position overall has improved since three days ago (the tipping point went from Trump by 0.5% to Trump by 0.1%), but the overall situation is the same as it has been for over a month.

If the polls are underestimating Trump right now, he wins.

If the polls are underestimating Harris right now, she wins.

If the polls are close to right, then it all comes down to Pennsylvania, which could go either way.

Any outcome from Harris winning by 100 electoral votes to Trump winning by 86 should not be considered surprising.

This reflects all seven of Wisconsin, Michigan, Pennsylvania, Georgia, North Carolina, Nevada, and Arizona having poll averages so close that either candidate winning is easily in the realm of the possible.

If you restricted the whole analysis to only the highest quality pollsters, the tipping point would change from Trump by 0.1% to Trump by 1.0%. So this time the lower quality polls actually make things look BETTER for Harris, not worse. But either way, the race is still in the zone where it could go either way. Picking and choosing which polls you like and which ones you don't doesn't really change this.

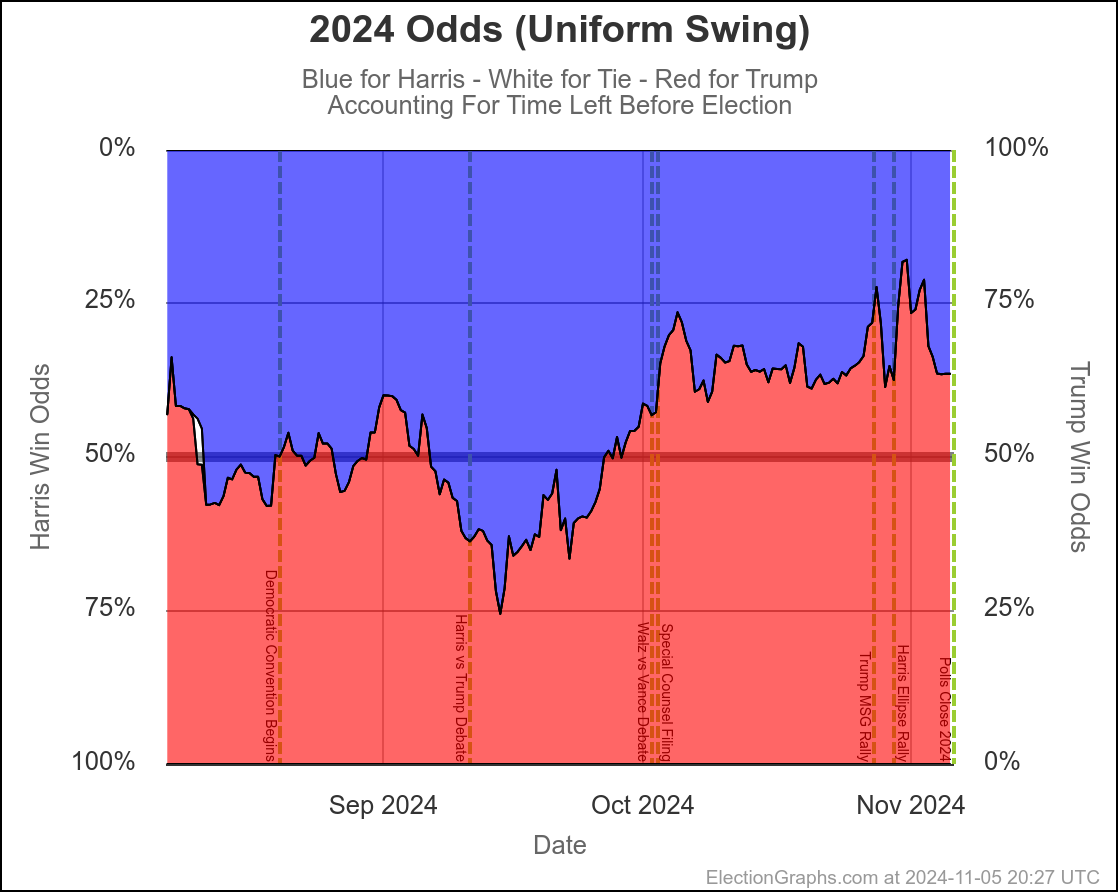
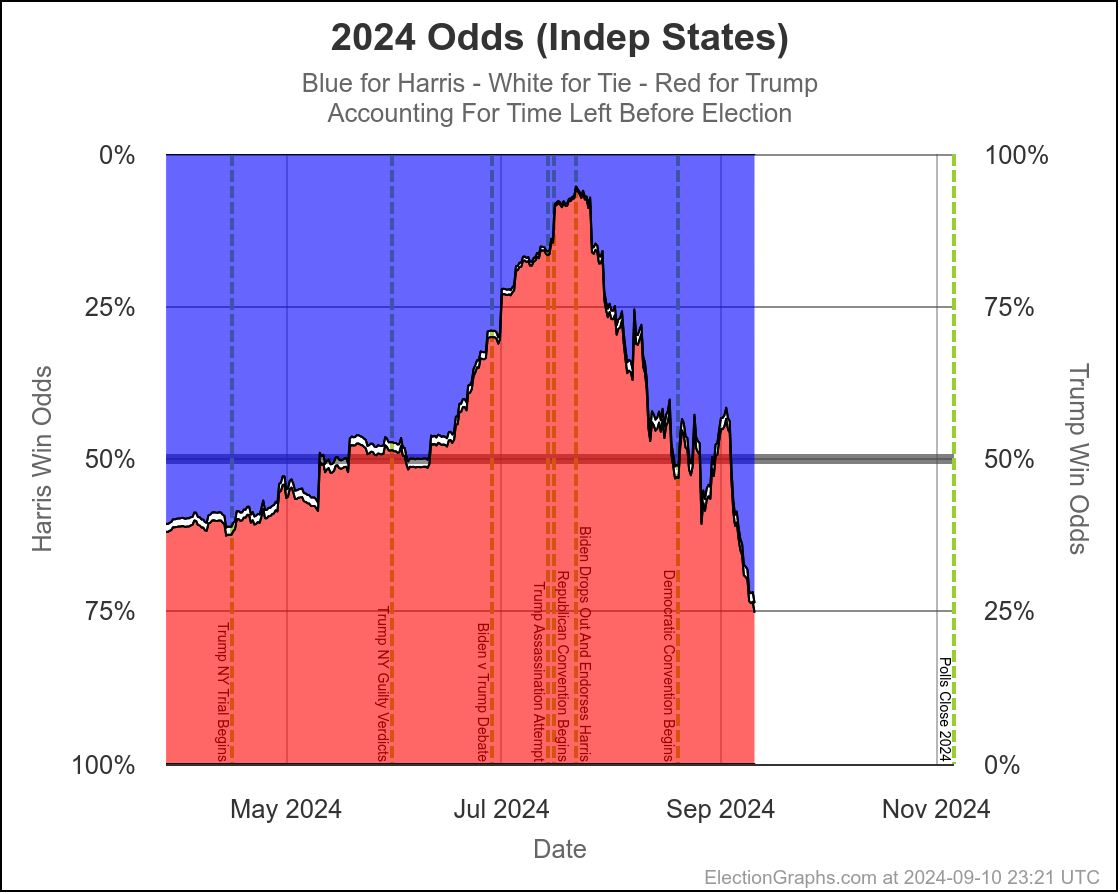
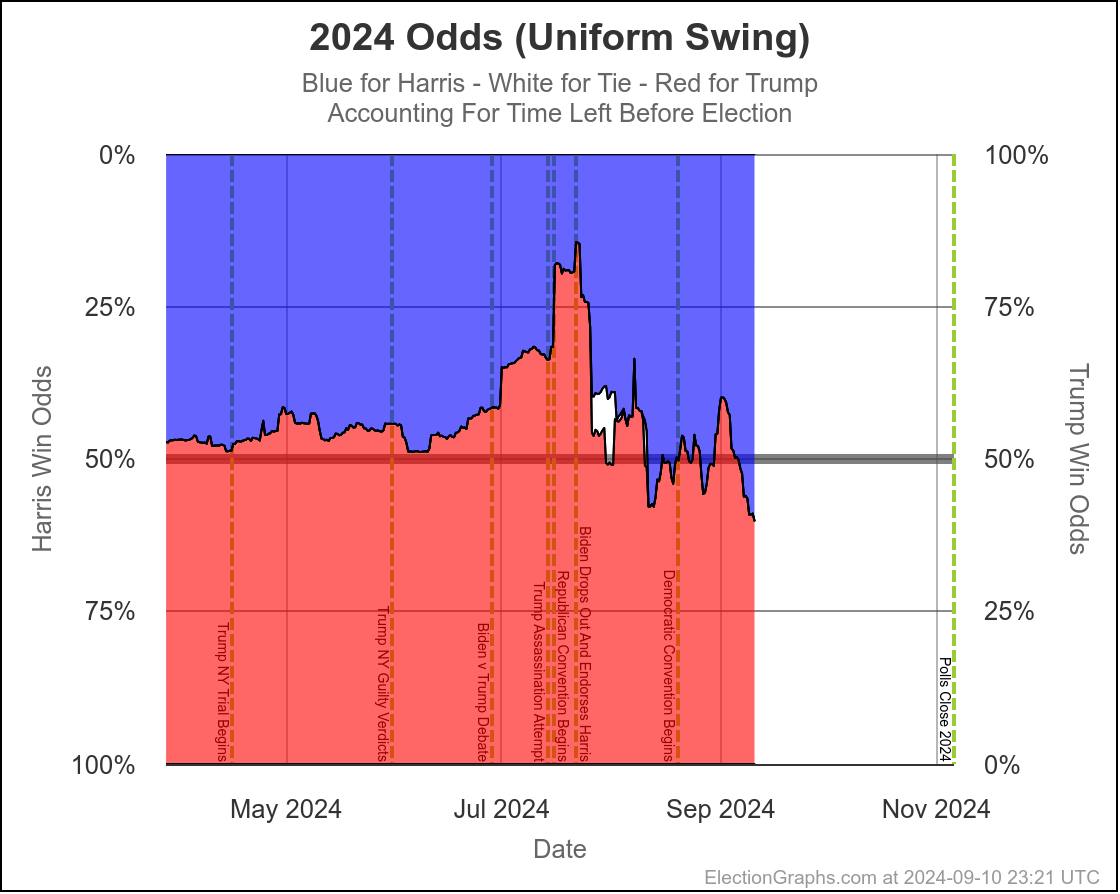
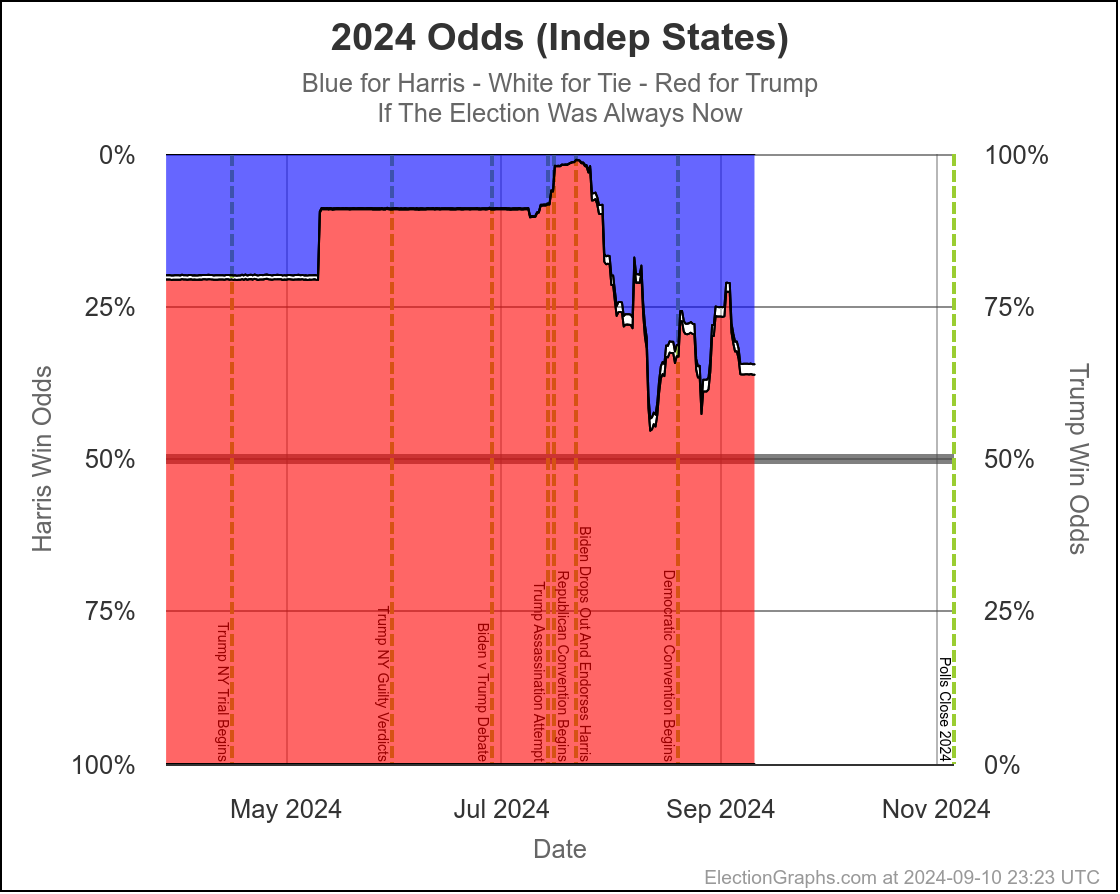
The "Uniform Swing" Election Graphs model, which is the one I expect to be closest to true, currently gives Trump a 63.6% chance of winning, to Harris's 36.4%. These percentages take the fact that final polling from 2008 to 2020 in close states has underestimated the Republican more often than not, so figures that is more likely than not to happen again.

But there are now various possible indications and hints that there might be a systemic underestimation of Harris even with the high quality pollsters. But that may or may not end up playing out that way. We'll only know once the votes are counted.

OK, now time for more details here are the usual changes since last time:

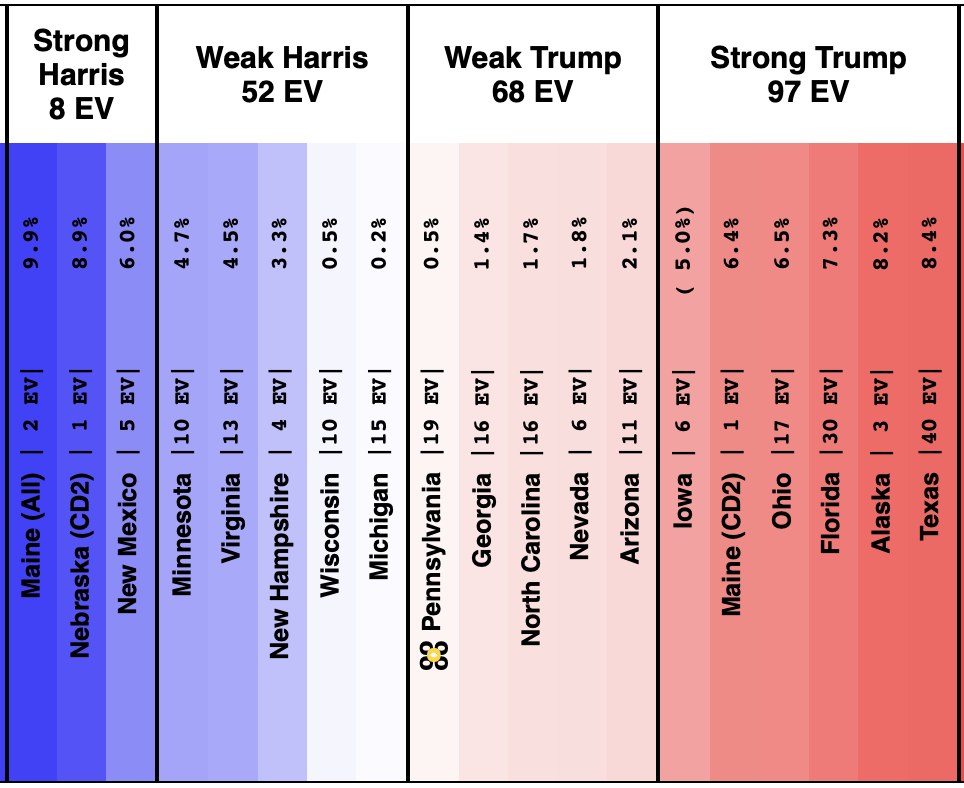
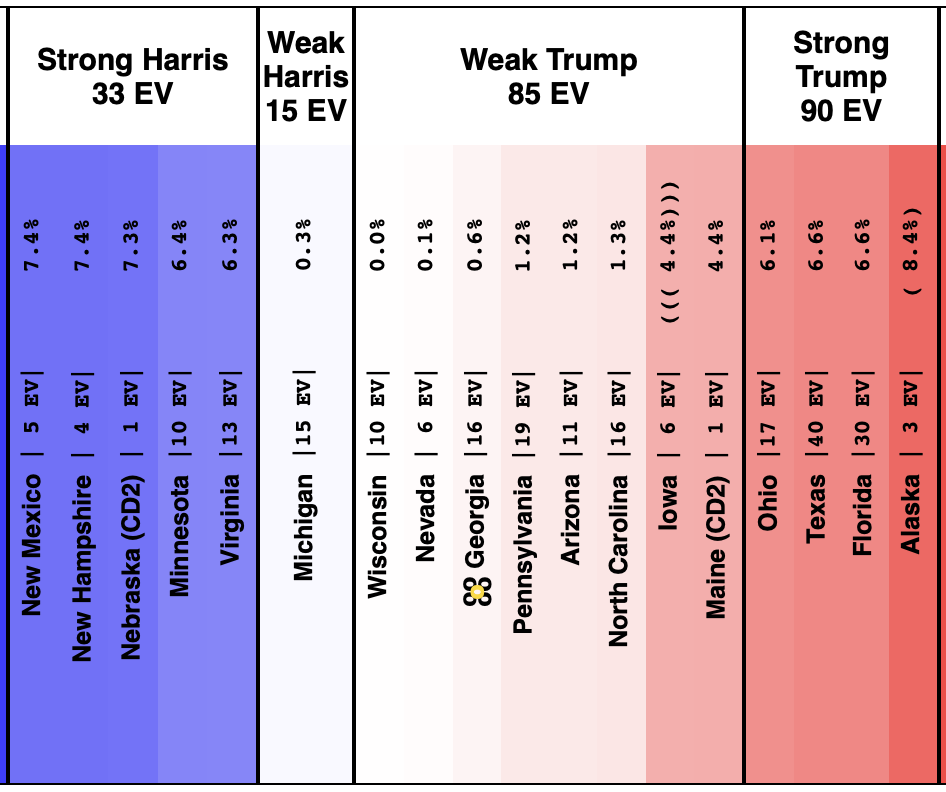
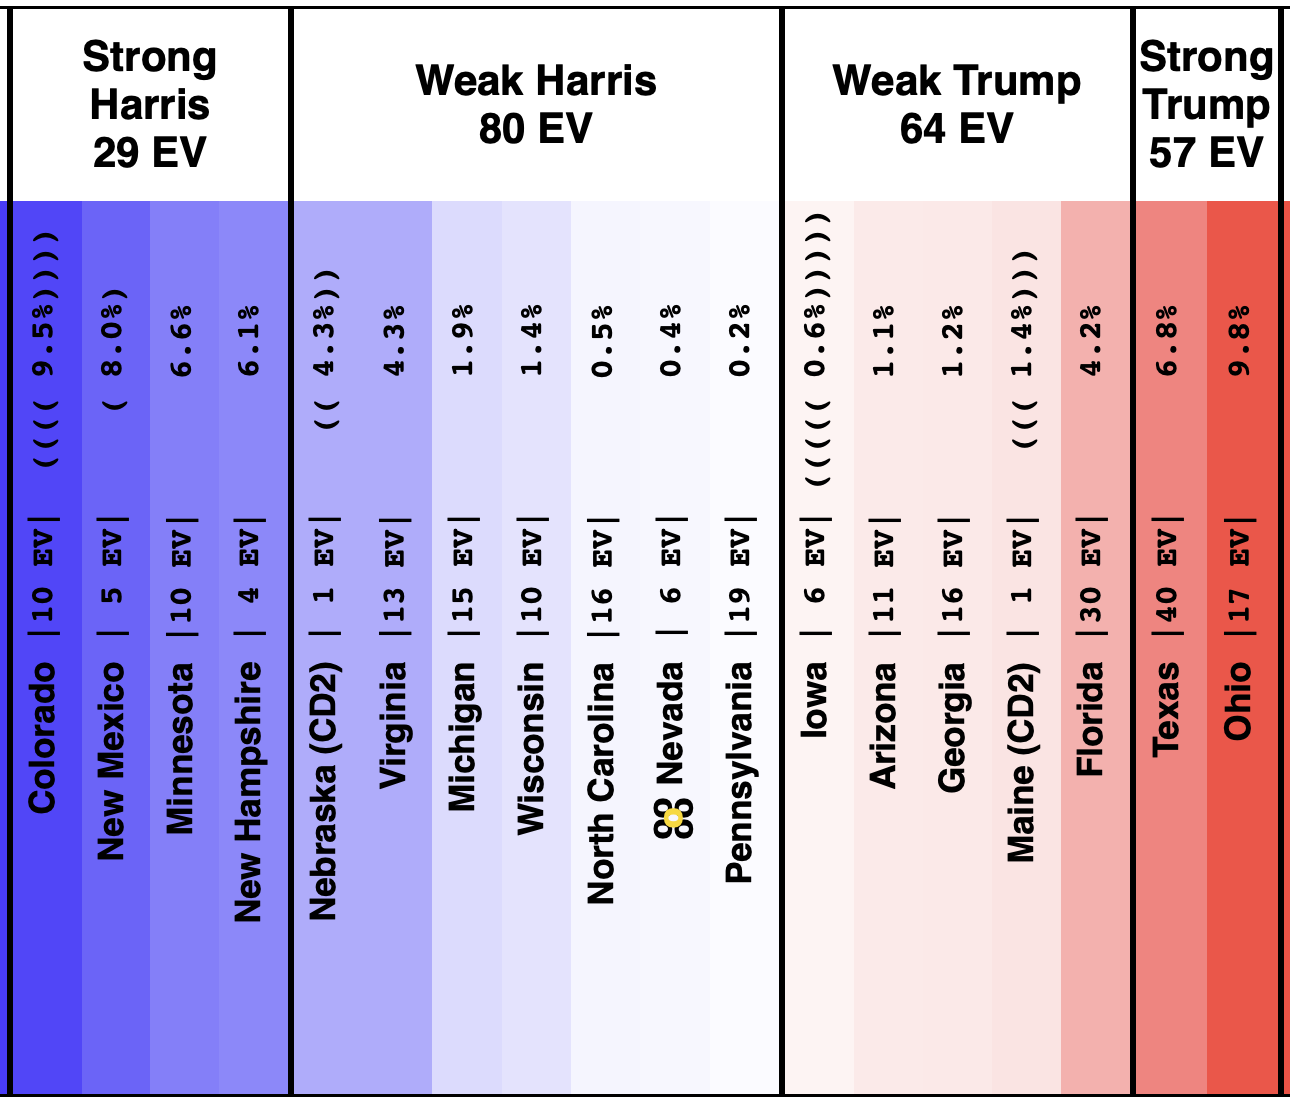
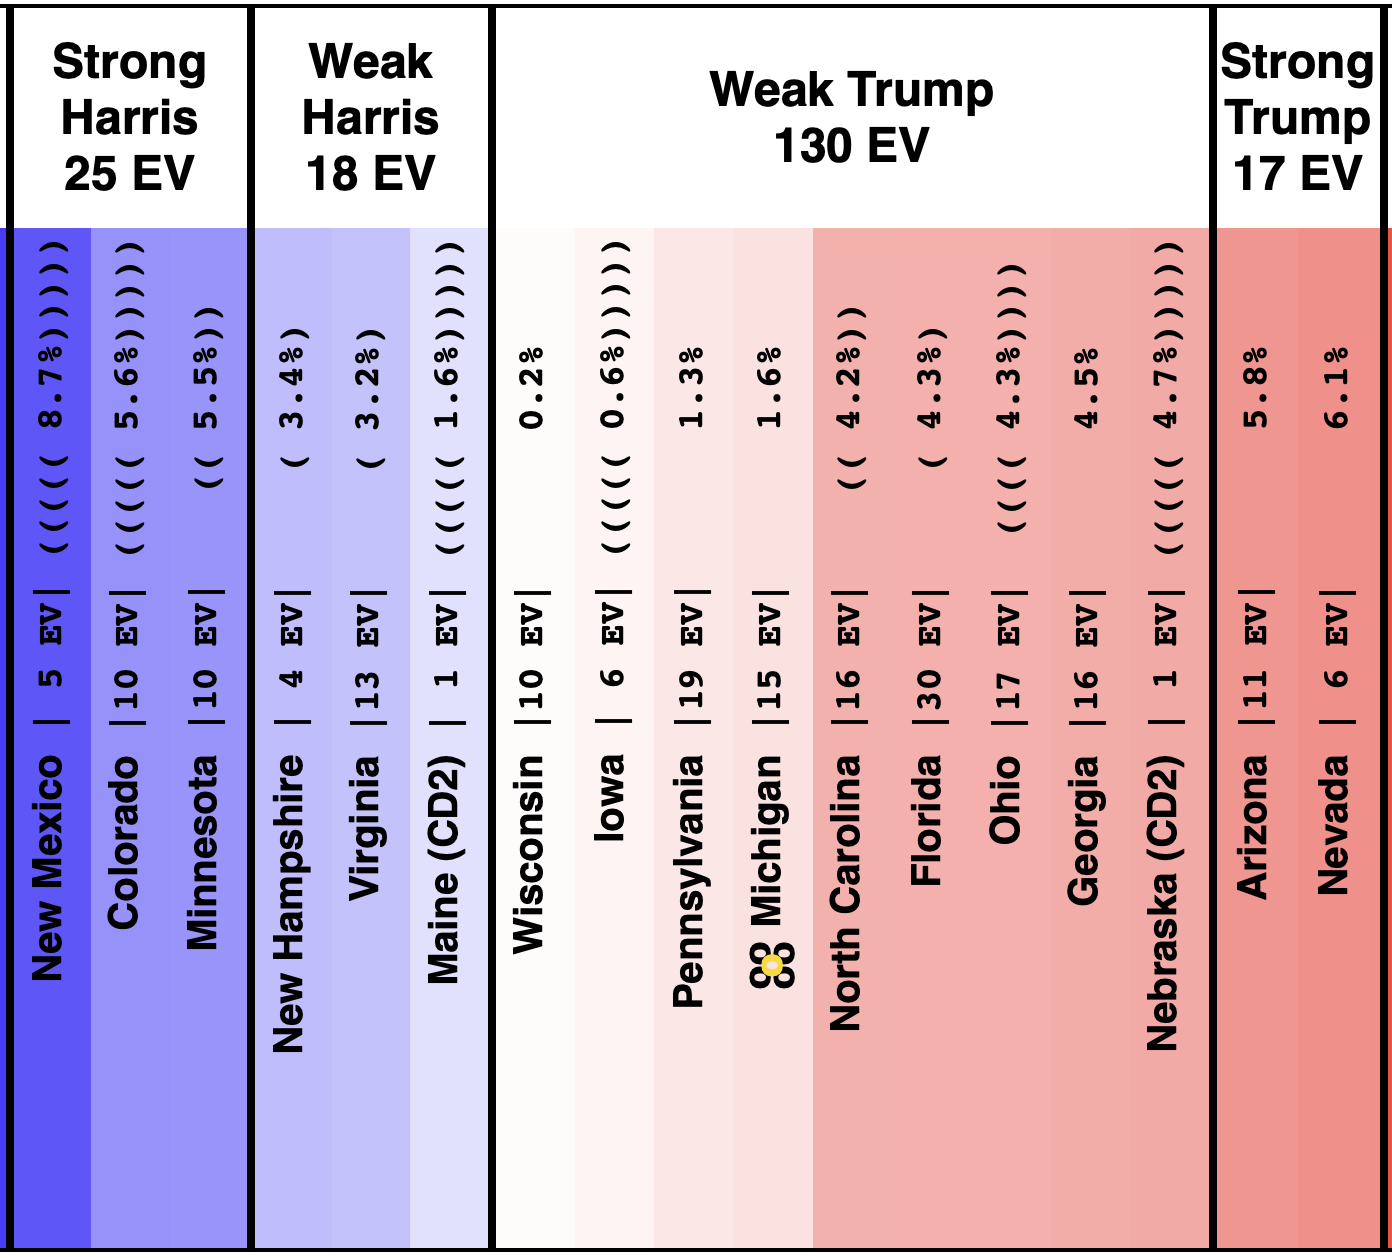
Here is the new spectrum of states with margins under 10%:

Comparing to the status in the post from 3 days ago:

Moved toward Trump:

  • Arizona (11 EV): Trump by 2.1% -> Trump by 3.5% (Trump+1.4%)
  • Ohio (17 EV): Trump by 6.5% -> Trump by 7.8% (Trump+1.3%)
  • Nevada (6 EV): Trump by 1.8% -> Trump by 2.5% (Trump+0.7%)
  • Iowa (6 EV): Trump by 5.0% -> Trump by 5.5% (Trump+0.5%)
  • North Carolina (16 EV): Trump by 1.7% -> Trump by 2.0% (Trump+0.3%)
  • New Mexico (5 EV): Harris by 6.0% -> Harris by 5.8% (Trump+0.2%)
  • Wisconsin (10 EV): Harris by 0.5% -> Harris by 0.4% (Trump+0.1%)

No movement:

  • Nebraska-CD2 (1 EV): Harris by 8.9%
  • Michigan (15 EV): Harris by 0.2%
  • Alaska (3 EV): Trump by 8.2%
  • Texas (40 EV): Trump by 8.4%

Moved toward Harris:

  • Georgia (16 EV): Trump by 1.4% -> Trump by 1.3% (Harris+0.1%)
  • Pennsylvania (19 EV): Trump by 0.5% -> Trump by 0.1% (Harris+0.4%)
  • Maine-All (2 EV): Harris by 9.9% -> Harris by 10.4% (Harris+0.5%)
  • Minnesota (10 EV): Harris by 4.7% -> Harris by 5.3% (Harris+0.6%)
  • Maine-CD2 (1 EV): Trump by 6.4% -> Trump by 5.8% (Harris+0.6%)
  • Virginia (13 EV): Harris by 4.5% -> Harris by 6.1% (Harris+1.6%)
  • Florida (30 EV): Trump by 7.3% -> Trump by 5.3% (Harris+2.0%)
  • New Hampshire (4 EV): Harris by 3.3% -> Harris by 7.8% (Harris+4.5%)

Pretty mixed bag, with states bouncing around in both directions. No clear trend, but the tipping point moved from Trump by 0.5% in Pennsylvania to Trump by 0.1% in Pennsylvania, just to leave things just about as close at they could possibly be.

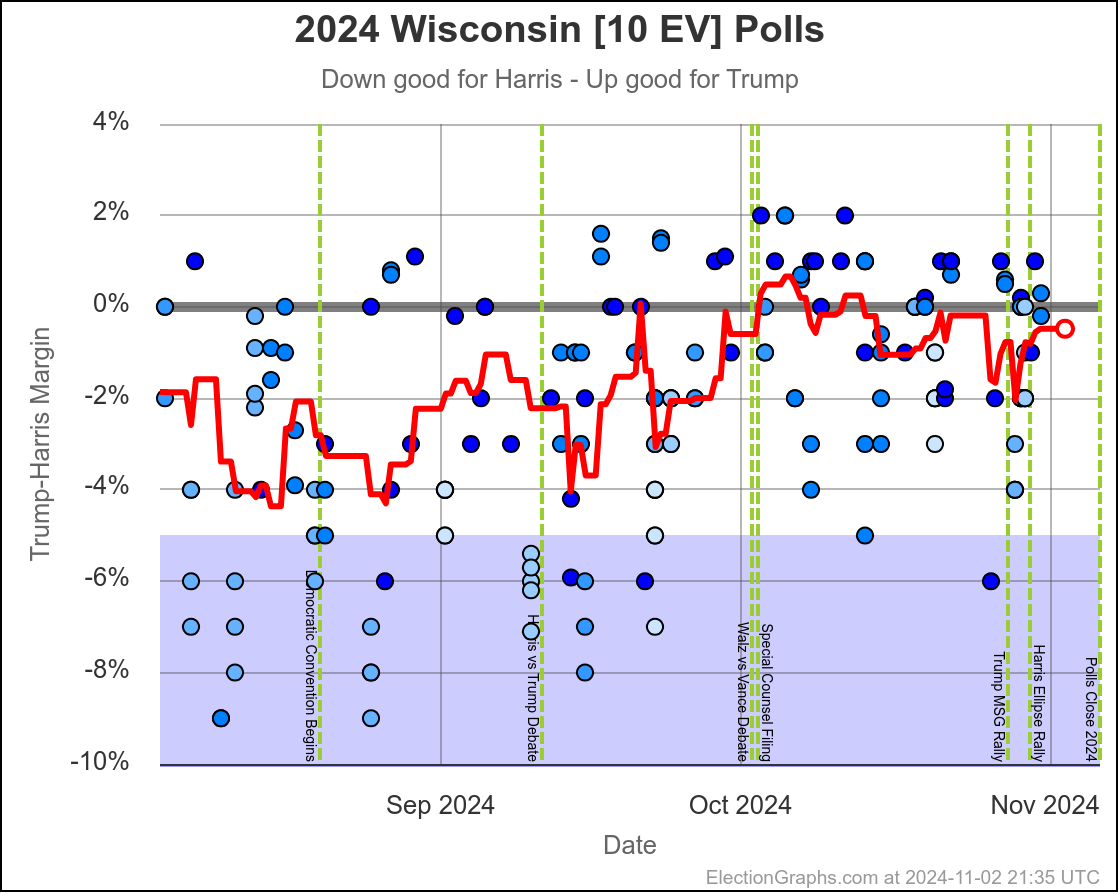
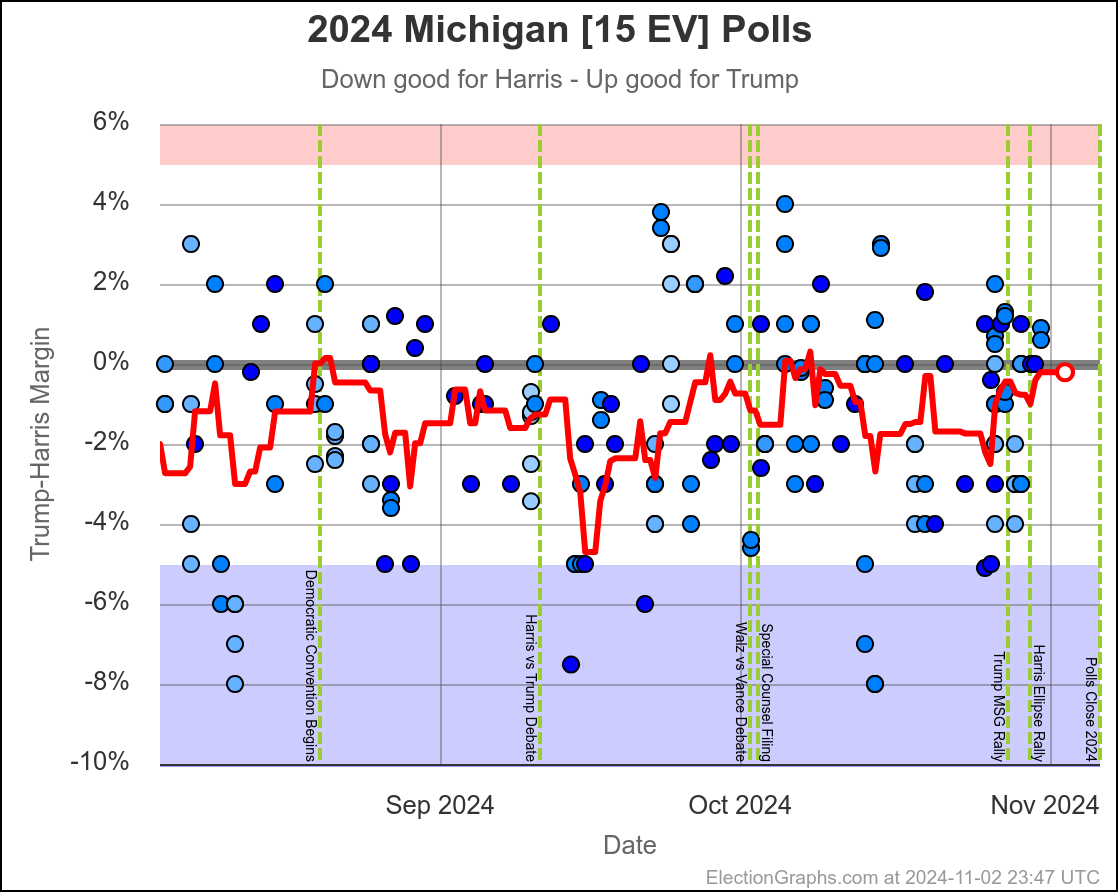
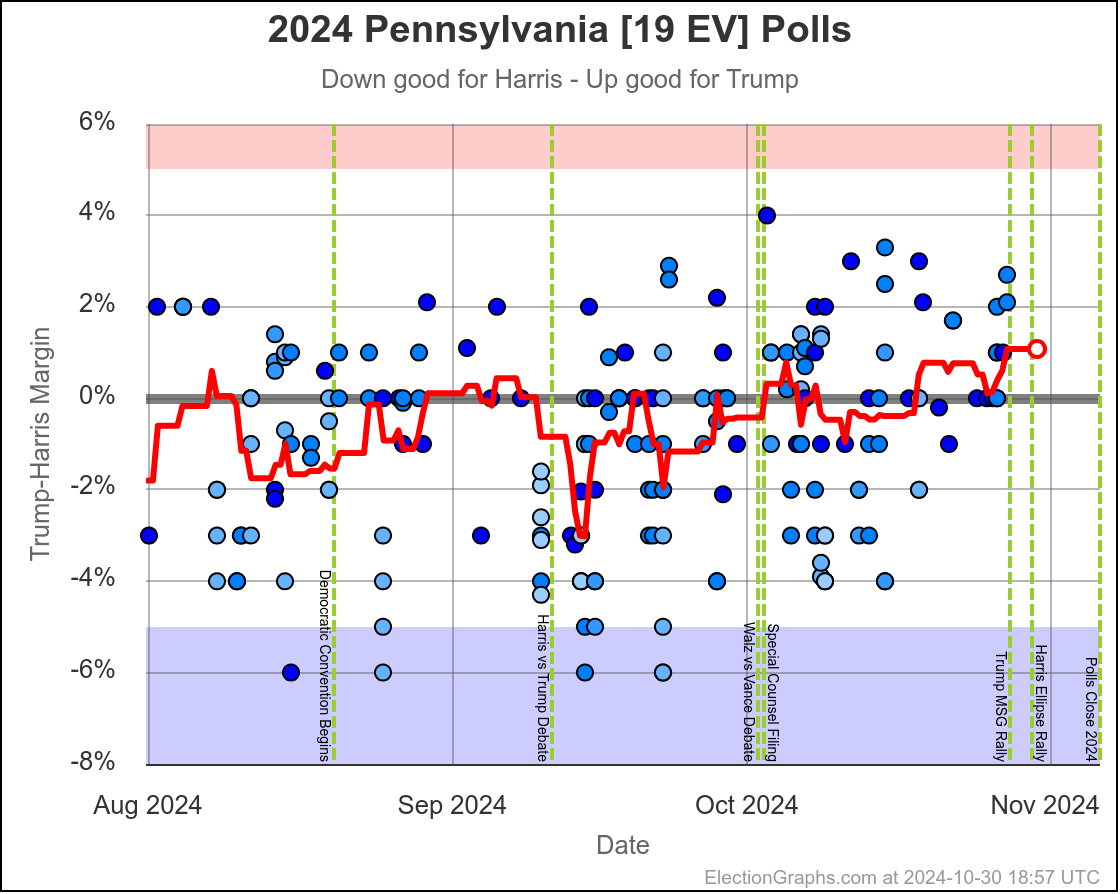
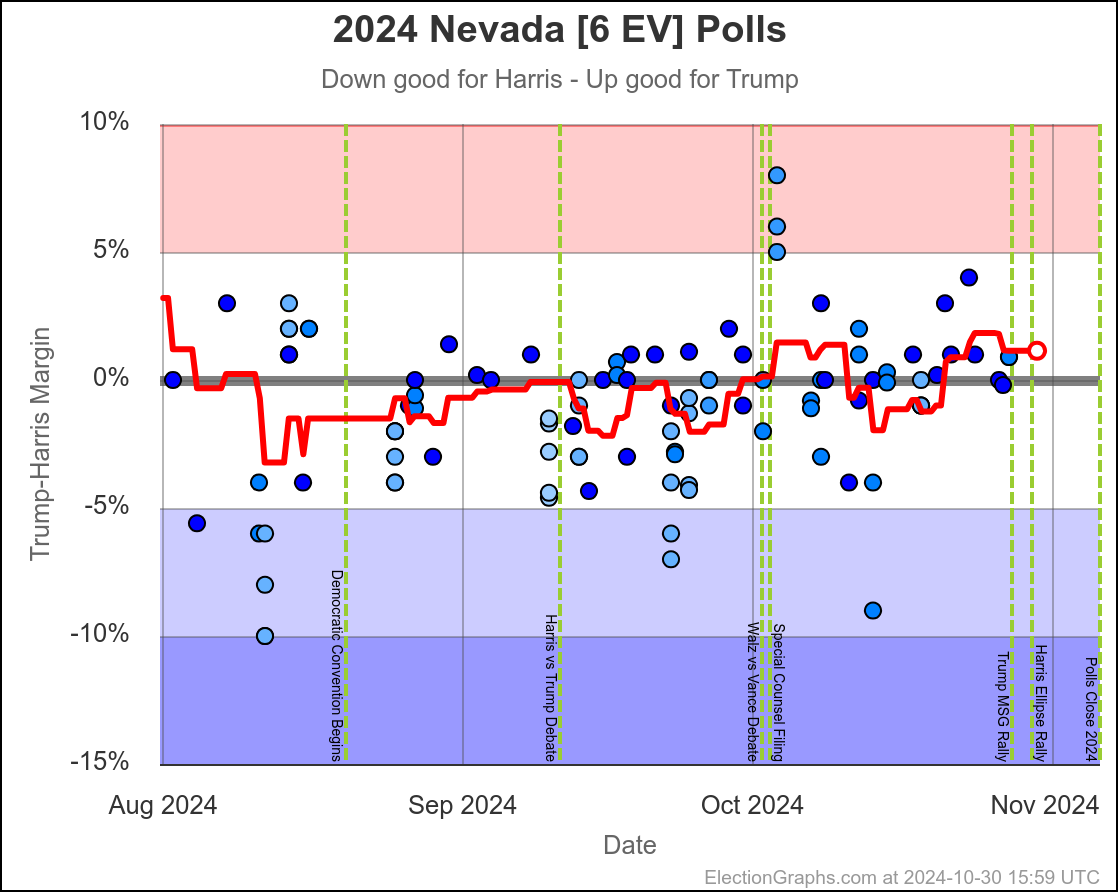
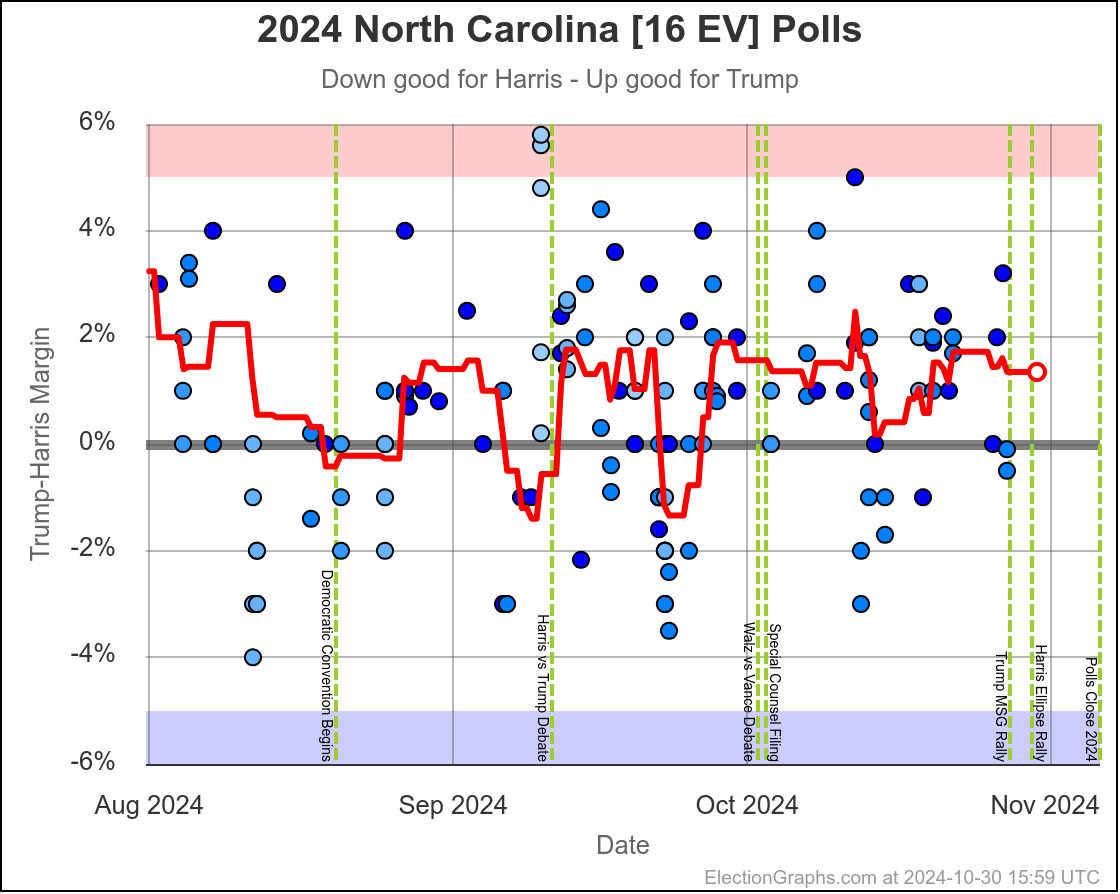
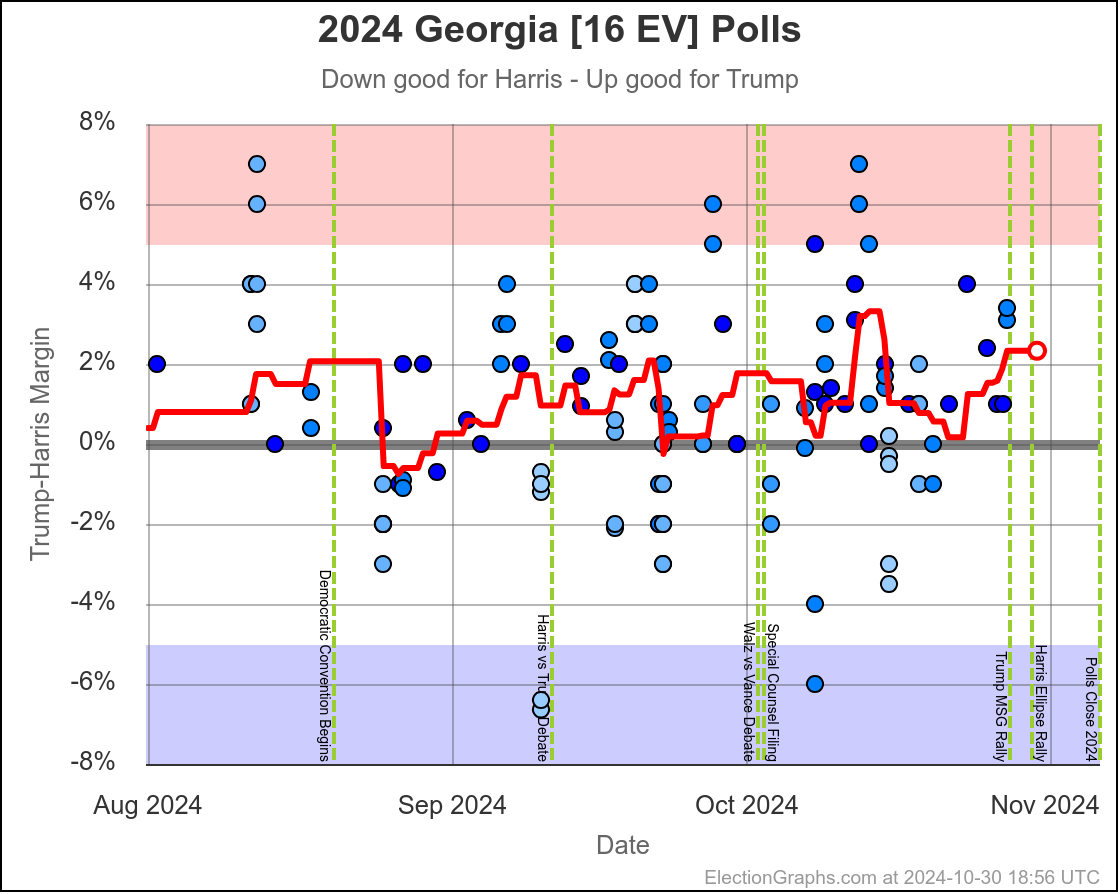
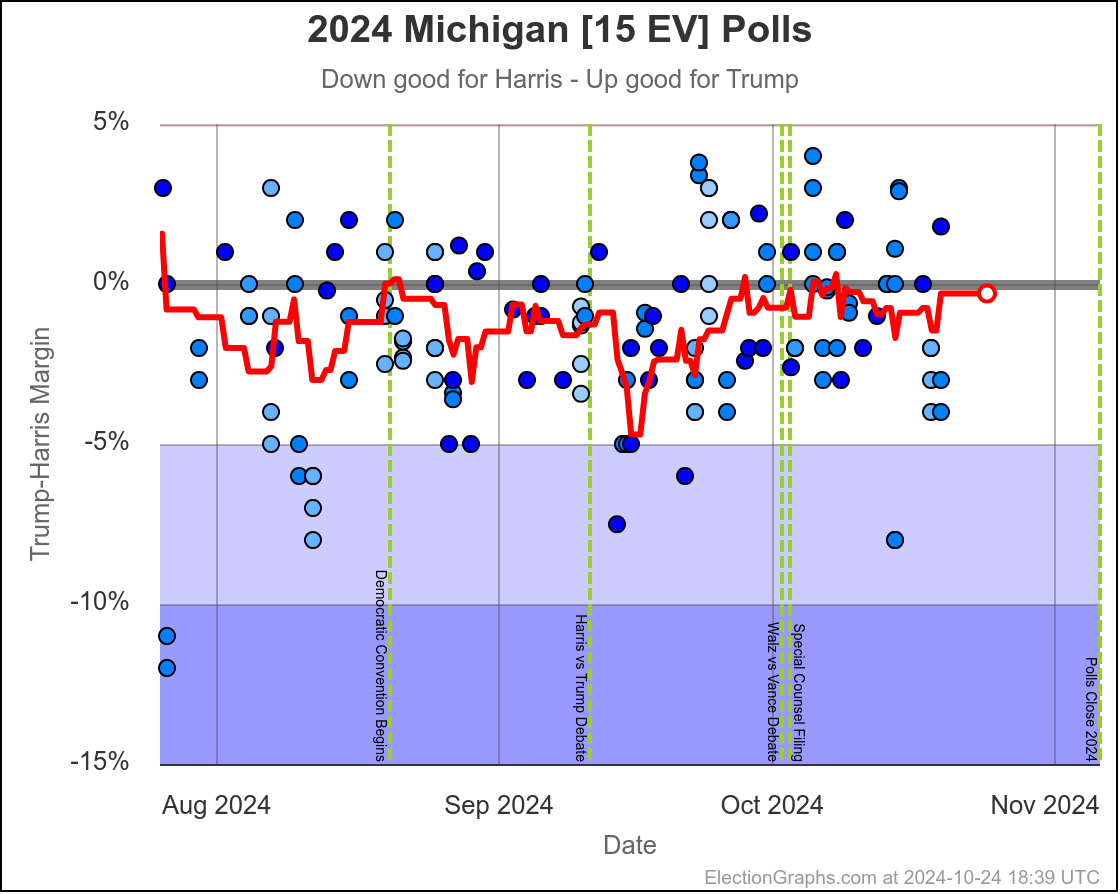
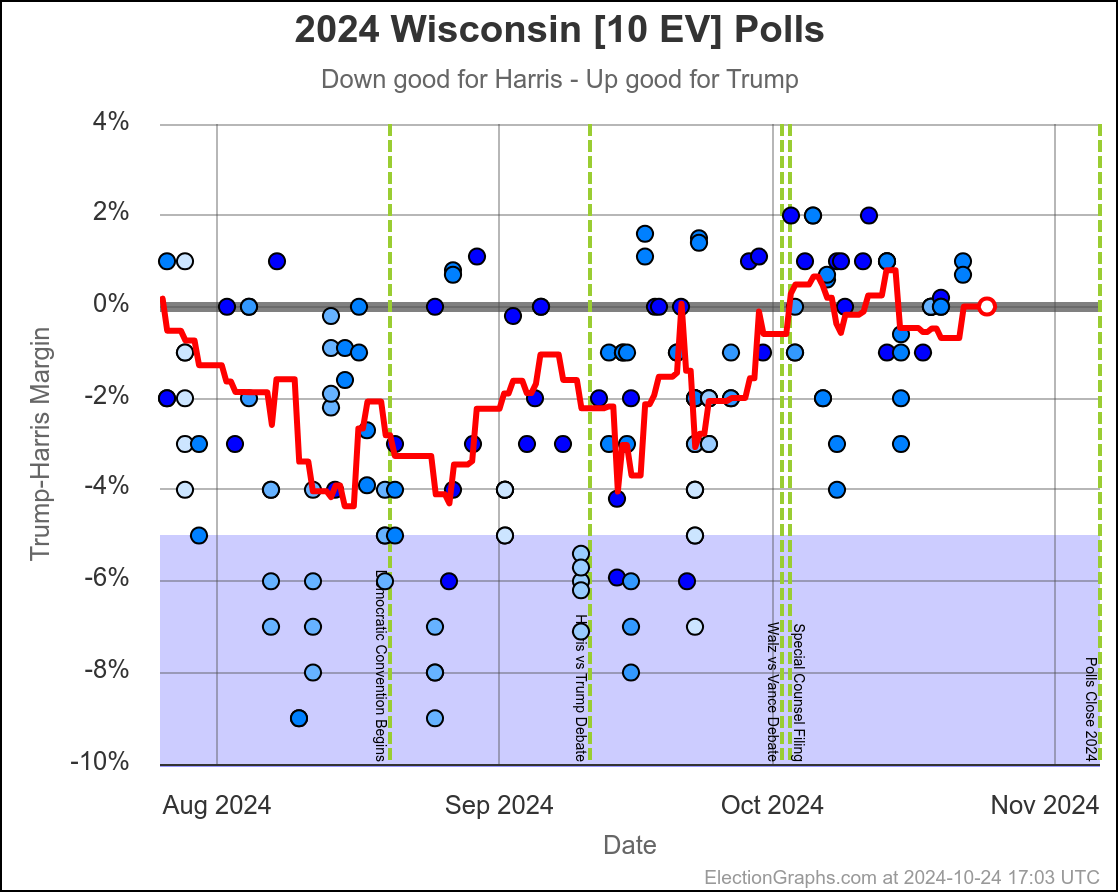
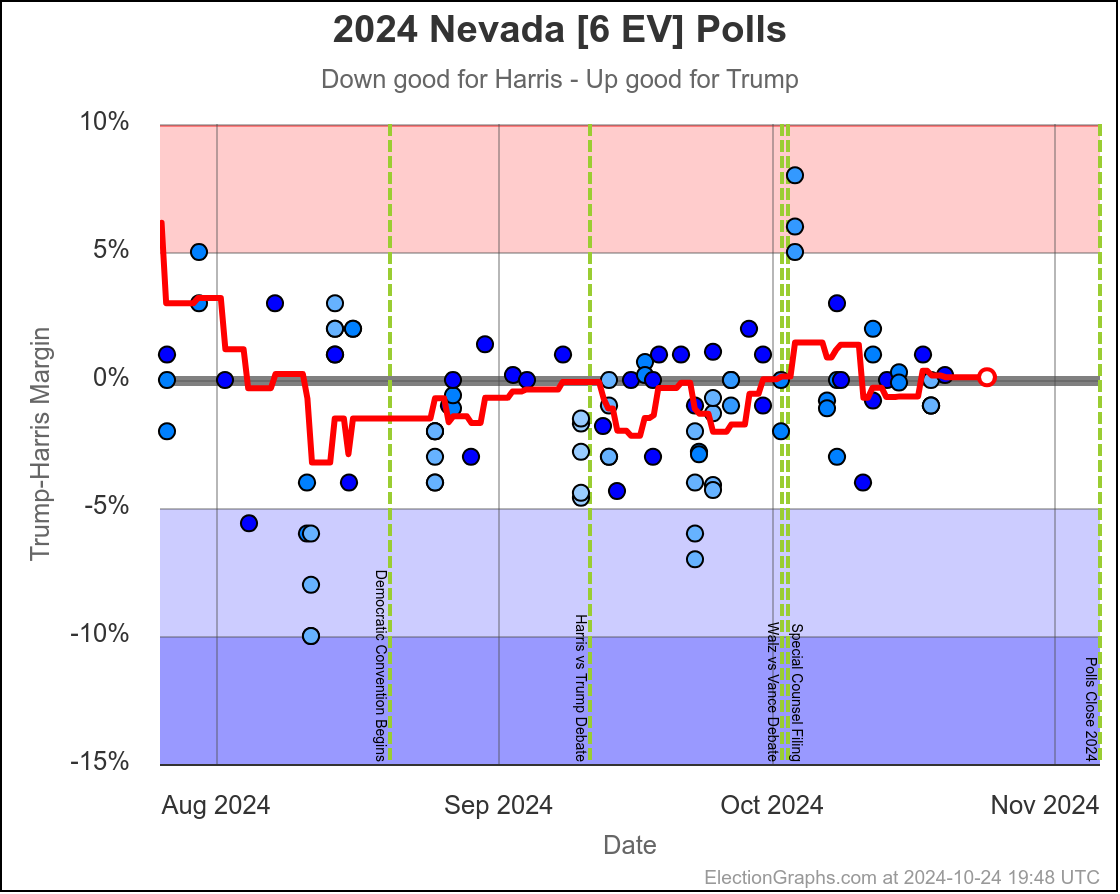
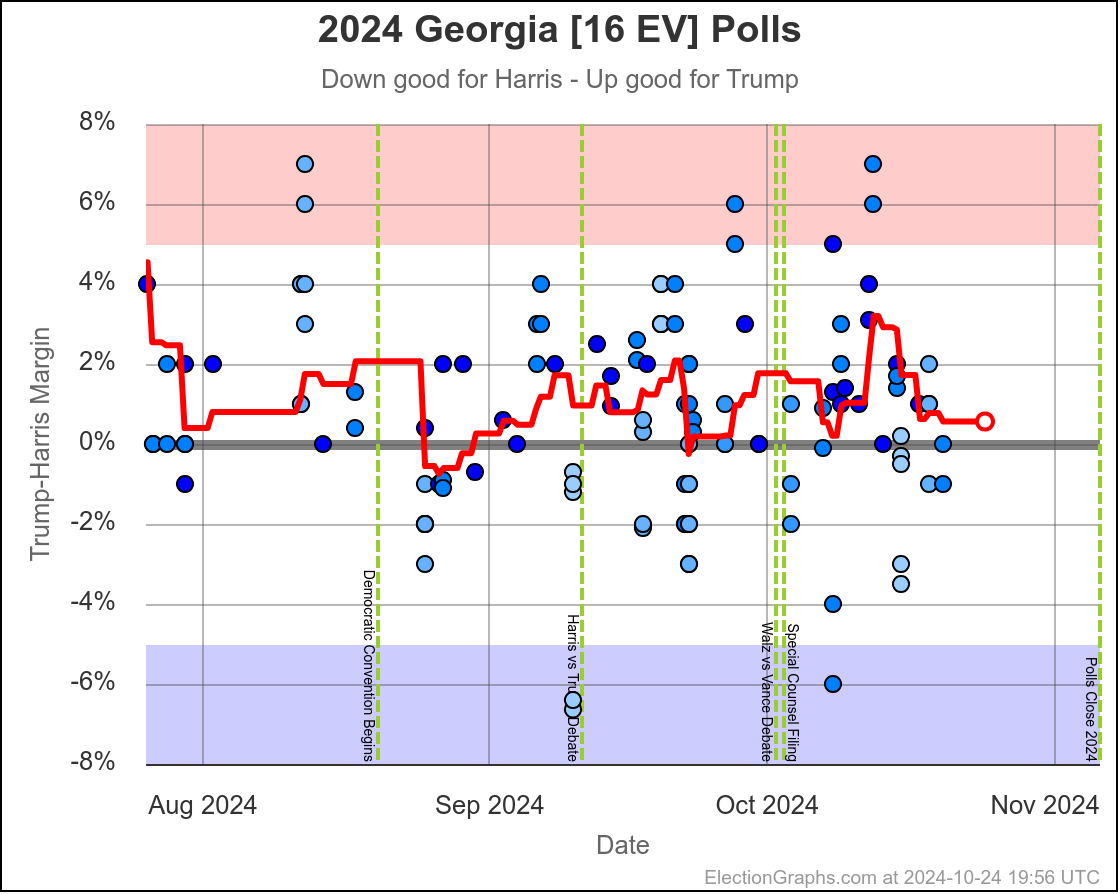
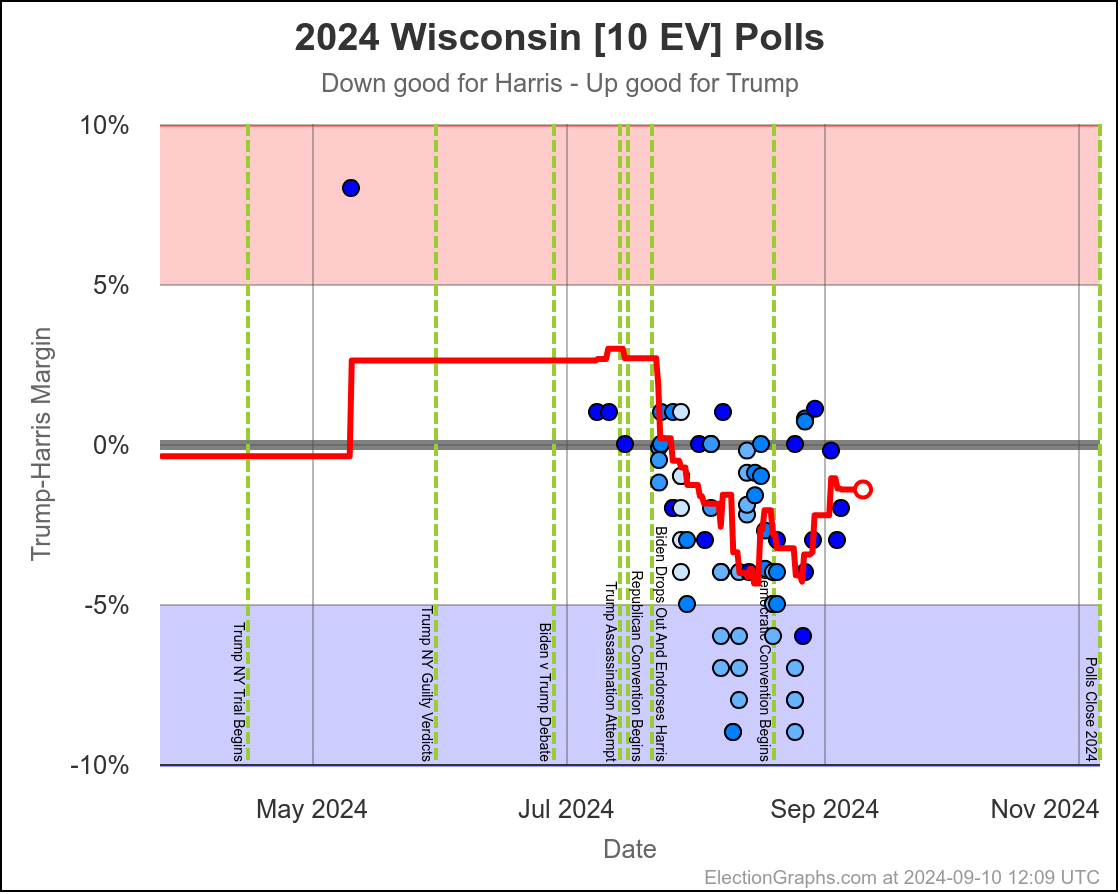
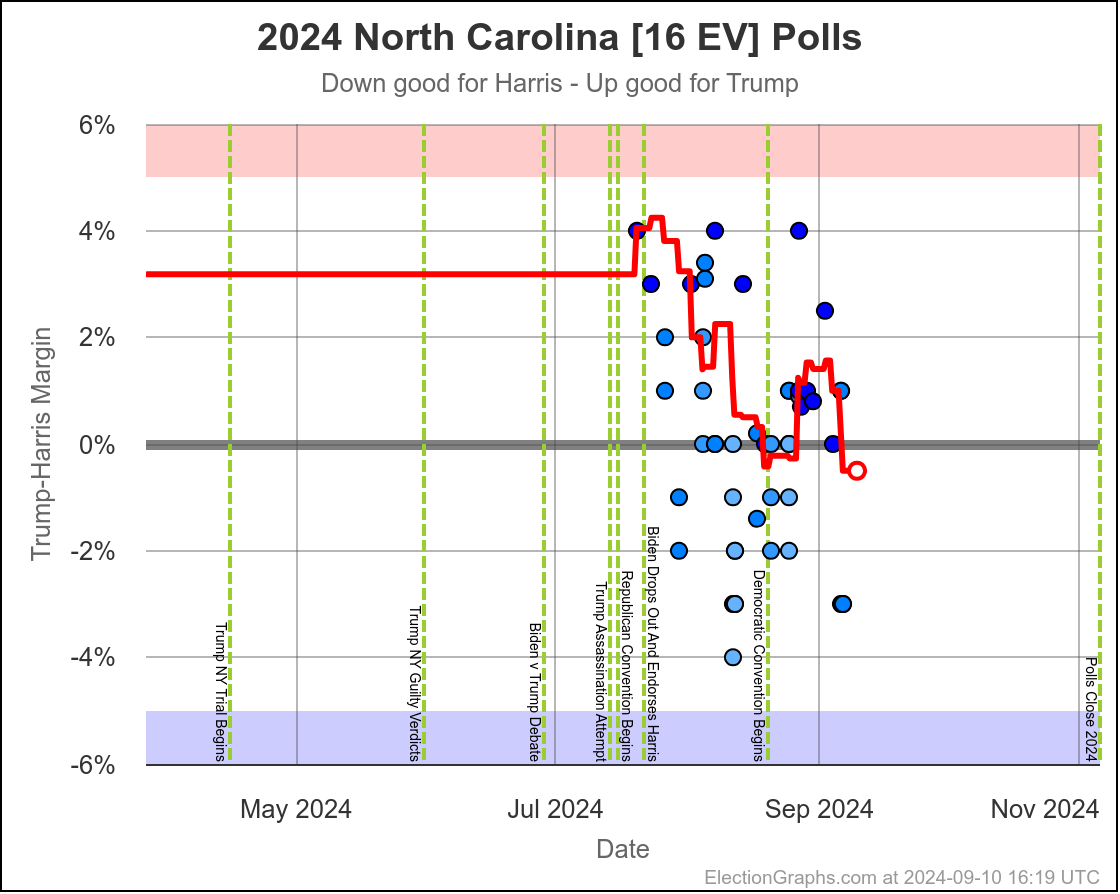
As before, let's also look at the recent trends in each of the 7 key states rather than just the final values, to see where these states have tended to be lately and how volatile the averages have been.


Bottom line on all of these, taking the polls at face value… so not worrying for the moment about systematic bias, or pollsters actively trying to influence the averages, I would classify the states like this:

True toss up: Wisconsin, Michigan, Pennsylvania

Probably Trump: Georgia, North Carolina, Nevada, Arizona

I'd previously put Wisconsin and Michigan at Probably Harris, but they look less so now.

We'll look at how restricting the averages to high quality pollsters only looks in a moment, but first lets look at how all this motion in the states translates into an overall national situation:


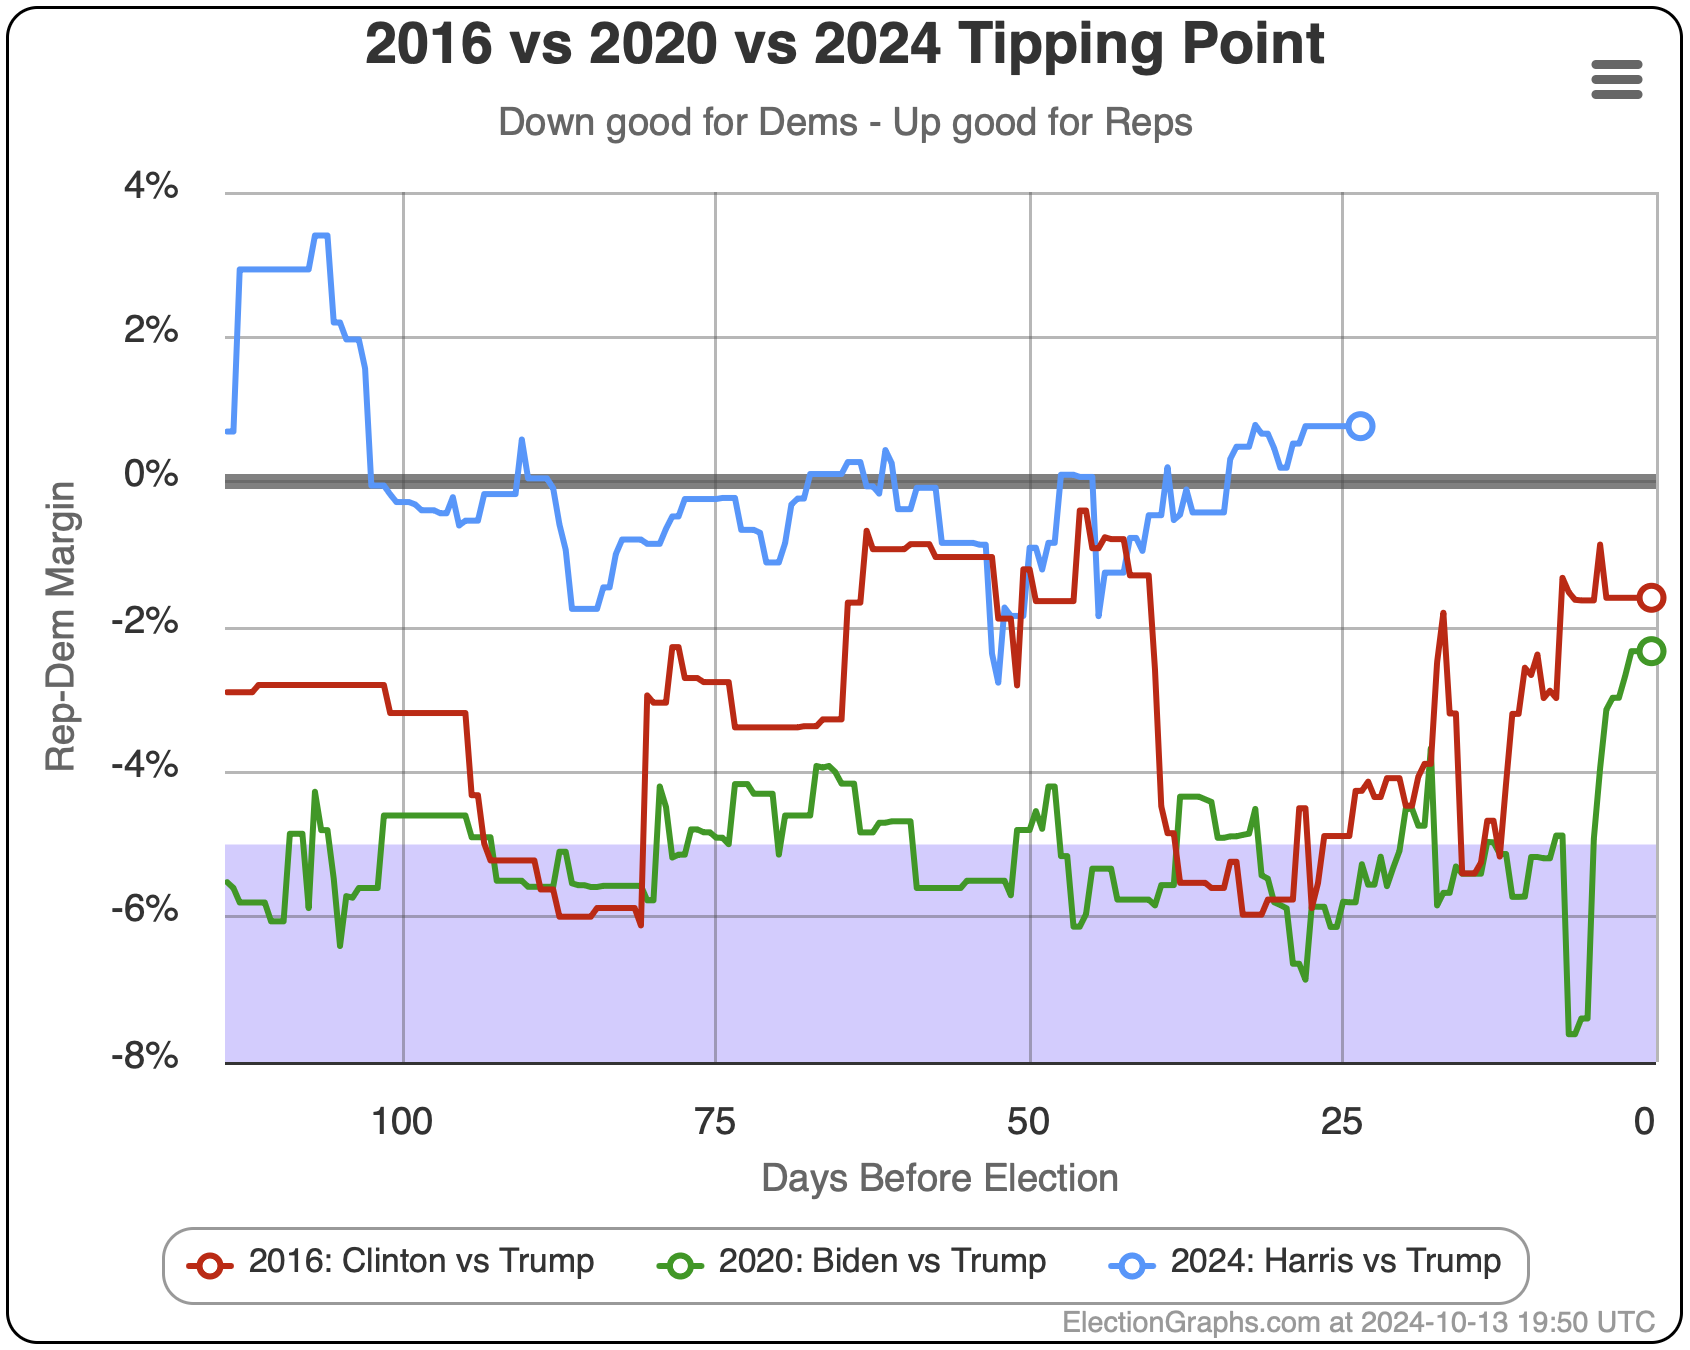
The envelope of the possible has stayed pretty stable for a long time. The tipping point chart is the one to look at, and basically it has just been bouncing around the zero line for a little over a month. This just tells us it is close. Which has been the theme forever.

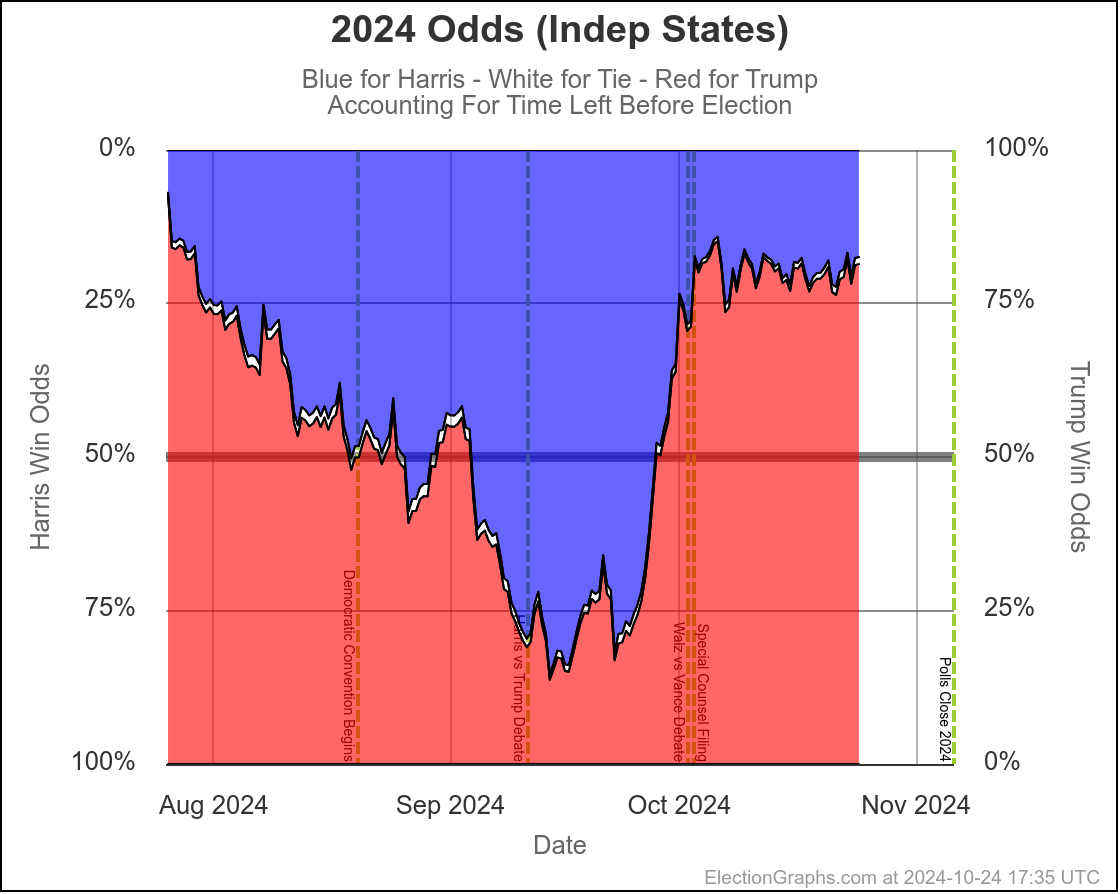
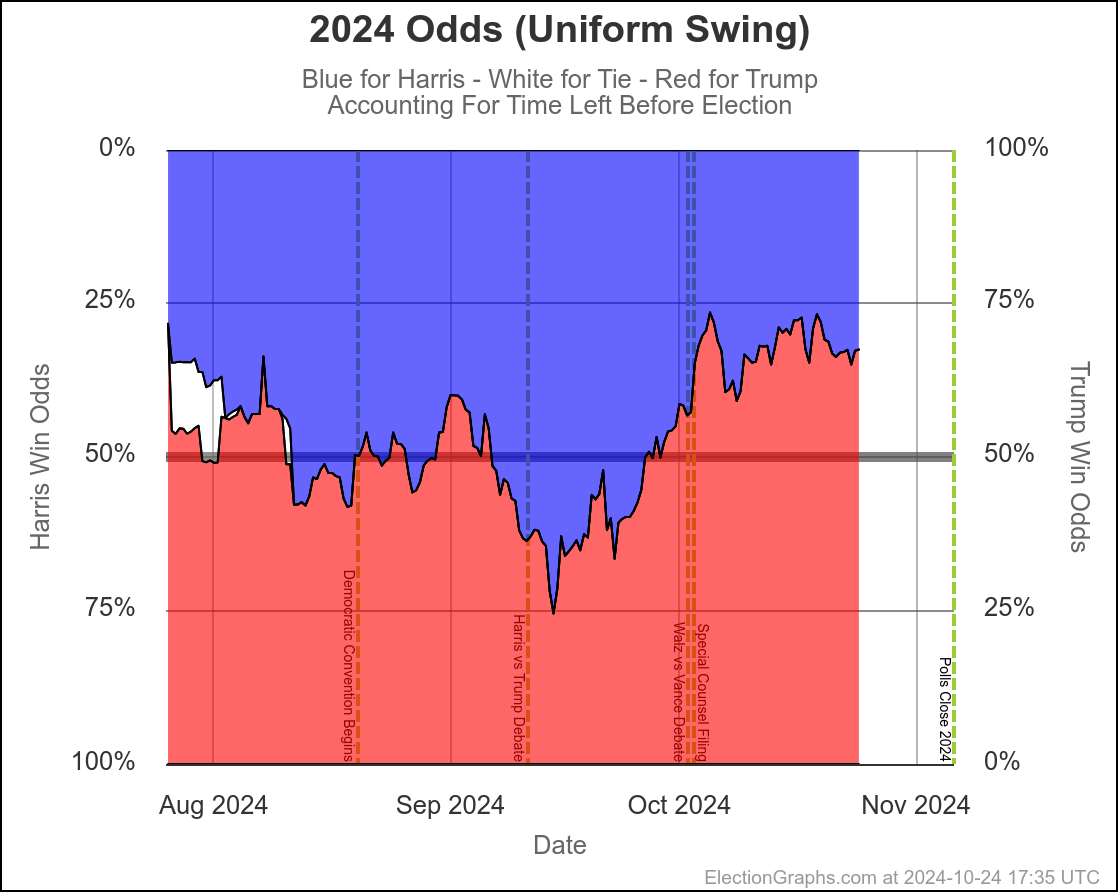
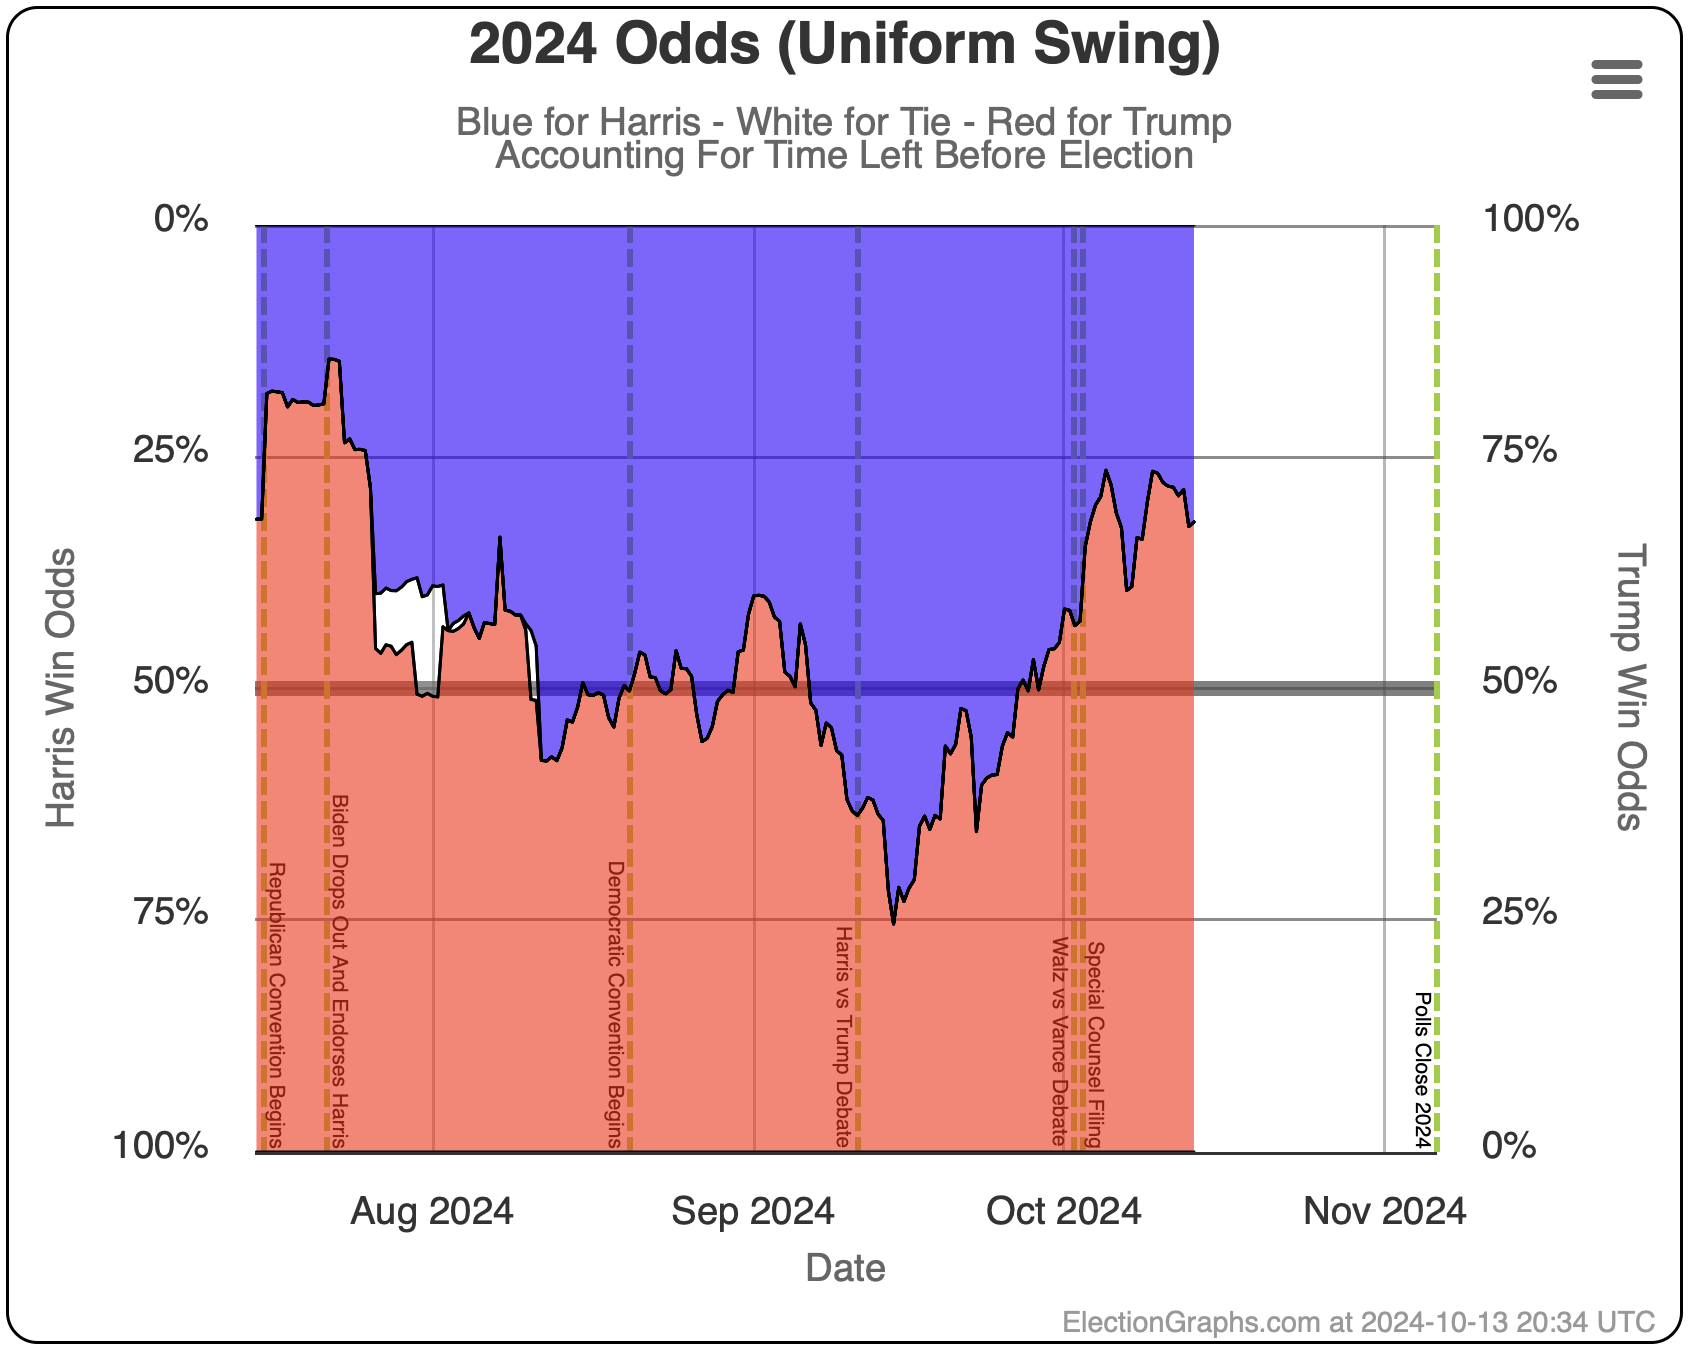
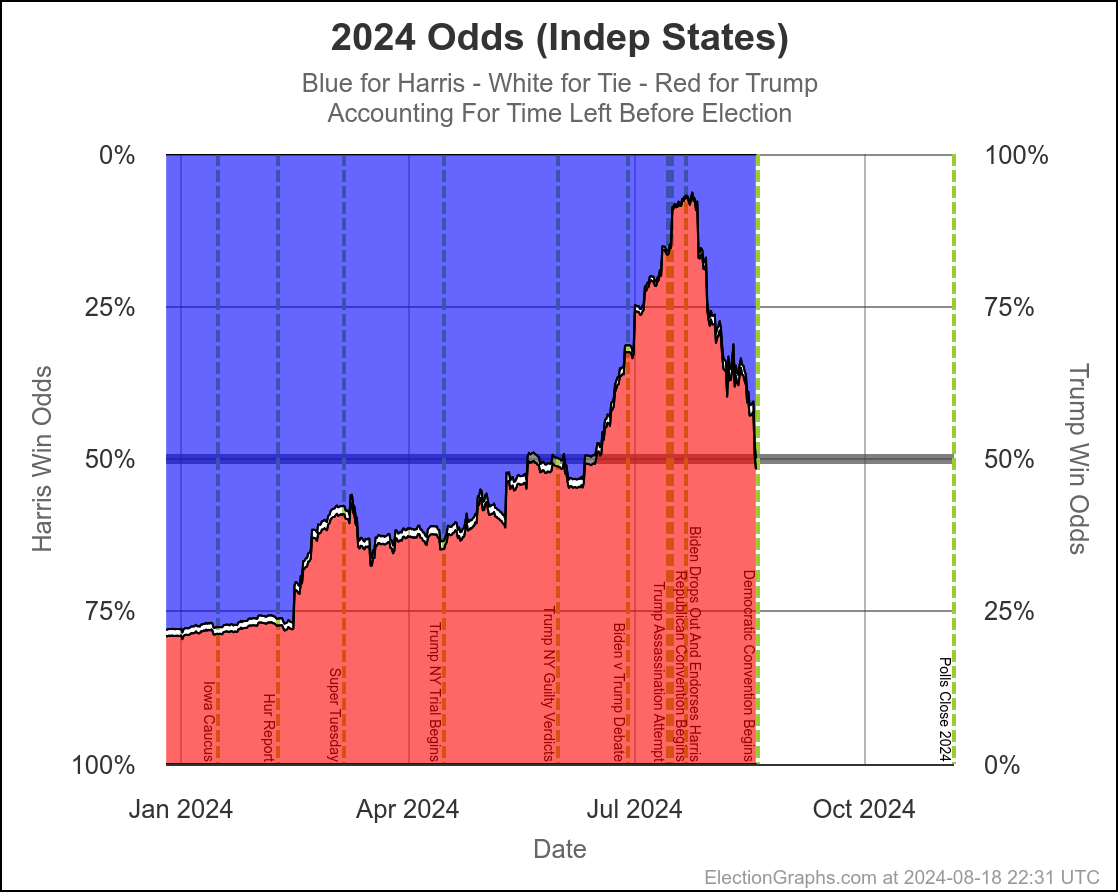
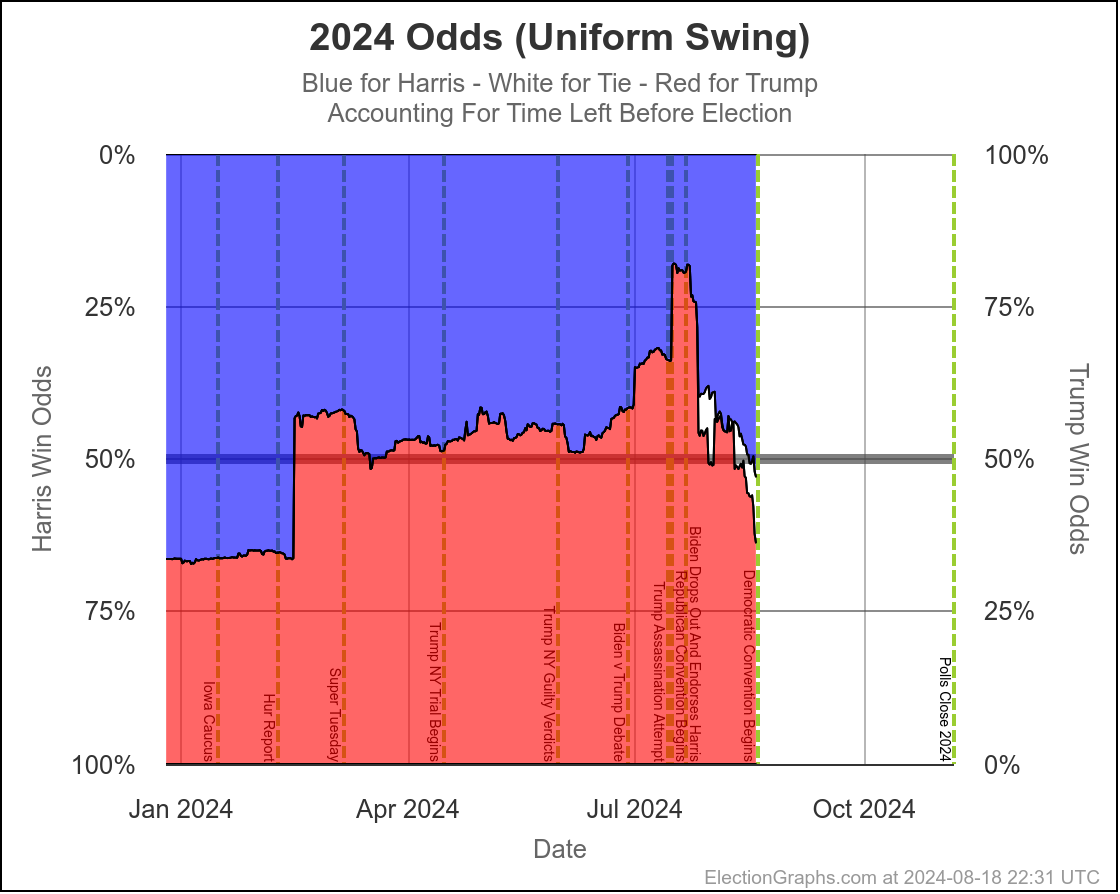
So let's look at my probabilistic models. Well, specifically lets look at the "Uniform Swing accounting for time left" model, because I think of the four, this is going to end up being the right one to look at, as I expect polling errors between states will be pretty correlated. That is, if pollsters are systematically missing something, or even if "junk pollsters" are gaming the averages, they will likely be doing so in the same direction across all the close states.


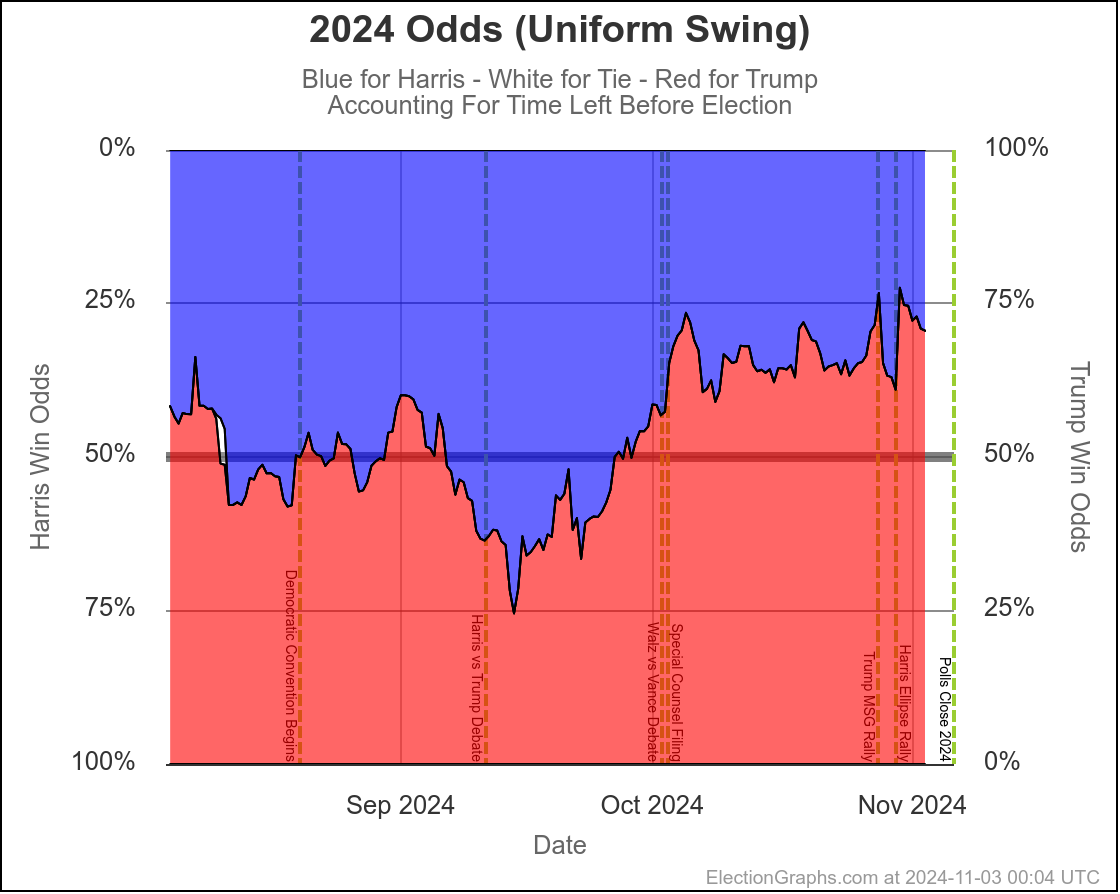
Just drawing a trend line and ignoring short term spikes, we've been roughly in the same situation for the last month. About 35% Harris, 65% Trump.

And this makes sense with the tipping point bouncing around the tie line for the last month, plus the fact that for the past 4 election cycles polls have underestimated Republicans more often than not. This is the main reason my odds for Harris are lower than other places, which anticipate polling error, but ignore the previous direction of those errors.

The others right now:

I'll add that Election Betting Odds (not based on polls, but on aggregating betting sites) currently has her at 41.2%.

So let's look at potential places where polls could be off here. The first thing that lots of people have talked about in the last few weeks is that "junk pollsters" (usually partisan) were flooding the averages and poisoning the results for anybody aggregating polls like we do.

First of all, they did this in 2020 and 2016 too, so this isn't new. And the polls still underestimated Trump in both those cycles. But this is still a good exercise.

So here is a table showing what the averages look like with All Polls (what EG does), vs if you restricted it to only polls with a 538 Pollster Rating of 2.5 or above. Also, by special request of my Curmudgeon's Corner cohost Ivan, another version further removing Atlas Intel, who he finds suspicious despite being rated highly by 538.

All Polls Rating>2.5 No Atlas
Wisconsin Harris+0.4% Harris+0.0% Harris+1.8%
Michigan Harris+0.2% Trump+0.8% Harris+1.2%
Pennsylvania Trump+0.1% Trump+1.0% Trump+0.2%
Georgia Trump+1.3% Trump+1.2% Trump+0.4%
North Carolina Trump+2.0% Trump+1.4% Trump+0.1%
Nevada Trump+2.5% Trump+2.4% Harris+1.1%
Arizona Trump+3.5% Trump+4.5% Trump+3.1%

So there is some movement in both directions, but the tipping point (in bold) remains Pennsylvania, and Trump remains ahead by a small margin using all three ways of selecting which pollsters to include.

Unlike the last time I did this analysis, the lower quality pollsters are actually HELPING Harris by moving the tipping point 0.9% in her direction. If you remove the lower quality pollsters AND remove Atlas, the tipping point still moves 0.1% toward Trump.

But regardless of any of that, the overall picture does not change. You still have 7 states with margins that are smaller than the typical polling error in recent elections. Let alone if we have an unusually large poll error.

There has been a lot of talk that polls may be systematically underestimating women and overestimating non-college whites, because A) nobody was fully accounting for female anger over Dobbs, and B) pollsters were overcompensating for their misses in 2016 and 2020. This may well be the case. But we won't know until the votes are counted. There might be an error in the other direction too.

So you still have a situation where any one of these seven states could end up going to either one of the two candidates. And therefore so could the whole election.

So. Guess you just have to watch the election results as they start to come in shortly. We'll find out when we find out. The polls have only told us that they are unable to predict the winner.

As I said at the beginning, anything from Harris winning by 100 to Trump winning by 86 should not be surprising.

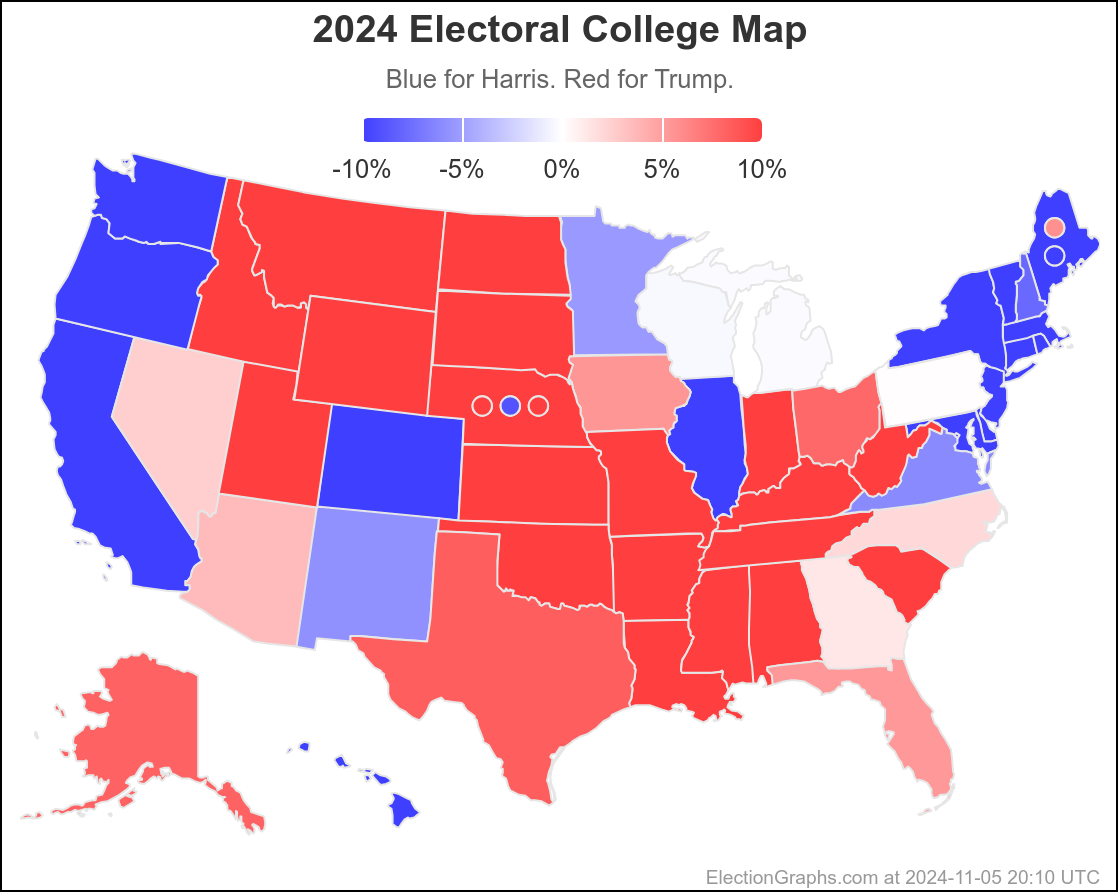
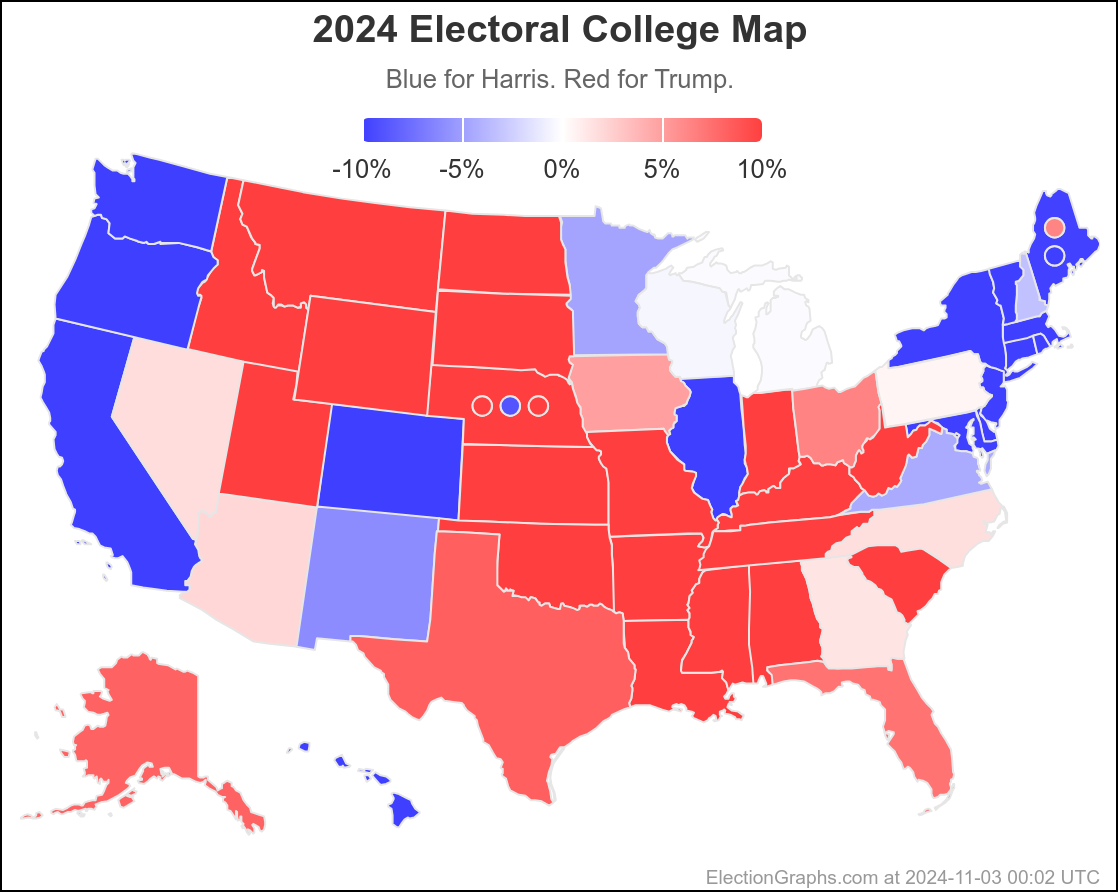
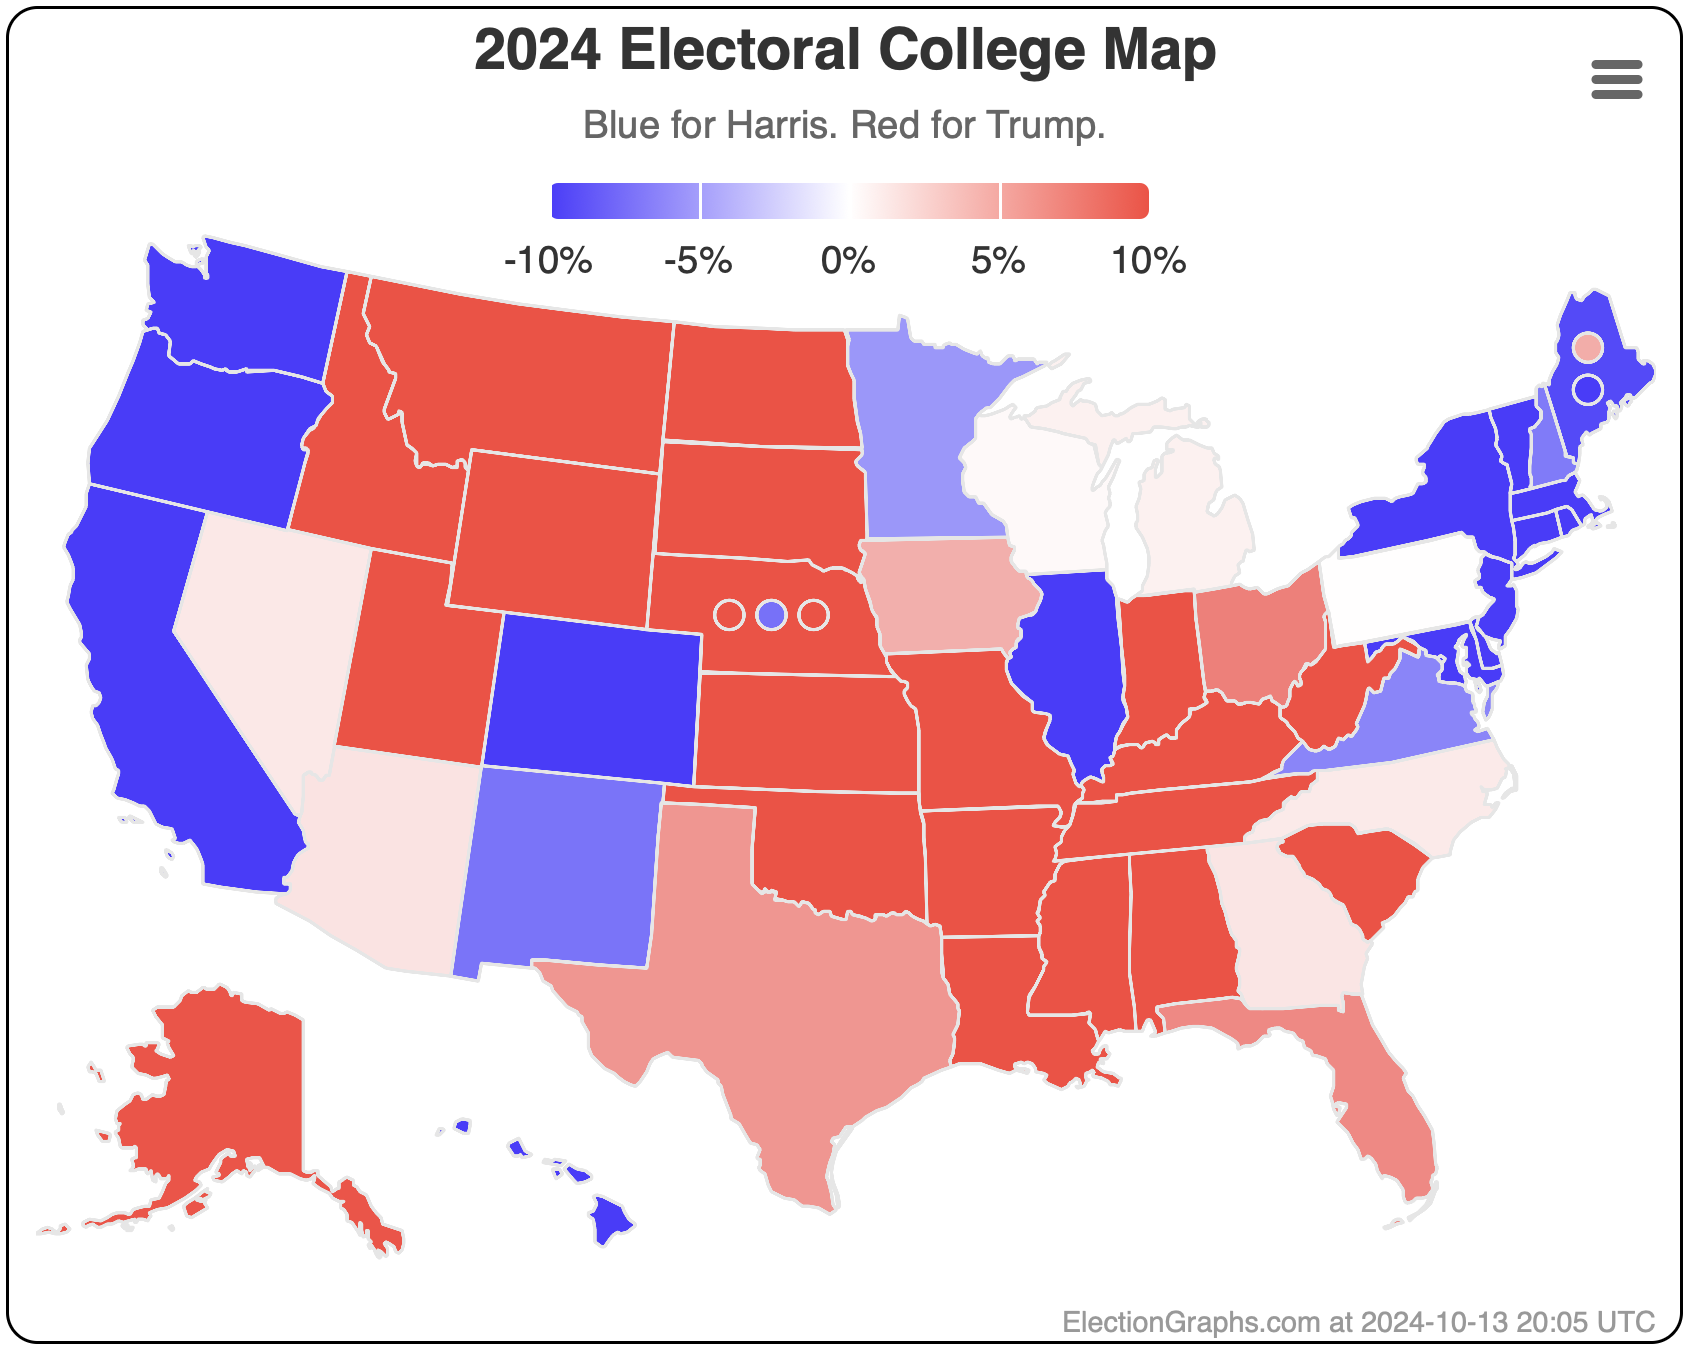
So here is my final map:

Parts of a couple of states have already closed their polls as I finish this blog post. The first full states close in less than 30 minutes. And then we start getting actual vote counts.

Again, my Curmudgeon's Corner cohost Ivan and I will be live streaming our reactions as the vote counting unfolds tonight over at the Curmudgeon's Corner YouTube channel. Starting in just a few minutes. Tune in!

And thank you all for following Election Graphs this cycle! See you again when it is time to ramp up for the 2028 cycle!

3 Days Out: Tick Tock Tick Tock

It has only been 3 days since my last post. Absent something unexpected, after this one I will probably only do one more post before actual election results start streaming in. That final one will be on Election Day proper, but before polls start to close, assuming things go as planned.

Also, for anybody interested, my Curmudgeon's Corner cohost Ivan and I will be live streaming our reactions as the situation unfolds on election night over at the CC YouTube channel. We expect to start at 0 UTC on election evening. That's 7 PM Eastern, 4 PM Pacific.

I'll be doing that instead of live blogging results here as they come in. I will probably also post updates over at @ElectionGraphs@newsie.social on Mastodon if you want to check in on that.

Note as you read this update, this is all based on how things stood as of 0 UTC on November 3rd when I started this blog post. Polls have been coming in fast and furious, so things may have changed by the time I finish this post, let alone by the time you read this. As usual, go to the Election 2024 main page for all the most up to date data.

OK. Lets do that TL;DR and try to keep it actually short this time:

Harris's position overall has improved a little bit since three days ago (the tipping point went from Trump by 1.1% to Trump by 0.5%), but the overall situation has not changed.

If the polls are underestimating Trump right now, he wins.

If the polls are underestimating Harris right now, she wins.

If the polls are actually close to right, then it all comes down to Pennsylvania, which could go either way.

Any outcome from Harris winning by 100 electoral votes to Trump winning by 140 should not be considered surprising. There are just that many close states right now.

If you restricted the whole analysis to only the highest quality pollsters, the tipping point would change from Trump by 0.5% to Harris by 0.3%. So the lower quality polls continue to make things look worse for Harris, by about 0.8% this time, and that would flip who is ahead.

The new Selzer poll showing Harris actually ahead in Iowa is a possible indicator that we are in the "polls are underestimating Harris" scenario. Maybe even by a large amount. (Even though it is only a single poll, it is one that has been extremely accurate in the past.) But we won't actually know until the votes are counted.

OK, let's start with how things have moved since last time.

Believe it or not, there have been TONS of new polls in the last few days.

Here is the new spectrum of states with margins under 10%:

Comparing to the status in the post from 3 days ago:

Moved toward Trump:

  • New Hampshire (4 EV): Harris by 8.0% -> Harris by 3.3% (Trump+4.7%)
  • Maine-CD2 (1 EV): Trump by 4.4% -> Trump by 6.4% (Trump+2.0%)
  • Minnesota (10 EV): Harris by 6.3% -> Harris by 4.7% (Trump+1.6%)
  • New Mexico (5 EV): Harris by 7.4% -> Harris by 6.0% (Trump+1.4%)
  • Wisconsin (10 EV): Harris by 1.3% -> Harris by 0.5% (Trump+0.8%)
  • Virginia (13 EV): Harris by 5.2% -> Harris by 4.5% (Trump+0.7%)
  • Nevada (6 EV): Trump by 1.1% -> Trump by 1.8% (Trump+0.7%)
  • Iowa (4 EV): Trump by 4.4% -> Trump by 5.0% (Trump+0.6%)
  • North Carolina (16 EV): Trump by 1.4% -> Trump by 1.7% (Trump+0.3%)
  • Maine-All (2 EV): Harris by 10.1% -> Harris by 9.9% (Trump+0.2%)

No movement:

  • Nebraska-CD2 (1 EV): Harris by 8.9%
  • Alaska (3 EV): Trump by 8.2%
  • Texas (40 EV): Trump by 8.4%

Moved toward Harris:

  • Michigan (15 EV): Trump by 0.2% -> Harris by 0.2% (Harris+0.4%)
  • Pennsylvania (19 EV): Trump by 1.1% -> Trump by 0.5% (Harris+0.6%)
  • Arizona (11 EV): Trump by 2.7% -> Trump by 2.1% (Harris+0.6%)
  • Florida (30 EV): Trump by 7.9% -> Trump by 7.3% (Harris+0.6%)
  • Ohio (17 EV): Trump by 7.3% -> Trump by 6.5% (Harris+0.8%)
  • Georgia (16 EV): Trump by 2.3% -> Trump by 1.4% (Harris+0.9%)

10 moving toward Trump vs only 6 moving toward Harris.

But because of WHICH states were moving in each direction, the tipping point moved from Trump by 1.1% in Pennsylvania to Trump by 0.5% in Pennsylvania, so an 0.6% overall movement toward Harris in the last few days.

But as I mentioned last time, in addition to "real" movement, there is just a lot of jitter as pollsters come in and out of the average. And I didn't do it last time, but this time I'll once again look at how these state by state averages would change if you only looked at pollsters rated 2.5 or more out of 3 on 538's pollster ratings instead of just including everything.

So let's look at that for the 7 key swing states for overall trends, then we'll see how pollster rating change the averages. This is going to look pretty similar to 3 days ago. I don't think my fundamental evaluation of the patterns in any of these states has really changed.

Just eyeballing the trend, absent a systematic polling error, Wisconsin looks like a small but fairly consistent Harris lead over the last month, albeit less of a lead than a couple of months ago.

Michigan also looks like it is bouncing around a narrow Harris lead. So I'd put it in her column.

Yup, Pennsylvania still looks like a tossup. It is slightly on the Trump side right now, but just a few days ago it took a dip into the Harris side. It seems to be somewhere between Trump by 1% and Harris by 1%, but where it will end up is anybody's guess.

Georgia looks pretty consistently like a narrow Trump lead. Harris needs a consistent poll error to win here.

Same with North Carolina.

I put this in the true toss up category last time. It is starting too look more like this might be a real move to the Trump side. But it was briefly on the Harris side within the last few days. And there are two points that look like outliers. So still going to consider it a tossup based on the trend. But this may yet change before my final post on Election Day.

Yeah, this looks like Trump too.

All of the evaluations above are just looking at the trends and assuming you can basically trust the poll average, but are trying to further smooth the curve. (If this is really needed, maybe I should just average over more polls, but we have used the same method for the average itself since 2008, so I'm not changing that at the moment.)

But where this ends up is just if you roughly trust the trends on all of these states, you just end up with the same conclusion as using the averages themselves. Pennsylvania is the tipping point, it could go either way, and the result of the election as a whole will very likely just depend on what ends up happening in Pennsylvania.

OK, now for "what happens if you only include super highly rated pollsters" question.

All Polls Rating>2.5 Delta
Wisconsin D+0.5% D+1.2% D+0.7%
Michigan D+0.2% D+0.8% D+0.6%
Pennsylvania R+0.5% D+0.3% D+0.8%
Georgia R+1.4% R+1.1% D+0.3%
North Carolina R+1.7% R+0.9% D+0.8%
Nevada R+1.8% R+0.2% D+1.6%
Arizona R+2.1% R+3.6% R+1.5%

So the "junk pollsters" improve Trump's numbers in 6 out of 7 states. On average restricting to only the highest quality pollsters moves things toward Harris by 0.5%.

But looking specifically at the tipping point, this moves it from Trump by 0.5% to Harris by 0.3%, so the lower quality pollsters are boosting Trump's apparent position by 0.8%, slightly more than the 0.6% effect when we were at the 12 day mark.

And in this case, this would move the "expected case" from a Trump win to a Harris win. In either case though, we're talking about a tiny margin. The tipping point is close either way. And in either case the result comes down to which side of the line Pennsylvania ends up on.

Going back to the averages as they are, the envelope of possibilities has evolved like this:

The main things to note that have changed since last time are that New Hampshire, Virginia, and Minnesota have all had Harris's lead fall under 5%, so they are now included in the Trump best case.

Also Trump's leads in Iowa and Maine-CD2 both increased to over 5%, so they have been removed from Harris's best case.

You'll also note that for a brief time between Trump's closing argument event at Madison Square Garden and Harris's closing argument event at the Ellipse Harris took the lead in the "expected case" where each candidate wins every state they lead for even a small amount of time. This seemed to potentially be a negative reaction to the MSG event, but then balanced by a move back in the other direction a couple of days later.

This may change again. But of course there are only a couple more days left for any additional changes.

In any case, the range of "don't be surprised" possibilities now stretches from Harris by 100 EV to Trump by 140 EV.

Looking at the tipping point:

Not bothering to compare with 2016 and 2020 again. Harris is still nowhere near where either Biden or Clinton were 4 and 8 years ago.

But doing the same sort of thing we did with the state charts, ignoring the jitters up and down and looking at the overall trend, this has just been bouncing roughly between Harris by 0.5% and Trump by 0.5% since the start of October. Before that we seemed to have a consistent Harris lead. But now, we're just hugging the center line, and have been for weeks.

OK. Time for the probabilistic view. I've said in previous posts that while the "true value" is somewhere between my Independent States and Uniform Swing views, it is closer to Uniform Swing because it is very likely that if the big pollsters are underestimating once side or another, the same type of error will show itself across all the close states. So lets just look at the Uniform swing view today:

Notice that the 95% confidence interval is very similar to the bounds of the categorization model envelope. In any case, this shows EG giving Harris a 29.4% chance of winning at the moment.

By comparison, here are what some of the other sites have right now:

I'll add that Election Betting Odds (not based on polls, but on aggregating betting sites) currently has her at 47.2%.

Why am I so much lower for Harris? Basically because my models look at the past polling misses from 2008 to 2020 and concludes that on average polls have tended to underestimate the Republican in the close states over that time period, so it is more likely than not to happen again. To give her even odds, the EG model would need to see Harris leading in the tipping point by about 1.2%. And of course that is not where things are.

I believe the other sites basically assume there will be polling error, but that it is equally likely to favor either candidate.

In fact, there seem to be signs that the polling error might go the other way and be underestimating Harris this time.

For instance early vote numbers showing disproportionate numbers of women voters for instance, along with polling showing a large gender gap with women favoring Harris and men favoring Trump, and polling showing an enthusiasm gap favoring Harris.

The most recent thing along these lines hit the news right before I started this blog post though, and that is Iowa:

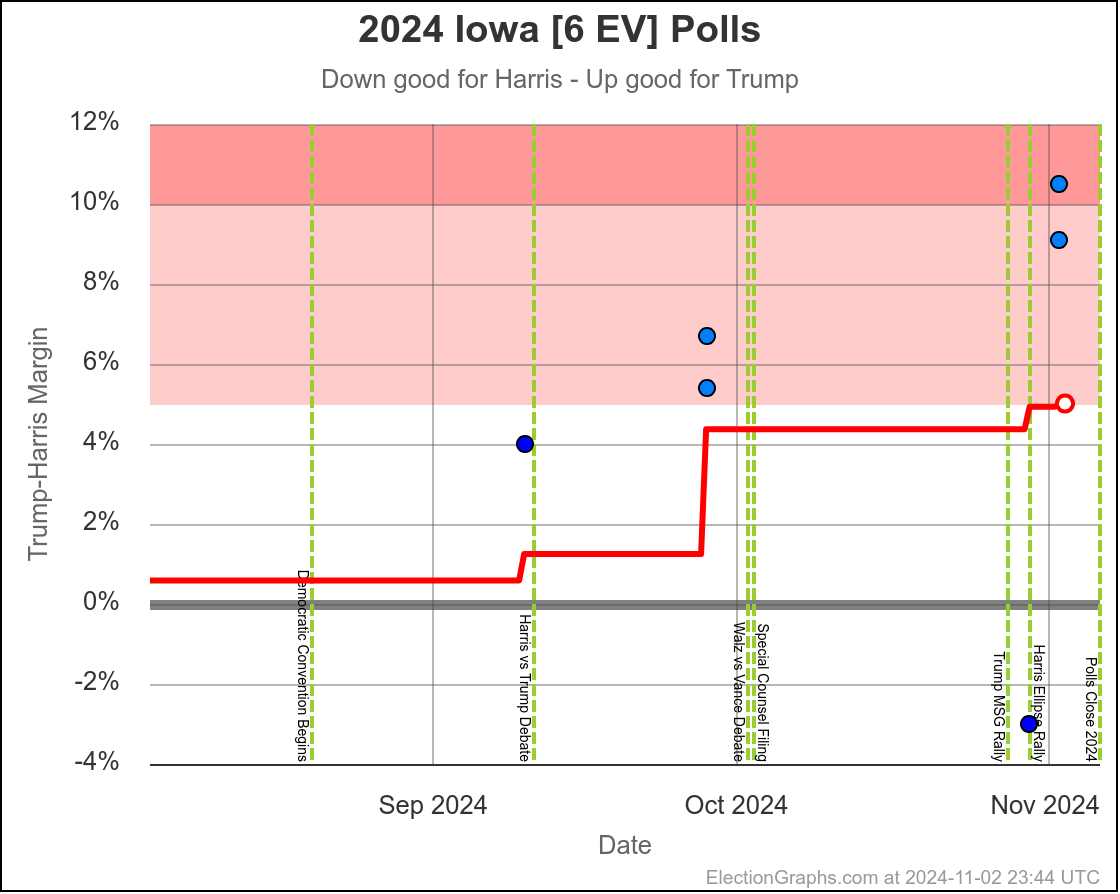
Iowa has been very sparsely polled this cycle, and the EG poll average has been tending toward Trump as the actual polling washed out the 2008 and 2012 Obama wins there, and replaced them with polls showing the much redder version of Iowa that people expected these days.

And in fact there was an Iowa poll by Emerson released Saturday that showed Trump ahead by about 10% in Iowa.

But see that one point in the bottom right hand corner? That is Selzer.

Late on Saturday afternoon, Selzer released their Iowa poll and it seems like the internet exploded. That poll shows Harris LEADING by 3%. (This followed a Selzer poll in September showing her behind by 4%, which was already closer than expected.)

The average still has Trump ahead by 5.0% though, and with an upward trend, so why does anyone care?

Well, just because of Selzer's track record. They are considered the gold standard poll in Iowa

From 2012 to 2022 in races for President, Senator, and Governor in Iowa, Selzer's final poll has been 2% or less off from the actual result five out of seven times. (The other two were 3% and 5% off.) This is an amazing level of accuracy for a pollster. When Selzer has looked like an outlier from other polls in the past, they have turned out to be the ones that were right.

And the thing is, if Iowa is CLOSE, let alone if Harris is actually winning in Iowa, it would be almost impossible to believe that scenario unless Harris were already ahead in most if not all of the other swing states, and probably making other red states like Ohio, Florida, Alaska, and Texas competitive too.

(I'll note that while they have not been from pollsters with a reputation like Selzer, there have been recent isolated one off polls showing Harris behind by 5% or less in Ohio, Florida, Texas, and even Kansas.)

Now, it may be that this time is the time that Selzer is actually going to have a big outlier and just be flat out wrong. That could happen.

But if Selzer is right… then it would imply that a lot of the other pollsters are wrong. If Selzer is right, then we may be seeing a situation close to… or maybe even beyond, what I have as Harris's best case of a 100 EV win based on the categorization model.

If Selzer is right, it essentially predicts not just an Iowa win, but a Harris landslide nationwide.

That is why everybody's head spun when they saw the Selzer poll numbers.

Even if it doesn't portend a landslide, it may indicate that other polls are underestimating Harris, and that would be an indicator that maybe she's actually ahead, and maybe it isn't going to be a nail biter after all.

Or maybe Selzer is just wrong.

Anyway, that's about it for the analysis this time around, so here is the new map:

I'll do one more blog post once we are under 1.0 days left. In the mean time, check the Election 2024 main page for updates.

And yeah, as I predicted at the start of this post, a whole bunch of new polls were released while I was writing this, so it is already out of date.

And so it goes. (Shout out to Linda Ellerbee.)

2.7 days left.

Almost done.

6 Days Out: More of the Same

It has been 6 days since my last post.

Here comes the TL;DR:

The race remains about the same as it has been since the end of September. Things bounce around week to week based on the most recent polls in each state, but the overall picture has not changed.

Specifically, there are so many close states that the range of "unsurprising" results ranges from a healthy Harris win to a healthy Trump win in terms of the Electoral College. And everything in between.

Having said that, at the moment Trump is favored because he is ahead by small margins in my poll averages in most of the critical swing states, and this lead has increased a bit in the last 6 days.

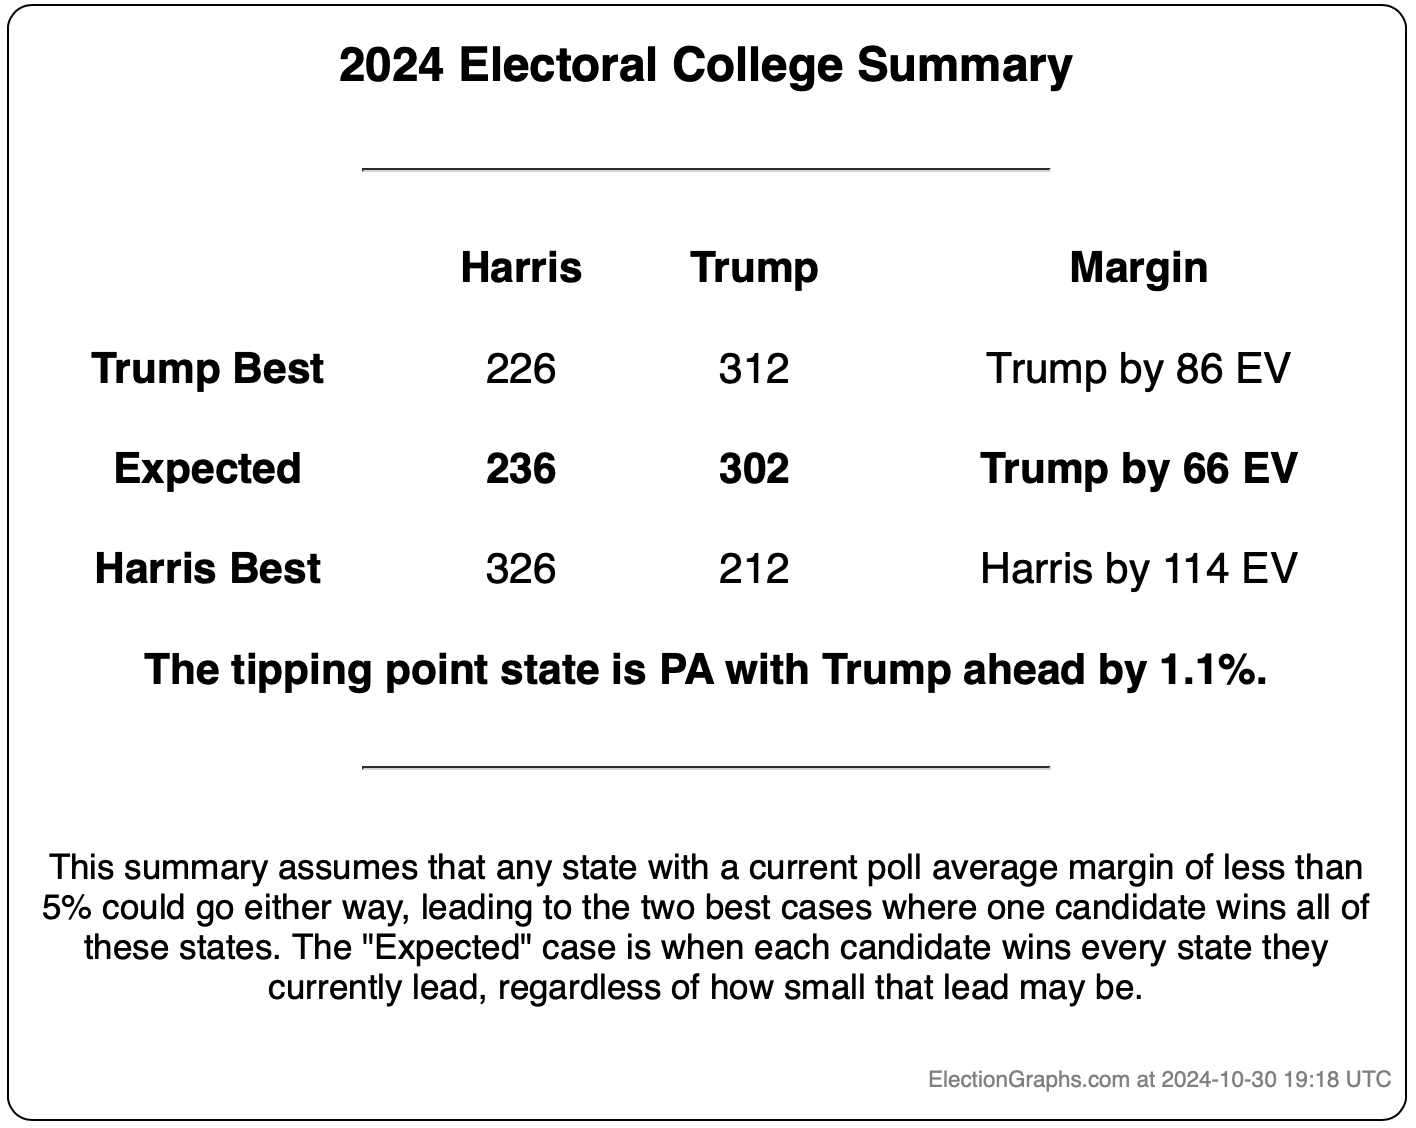
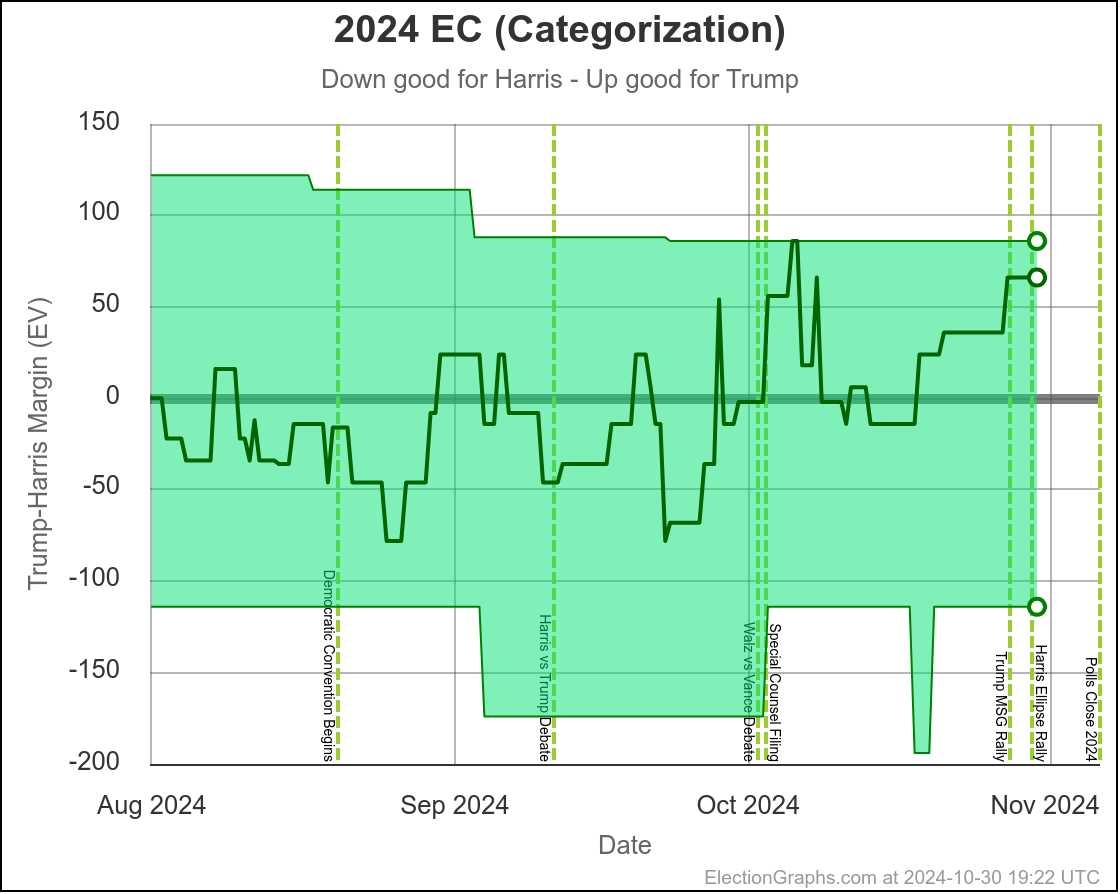
If you just give every state to the leader in my poll averages, no matter how small the lead, Trump wins by 66 electoral votes. But if you give everything where the margin in my averages is under 5% to one candidate or the other the range of outcomes is from Harris winning by 114 EV to Trump winning by 86 EV.

My probabilistic models estimate Harris's chances of winning as between 5.3% (Independent State Model) and 18.0% (Uniform Swing Model) at the moment, using polling errors from 2008 to 2020 to judge how far off polls are likely to be and in which direction. Since poll errors tend to correlate, I'd put the "real" number closer to the 18% than the 5%.

These numbers essentially assume that my poll averages in the close states will once again underestimate Trump like they did in 2016 and 2020. But all it would take is a small polling error in the opposite direction to give the win to Harris.

At 18% Harris is the underdog, but that is still a high enough number that nobody should be surprised by a Harris win. And with so many states so close, it would not even be a surprise if that win was substantial.

Because of the nature of the Electoral College, "too close to call" does not necessarily mean the final result will be close. It just means we can't tell reliably what is going to happen because too many states could easily go either way.

My TL;DR's are getting longer. Sorry.

OK, so let's get into the meat for people who want more details. Starting with how the spectrum of states with margins under 10% has changed since last time.

On October 24th at 18 UTC, it looked like this:

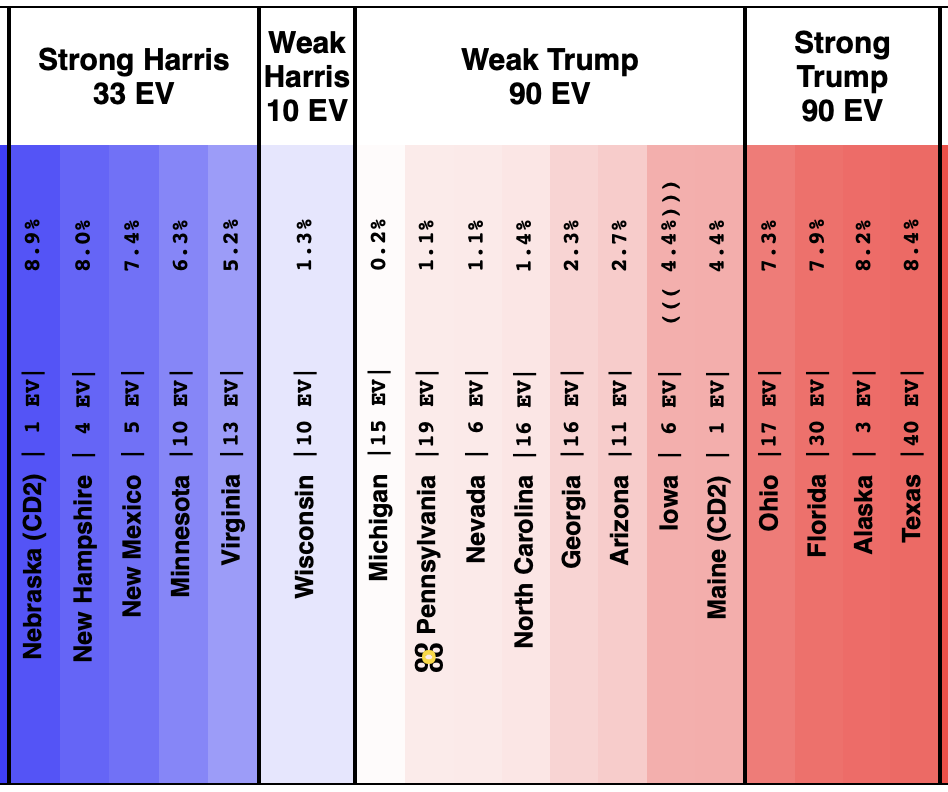
And as of when I started this post at 21 UTC on October 30th:

So lets look at the changes:

Moved toward Trump:

  • Texas (40 EV): Trump by 6.6% -> Trump by 8.4% (Trump+1.8%)
  • Georgia (16 EV): Trump by 0.6% -> Trump by 2.3% (Trump+1.7%)
  • Arizona (11 EV): Trump by 1.2% -> Trump by 2.7% (Trump+1.5%)
  • Florida (30 EV): Trump by 6.6% -> Trump by 7.9% (Trump+1.3%)
  • Ohio (17 EV): Trump by 6.1% -> Trump by 7.3% (Trump+1.2%)
  • Virginia (13 EV): Harris by 6.3% -> Harris by 5.2% (Trump+1.1%)
  • Nevada (6 EV): Trump by 0.1% -> Trump by 1.1% (Trump+1.0%)
  • Michigan (15 EV): Harris by 0.3% -> Trump by 0.2% (Trump+0.5%)
  • Minnesota (10 EV): Harris by 6.4% -> Harris by 6.3% (Trump+0.1%)
  • North Carolina (16 EV): Trump by 1.3% -> Trump by 1.4% (Trump+0.1%)

No movement:

  • New Mexico (5 EV): Harris by 7.4%
  • Iowa (6 EV): Trump by 4.4%
  • Maine-CD2 (1 EV): Trump by 4.4%

Moved toward Harris:

  • Pennsylvania (19 EV): Trump by 1.2% -> Trump by 1.1% (Harris+0.1%)
  • Alaska (3 EV): Trump by 8.4% -> Trump by 8.2% (Harris+0.2%)
  • New Hampshire (4 EV): Harris by 7.4% -> Harris by 8.0% (Harris+0.6%)
  • Wisconsin (10 EV): Trump by 0.0% -> Harris by 1.3% (Harris+1.3%)
  • Nebraska-CD2 (1 EV): Harris by 7.3% -> Harris by 8.9% (Harris+1.6%)

And with all of this, the tipping point moved from Trump by 0.6% in Georgia to Trump by 1.1% in Pennsylvania.

For the most part, all this movement is probably mostly noise as polls come in and out of the average. To judge trends, lets look at the charts for the seven key states:

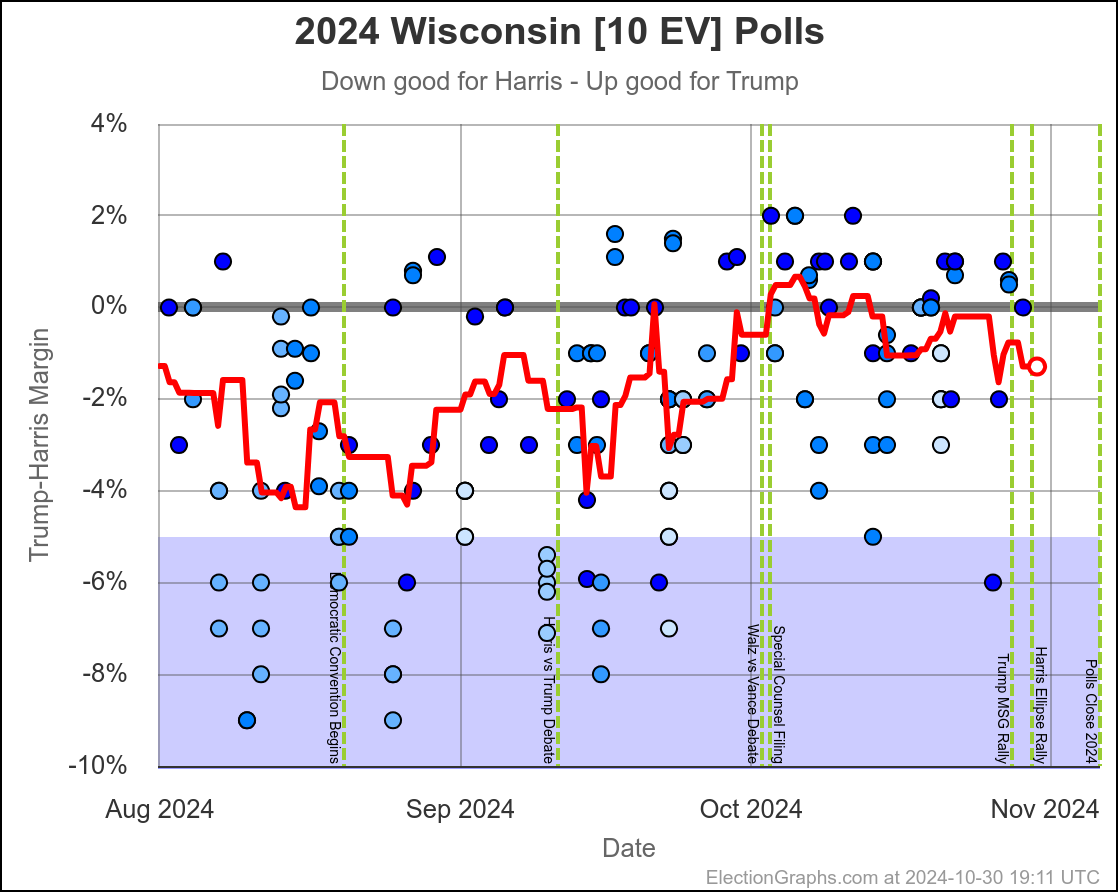
Wisconsin has mostly been just barely Harris, probably around a 1% lead lately. You'd probably guess Wisconsin would go Harris even with no polling error.

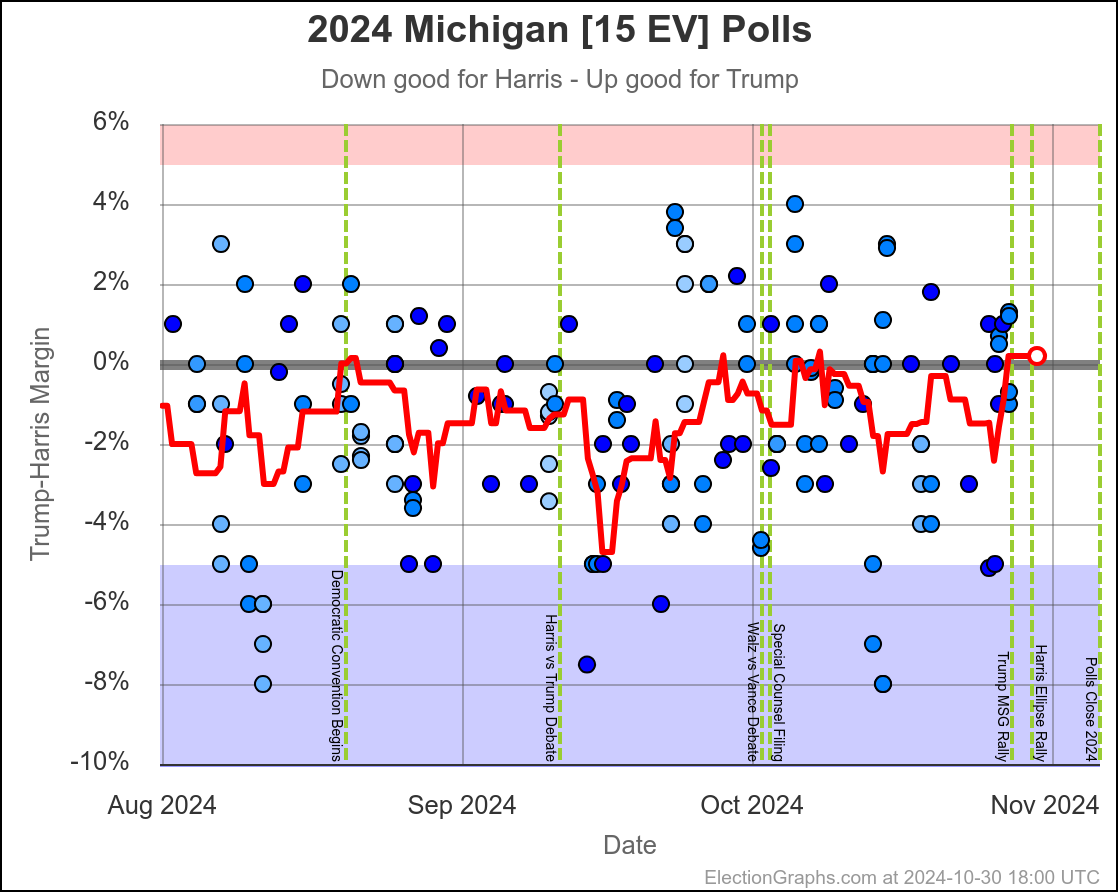
Michigan is just barely on the Trump side of the line, but seems to mostly have been a narrow Harris lead, again probably about 1%. So again, this is looking like a Harris state even without a polling error.

Pennsylvania looks like a true tossup right now. A month ago I would have put it in the same category as Wisconsin and Michigan, but since the end of September it seems to be hugging the center line, with maybe a slight trend toward Trump. At this point, I really wouldn't want to guess.

My probabilistic analysis gives Trump an 81.6% chance of winning Pennsylvania right now, but again, that assumes that polls are once again underestimating Trump. If you take the polls at face value, I'd call it a true toss up.

I'd put this in the same category as Pennsylvania. If the poll averages don't have a systematic error, this just looks like a complete tossup.

Harris has only rarely actually led in North Carolina. If polls are systematically underestimating Harris, maybe she wins here. Otherwise give this to Trump.

Same with Georgia.

And Arizona.

Where does this put us?

If you trust the poll averages, and assume it isn't systematically underestimating either candidate, we're looking at Harris with 251, Trump with 262, and 25 electoral votes I said were still too close to call.

If you give Harris Nevada's 6 EV, it isn't enough to win.

So yeah, in this scenario it all comes down to what happens in Pennsylvania.

But of course, this is just eyeballing the trends and assuming no systematic error. You get the much wider range of possibilities when considering that really ANY of these states could go either way, allowing for that systematic error, or last minute changes that happen too close to the end for the averages to react:

This envelope of possibilities has evolved like this:

The set of close states just hasn't changed that much this whole time. The lead within those states has moved around, and has indeed trended toward Trump in the last month.

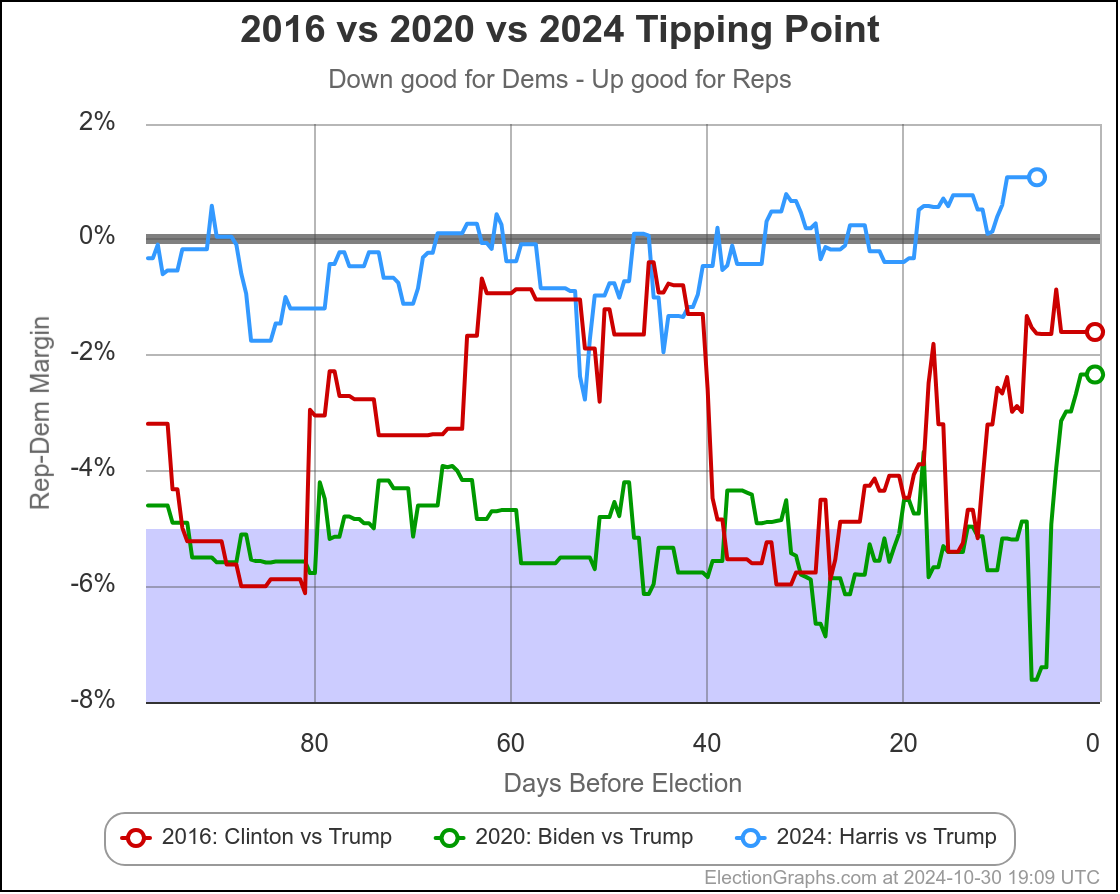
Let's look at that in terms of the tipping point. Once again I'll include lines for 2016 and 2020 for comparison:

Roughly speaking, for a while Harris was leading narrowly, then things were hugging the tie line for a little bit, but in the last couple of weeks it looks like Trump has pulled ahead.

All these are still tiny margins though. The type that can easily be wiped out by a few days of polling.

The thing that has been consistently the case almost the whole time though, that undoubtedly makes the Trump team feel great and the Harris team nervous is the comparison with 2016 and 2020. Harris has consistently underperformed Biden's polling in 2020 and Clinton's polling in 2016. Biden barely won. Clinton lost.

Absent any change in the polls in the next few days, a Harris win would mean that this time the polls underestimated Harris instead of underestimating Trump.

But it doesn't have to be big. Move all the poll averages 1.5% from where they are toward Harris, and you go from Trump winning by 66 EV to Harris winning by 46 EV.

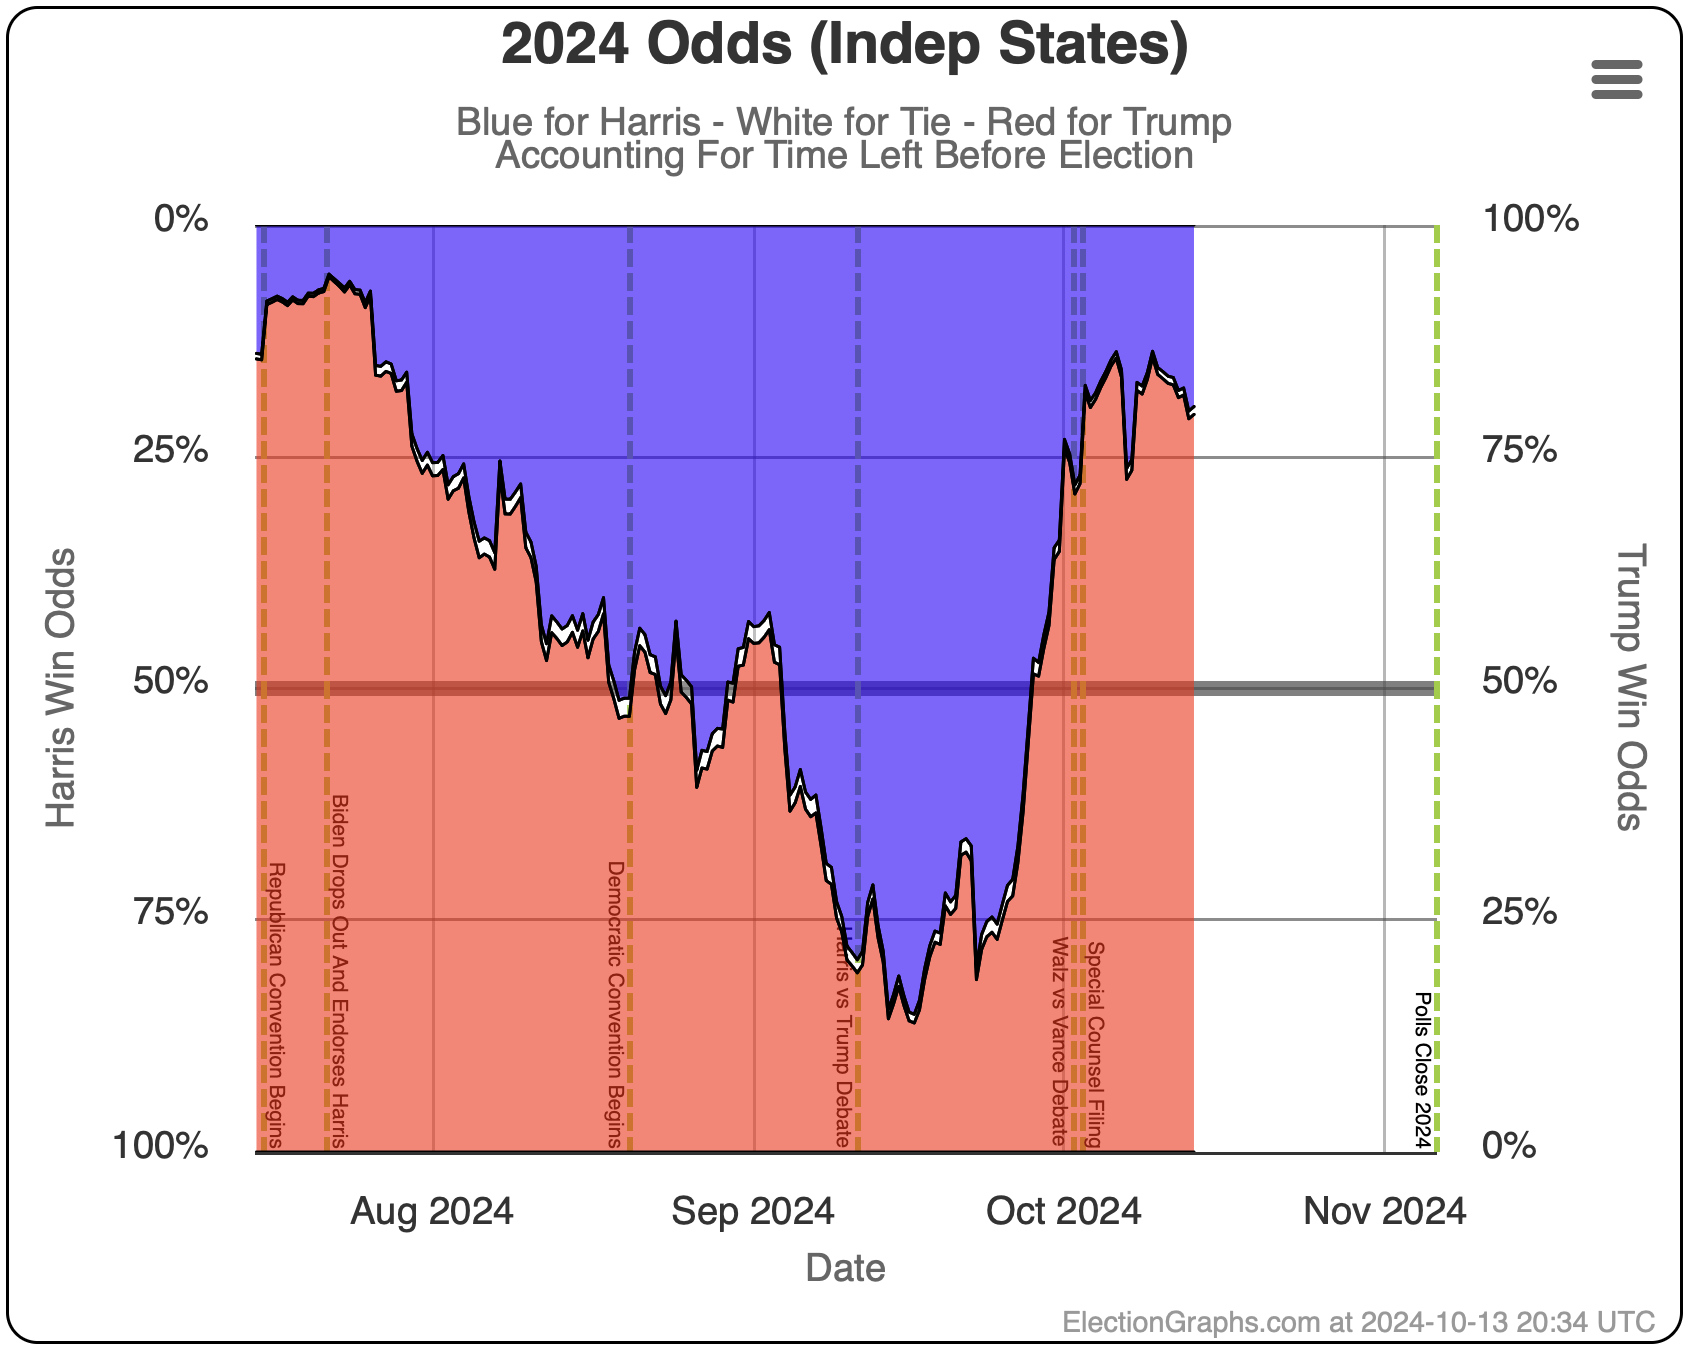
OK, here come the trends in my two probabilistic models:

In the last few weeks, polls have moved a little toward Trump, and of course tick tock, the time to actually change public opinion is running out.

So Harris's chances have been going down and Trump's have been going up.

Things look very different than they did in September when looking at these probabilities. But the right way to look at this is moving from too close to call with Harris favored, to to close to call with Trump favored. Either way, we're still too close to call.

And again, my models at 5% to 18% Harris win odds are more pessimistic for her than other folks, because I am explicitly saying "over the last 4 presidential election cycles polls have tended to underestimate the Republican more often than not, so they probably will this time too". Without this assumption, here are what a few other folks give:

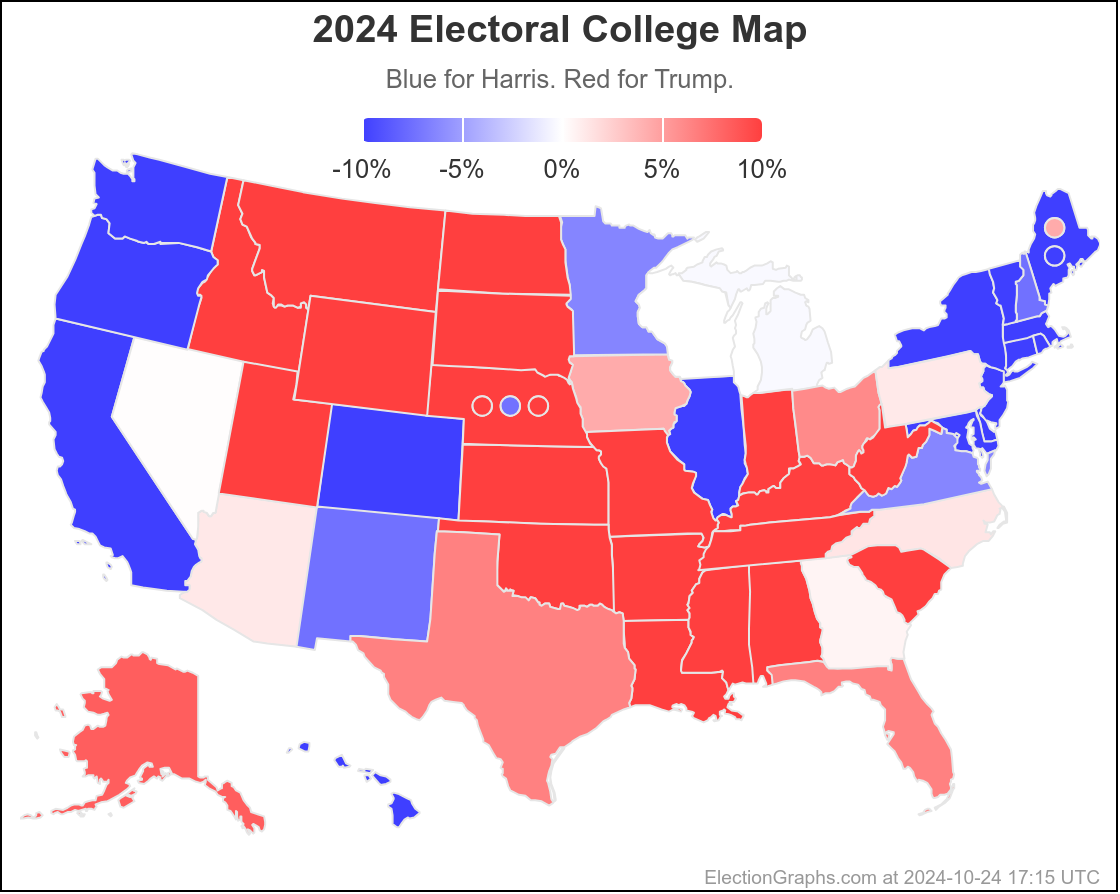
OK, here is the new map:

6.0 days left until polls start to close on election night.

There have already been new polls since I started this blog post. Always check the main Election 2024 page for the current numbers.

One way or another, we'll know how this plays out soon.

12 Days Out: What About Junk Polls?

It has been 11 days since my last post. I didn't mean to let it go that long at this stage. Oops.

As usual, lets start with a TL;DR.

The overall situation remains about the same as it has been since the end of September:

It is too close to call, but with Trump having a slight edge. Right now if you just directly give each state to the candidate that is ahead in the Election Graphs poll average, no matter how tiny the margin, then Trump wins by 56 electoral votes.

But there are so many close states that anything from Trump winning by 86 EV to Harris winning by 114 EV is within the realm of the reasonably possible and would not be a surprise.

The tipping point is currently Georgia, where Trump leads by 0.6%.

The EG probabilistic estimates, based on the patterns of EG polling average errors from 2008 to 2020 (where the Republican has been slightly underestimated in the close states more often than not) and accounting for the amount of time left, give Harris's chances of winning as somewhere between 17.5% and 32.5%.

Other places that give probabilities are closer to 50/50 because they assume the direction of polling errors in the past isn't relevant at all to how they may go this time, whereas I use the variances from the past to build my models, essentially assuming that the range of error patterns over the past few elections can tell us something about the range of possible errors we might see this time.

There has also been a lot of talk about low quality polls "polluting" poll averages like those here at Election Graphs. Looking into that, I do a review of the seven swing states including only the highest quality pollsters rather than everything I usually include.

When I do this the tipping point moves from Trump by 0.6% to Harris by 0.1%. A bit better for Harris, but still too close to call.

OK, with the high level conclusions out of the way, lets get into the details.

Normally at this point in the post, I'd jump into looking at how each of the close states has evolved in the polling since my last post. I'll do that in a bit, but I thought I would start a little differently this time.

As of when I started writing this post at 18:00 UTC on October 24th, the categorization view summary looked like this:

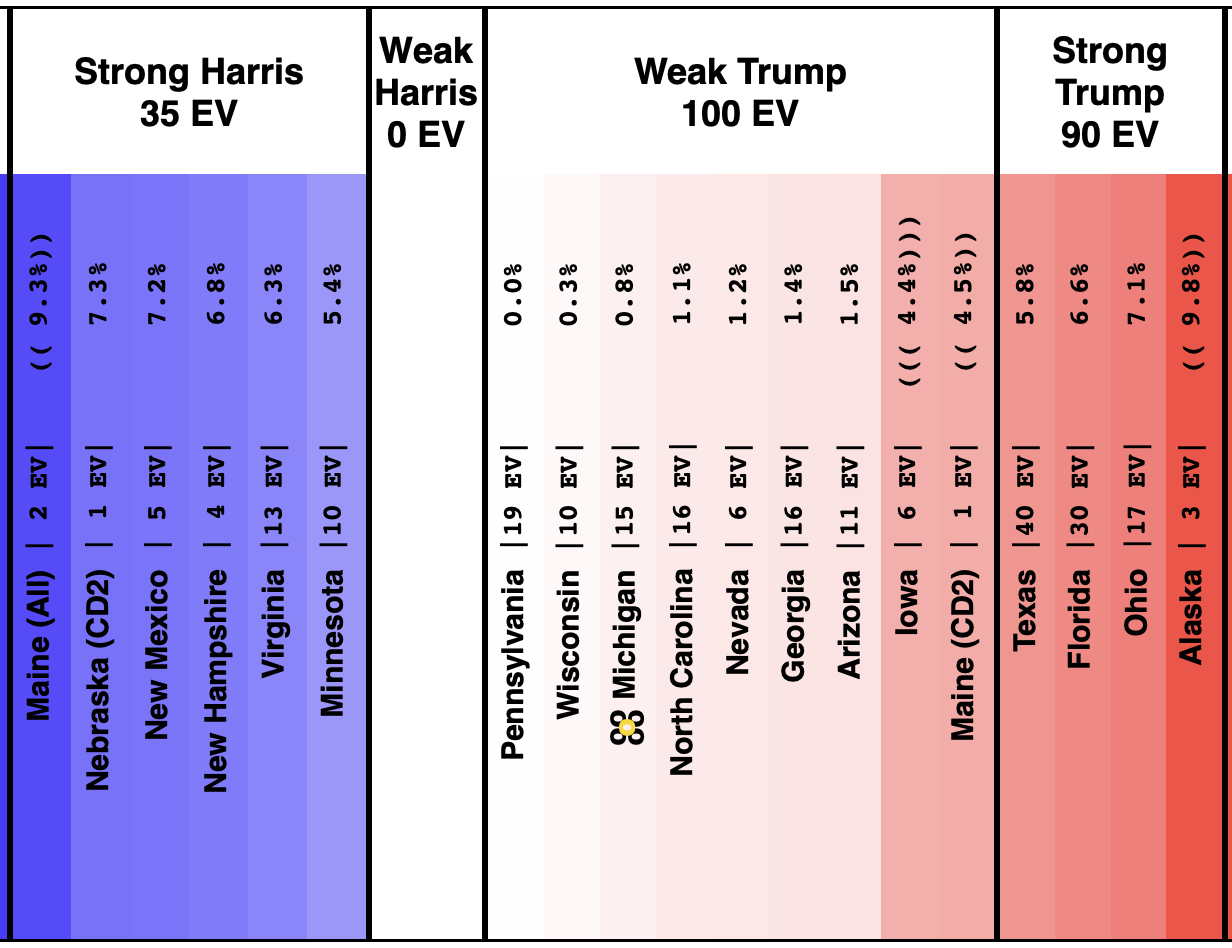
And the spectrum of states with margins under 10% looked like this:

The seven key "swing states" all currently have margins under 1.5% in the Election Graphs averages right now. That is tiny. Well within the margins of error of individual polls, and certainly within the ranges that poll averages like mine "bounce around" based on which polls specifically happen to be in the average at any given time.

But there has been a LOT of talk lately about conservative pollsters trying to "flood the averages" with Trump leaning polls. There are a variety of speculations as to the motives for doing something like this.

  • Motivate Republicans
  • Discourage Democrats
  • Set up a narrative for a stolen election if Harris wins
  • Just make Trump happy
  • They just believe their models, no ulterior motive

If this is happening, Election Graphs is certainly vulnerable to it, because my philosophy is to include everything and just let the averages wash it out over time, just like any other outliers. If there is an intentional effort to manipulate the averages, EG will be impacted by that effort.

I don't care to speculate on the motives of various pollsters, and I certainly don't feel comfortable categorizing pollsters in terms of whether or not they are the kind of pollster who might be trying to intentionally manipulate polling averages.

But 538 keeps a handy set of pollster ratings. These are not based on the affiliations and political leanings of the pollsters, but rather on "the historical track record and methodological transparency of each polling firm's polls". They rate pollsters on a 0 to 3 scale, with 3 being the most trustworthy and reliable pollsters, and go down from there. Some pollsters have no ratings at all either due to a limited track record, or being outright banned from 538 because they are so bad.

In response to a question on Mastodon on October 16th I did a quick look at how Pennsylvania's average would change if instead of including everything in the EG averages, I used 538's pollster ratings as a filter:

@Deixis9@mastodon.social @mastodonmigration@mastodon.online Excellent Question.

Using PA as an example and using 528's pollster ratings (scores from 0 to 3), and only including pollsters above various ratings, using the same averaging methodology otherwise:

My Current Avg: Harris by 0.1%
Only 1.5 and Above: Harris by 0.4%
Only 2.0 and Above: Harris by 0.8%
Only 2.5 and Above: Harris by 1.5%

Since my averages are “last 5 polls”, the more restrictive you are, the longer a time period would be included in the average.

https://newsie.social/@ElectionGraphs/113321401468832685

The timeframe of the polls included in the average at that time moved from about one week to about three weeks because of the need to go further back in time to get enough polls at the higher ratings.

At least for Pennsylvania, at that specific time 8 days ago, looking at only the highest quality pollsters instead of letting any old pollster into the average improved Harris's position by 1.4%. Which doesn't sound like a lot, but with 7 states with margins under 1.5%, that 1.4% potentially makes things look a lot different.

If we just shifted every state in the summary above by 1.4% toward Harris, instead of losing by 56 electoral votes, Harris would win by 100 electoral votes. Instead of the tipping point being Trump by 0.6%, the tipping point would be Harris by 0.8%.

But lets not do that, lets do this calculation for all 7 swing states based on the polling that we have today, and see where we end up. For this exercise, we'll look at the averages as I have them today, and then redo each one, otherwise using the exact same logic used in my averages normally, but only using pollsters rated 2.5 or above at 538.

So here we go:

Right now we have Michigan as Harris by 0.3%.

If we only included the high quality pollsters this would be… Trump by 0.5%

So at least for Michigan, moving to the high quality pollsters actually helps Trump by 0.8% at the moment.

Current average: Trump by 0.0% (rounded from Trump by 0.01%).

With only the 2.5 and above pollsters: Harris by 0.6%

So eliminating the low quality pollsters boosts Harris by 0.6%.

Current average: Trump by 0.1%

Only the 2.5s: Harris by 0.8%

So moves things 0.9% toward Harris.

Current: Trump by 0.6%

Only the 2.5s: Trump by 1.1%

So limiting helps Trump by 0.5%

Current: Trump by 1.2%

Only the 2.5s: Harris by 0.1%

So 1.3% better for Harris

Current: Trump by 1.2%

Only the 2.5s: Trump by 2.7%

So helps Trump by 1.5%

Current: Trump by 1.3%

Only the 2.5s: Harris by 0.3%

So helps Harris by 1.6%

OK, that's all seven of them. They vary from helping Harris by 1.6% to helping Trump by 1.5%. Averaging the effects in these 7 states leads to… helping Harris by 0.2%.

So pretty small on average. But how would this change the tipping point or who was winning or losing and all that? Lets put the states in order based on these new averages:

  • Nevada (6 EV): Harris by 0.8%
  • Wisconsin (10 EV): Harris by 0.6%
  • North Carolina (16 EV): Harris by 0.3%
  • Pennsylvania (19 EV): Harris by 0.1% <– Tipping Point
  • Michigan (15 EV): Trump by 0.5%
  • Georgia (16 EV): Trump by 1.1%
  • Arizona (11 EV): Trump by 2.7%

With these numbers, the tipping point moves from Trump by 0.6% to Harris by 0.1%, so restricting to the highest quality pollsters improves Harris's tipping point by 0.7%.

This would result in Harris 277 to Trump 261, a 16 electoral vote win for Harris.

So yes, looking at only the highest quality pollsters does result in a bit better picture for Harris. (At least right now, this will obviously change whenever new polls come in, which is multiple times every day at this point.)

But we still end up in a situation where the result is dependent on 7 states with margins under 3%, with 5 of those under 1%, and with a tipping point just barely different than zero.

This is as close to a tie race as you can get.

What would it mean for the EG probabilistic views? Well, you can't really tell directly. The analysis of the 2008 to 2020 elections showing how far off averages were from actual election results included the low quality polls. So to properly answer that question you wouldn't just plug the new averages into the models I already have, you'd have to build new models based on similarly restricting the 2008 to 2020 data to high quality pollsters only.

Plus, at least until we actually have election results, we won't know if the average with or without the lower rated pollsters actually ends up closer to the real results. In 2016 and 2020, my memory is that having these lower rated pollsters in the average actually pushed the averages CLOSER to the actual results in the end, as opposed to making them worse. (I haven't gone back to double check that though.)

Ignoring all of that that, there is one back of the envelope approximation I can make pretty easily. The "Uniform Swing" probability is generally very close to the probability of a win given the margin in the tipping point state. In this case a 0.1% Democratic lead.

This calculation would give Harris a 36.2% chance of winning, compared to the 32.5% chance with the current averages as of when I started this blog post (accounting for the amount of time remaining).

So again a bit of an improvement for Harris, but not enough to flip this from "too close to call but with Trump favored" to "too close too all with Harris favored".

Trump is still favored even when you restrict the poll averages to only the highest quality pollsters. Just by a little less.

So all in all, the "junk pollsters" do make things look a little bit better for Trump than if we used high quality pollsters only, but we don't actually know for sure if that is a better or worse picture of reality, and the overall picture doesn't change. It is still too close to call regardless.

OK, now, with all that out of the way, guess I should do the usual, "how have things changed since last time" thing…

Movement toward Trump:

  • Pennsylvania (19 EV): Trump by 0.0% -> Trump by 1.2% (Trump+1.2%)
  • Texas (40 EV): Trump by 5.8% -> Trump by 6.6% (Trump+0.8%)
  • North Carolina (16 EV): Trump by 1.1% -> Trump by 1.3% (Trump+0.2%)

No movement:

  • Nebraska-CD2 (1 EV): Harris by 7.3%
  • Virginia (13 EV): Harris by 6.3%
  • Iowa (6 EV): Trump by 4.4%
  • Florida (30 EV): Trump by 6.6%

Movement toward Harris:

  • Maine-CD2 (1 EV): Trump by 4.5% -> Trump by 4.4% (Harris+0.1%)
  • New Mexico (5 EV): Harris by 7.2% -> Harris by 7.4% (Harris+0.2%)
  • Wisconsin (10 EV): Trump by 0.3% -> Trump by 0.0% (Harris+0.3%)
  • Arizona (11 EV): Trump by 1.5% -> Trump by 1.2% (Harris+0.3%)
  • New Hampshire (4 EV): Harris by 6.8% -> Harris by 7.4% (Harris+0.6%)
  • Maine-All (2 EV): Harris by 9.3% -> Harris by 10.1% (Harris+0.8%)
  • Georgia (16 EV): Trump by 1.4% -> Trump by 0.6% (Harris+0.8%)
  • Minnesota (10 EV): Harris by 5.4% -> Harris by 6.4% (Harris+1.0%)
  • Ohio (17 EV): Trump by 7.1% -> Trump by 6.1% (Harris+1.0%)
  • Michigan (15 EV): Trump by 0.8% -> Harris by 0.3% (Harris+1.1%)
  • Nevada (6 EV): Trump by 1.2% -> Trump by 0.1% (Harris+1.1%)
  • Alaska (3 EV): Trump by 9.8% -> Trump by 8.4% (Harris+1.4%)

So 12 moving toward Harris, with only 3 moving toward Trump. But with all of that, the tipping point still only moved from Trump by 0.8% in Michigan to Trump by 0.6% in Georgia.

So even though a bunch of states moved toward Harris, with Pennsylvania moving toward Trump, the net impact on the tipping point was negligible.

So lets look at the tipping point chart, with the 2016 and 2020 comparison lines:

For the last few weeks, the tipping point has been bouncing around barely on the Trump side of the center line. This is movement from the weeks before that, when it was bouncing around barely on the Harris side of the line instead.

As usual, I will point out that Harris is doing significantly worse than both Biden in 2020 and Clinton in 2016. In both of those years, the polling underestimated Trump. Absent a large movement in Harris's direction in the next 12 days, if the polls are underestimating Trump again, then he wins. Because he is already leading, and the error would just mean he wins by even more.

To pull out a win, Harris either needs that last minute big move in her direction, or for the polls to be overestimating Trump this time around.

The trends in the two probabilistic models (accounting for time left) look like this:

You'll note that the win odds for both of these models haven't really moved around all that much in October. The Uniform Swing odds have varied a bit more, but both basically show Trump favored, but with non-trivial chances still available for Harris. But no big trend toward either candidate.

This may still change before the end, but time is running out quickly.

We'll end with the current map:

11.7 days until polls start to close on Election Night.

23 Days Out: Bad Week for Harris?

It has been 7 days since my last post. The time remaining is flying by fast. These posts will become more frequent as we approach the end. At least once a week now, but more if something interesting happens.

As usual, here is the TL;DR for those who just want the summary:

It is still too close to call, although with recent polling in swing states, EG currently favors trump by about 70/30.

There has been some talk of low quality partisan pollsters making poll averages look redder than they should, but mainstream pollsters are showing the same thing in key states.

The race is right on the edge if you trust the polling, but a lot will depend on if the polls are systematically underestimating Trump again, as EG implicitly assumes, or if this time they are underestimating Harris.

But we won't know that until the votes are counted.

Either side could still easily win.

With that done, as usual, I'll start with how polls have moved in the last week for all the states with a margin under 10%.

As of 2024-10-07 at 01:00 UTC:

And as of 2024-10-13 20:30 UTC when I started this blog post:

OK, now the changes in the last week:

Movement toward Trump:

  • Florida (29 EV): Trump by 2.9% -> Trump by 6.6% (Trump+3.7%)
  • Nevada (6 EV): Harris by 1.5% -> Trump by 1.2% (Trump+2.7%)
  • Wisconsin (10 EV): Harris by 1.5% -> Trump by 0.3% (Trump+1.8%)
  • Arizona (11 EV): Harris by 0.1% -> Trump by 1.5% (Trump+1.6%)
  • New Hampshire (4 EV): Harris by 7.8% -> Harris by 6.8% (Trump+1.0%)
  • Georgia (16 EV): Trump by 0.9% -> Trump by 1.5% (Trump+0.6%)

No Movement:

  • Maine-All (2 EV): Harris by 9.3%
  • Nebraska-CD2 (1 EV): Harris by 7.3%
  • New Mexico (5 EV): Harris by 7.3%
  • Michigan (10 EV): Trump by 0.8%
  • Iowa (6 EV): Trump by 4.4%
  • Maine-CD2 (1 EV): Trump by 4.5%
  • Alaska (3 EV): Trump by 9.8%

Movement toward Harris:

  • Minnesota (10 EV): Harris by 5.3% -> Harris by 5.4% (Harris+0.1%)
  • Texas (40 EV): Harris by 6.3% -> Harris by 5.8% (Harris+0.5%)
  • Ohio (17 EV): Trump by 7.8% -> Trump by 7.1% (Harris+0.9%)
  • Virginia (13 EV): Harris by 5.5% -> Harris by 6.3% (Harris+0.8%)
  • North Carolina (16 EV): Trump by 2.0% -> Trump by 1.1% (Harris+0.9%)
  • Pennsylvania (19 EV): Trump by 1.1% -> Trump by 0.0% (Harris+1.1%)

Six states moving toward Trump, six states moving toward Harris.

Unfortunately for Harris, three of the states moving toward Trump moved across the center line. This moved the "expected case" where every candidate just wins the states where they lead the EG average, even by the tiniest amount, from Trump winning by 32 EV, to Trump winning by 86 EV.

For the first time in one of these updates, one of the candidate has no "weak" states, meaning states that favor them, but by a margin less than 5%. At the moment ALL of the close states are on the Trump side of the center line, although many of them just barely.

The tipping point though stays pretty flat, moving from Trump by 0.9% in Georgia, to Trump by 0.8% in Michigan.

So lets look in detail at the tipping point state and the three on either side:

This time Minnesota is included in the 7 we are looking at, because Nevada and Arizona moved to the Trump side of the tipping point. But Minnesota still looks pretty blue, and there has not really been a trend in the polling average. It has been pretty stable this whole time.

Pennsylvania has spent most of the time as the actual tipping point state, but not right now, since other states that had looked bluer than PA, are now looking redder than PA. Most of the time, this state has been just barely Harris. Right now on the Election Graphs site, it says "Trump by 0.0%". But if it is 0.0%, why is it Trump? Well because the display is rounded. The actual average right now is Trump by 0.04%.

Looking at the full history from August to today though, it looks like the average is just bouncing around in a range, usually between the tie line and a 2% Harris lead with just occasional forays outside of that zone. Right now the average is at the very high end of that range, but there is no clear trend over the last couple of months, so if you had to bet, you'd probably bet that this will revert to the mean, and end up with Harris having a lead in the poll average… barely.

Having said that, if the polls are underestimating Trump like they did in 2016 and 2020, then having a slight lead in the polls won't be good enough for a Harris win.

Unlike Pennsylvania, Wisconsin does seem to have a bit of a trend toward Trump over the last month ago, and is now just barely on the Trump side of the line. Will this last? Is it real? Is it just low quality conservative pollsters trying to sway the averages?

Well, in terms of the last question, Election Graphs uses an "include everything we can find" philosophy, so that does include some potentially questionable pollsters sometimes. For instance the Wisconsin average currently includes Fabrizio McLaughlin, for which 538 doesn't even have a rating. But Quinnipiac and Emerson are also in there, which are both near the top of 538's ratings. And if you only included those two, Trump's lead would actually be MORE, not less.

There has been a lot of talk lately about conservative pollsters "flooding the zone" to try to influence polling averages. Maybe they are. But there are so many new polls coming out every week at this point, that these wash in and out of averages like the Election Graphs averages pretty quickly. But more importantly, the mainstream pollsters seem to be showing the same thing. At least in the case of Wisconsin.

Of course that still doesn't tell you if the recent trend is going to last. We'll just have to wait and see. But the Harris team should be concerned about the trend in Wisconsin and doing everything they can to reverse it.

Michigan is currently the tipping point. This means that to win overall, Harris would have to win all the states we have talked about so far, plus Michigan.

Here in Michigan, the longer term trend is less clear than in Wisconsin, but the average has definitely broken out of its previous range onto the Trump side of the line.

Once again, there are no clear outliers, and if you restricted the average only to the highest quality pollsters (again Emerson and Quinnipiac in recent Michigan polling) Trump's lead would be even wider.

There have been a few isolated moments where North Carolina was on the blue side of the line, but for the most part it has been hovering at about a 1% Trump lead. And we are back there right now.

Unlike the other states we have looked at so far, there is at least one poll that look like an outlier in the Nevada average right now.

That would be Fabrizio Lee with a mid-date on October 3rd. They gave three separate results, which average to a 6.3% Trump lead, the best Trump poll result in Nevada since July.

There is also a Fabrizio McLaughlin poll with Trump up by 3%. If it wasn't for the Fabrizio Lee poll, THIS would be the best poll for Trump since the middle of August.

If you take these polls out, Nevada would be back in its "normal" range somewhere between a tie and Harris up by 2%, so it feels likely the poll average will pop back to the Harris side with a few more polls.

Finally Georgia. No real trend here. Looks like most of the time Trump is running about at a 1.5% lead.

So, for the second week in a row, I've tried to go through state by state to try to squint at the curves and gauge where the averages "really" should be. But for the most part I don't like to do that. The averages should speak for themselves. If there are outliers, they will wash out as new polls are added.

Here is what the tipping point looks like just trusting the poll averages:

Looking at this view, it does look like Trump has managed to break the race out of the range it had been in since the end of July. It is still close, but this is an improvement for Trump compared to where things were before.

Trump now leads by 0.9% in this metric. Just looking at the graph above, you see plenty of examples of 0.9% moves happening essentially overnight. So this is a lead, but a tenuous one that could easily disappear with a bad day of polling.

But when you add in the 2016 and 2020 lines, the situation starts looking a lot more dire for Harris.

She is running about 6.4% behind where Biden was 4 years ago, and he ended up barely winning.

And she is running about 4.9% behind where Clinton was 8 years ago, and of course she ended up losing.

Harris needs either a big move in the remaining days of the race, or she needs the polling this time around to be underestimating her instead of underestimating Trump like it has the last couple of cycles.

There are reasons to think that might happen. A good case could be made for it. But we won't know the truth about that until the votes are counted and final.

The Election Graphs probabilistic views are based on looking at how far off the EG state by state averages were from the final election results in 2008, 2012, 2016, and 2020. The underestimations of Trump in 2016 and 2020 are a big part of that, and end up outweighing the underestimations of Obama in 2008 and 2012.

Basically, even if the straight poll averages showed a complete tie race, which is better than Harris is actually doing right now, the EG odds would still favor Trump.

To favor Harris, we'd have to see her build up a bit of a polling lead in the critical swing states, not just a tie. So in the current situation, she isn't doing great in our odds:

Accounting for the 23 days left, our models give Harris between a 19.6% and 32.0% chance of winning the electoral college. Probably closer to the 32.0% given that there probably will be a decent amount of correlation between polling errors in the various close states.

The "if the election was today" numbers are a bit lower, ranging from 14.5% to 26.9%. The higher numbers given 23 days remaining reflect that there is still time for Harris to improve her polling numbers in the key states before the election.

But the numbers being lower than you would expect just from Trump's narrow lead alone mainly reflect the built in assumption that the polls are probably underestimating Trump again, because over the last four election cycles, they have underestimated the Republican in the close states more often than not.

If we knew for sure that the polls would be evenly biased this time around, or that the polls would actually be underestimating Harris, these numbers would be a lot closer to even.

Because of the above, plus EG being really reactive to the newest polls, many of which show Trump leading in swing states right now, EG is currently a lot more bearish on Harris than other places giving odds. So I'm a bit of an outlier. Everybody else is a lot closer to 50/50 right now.

We shall see.

But even with my more pessimistic view, it is important not to fall into "rounding the odds". There seems to be a human tendency to try to reduce things to either being 100% certain or being a 50/50 coin toss. A 30/70 split is neither of those things. The 70% is favored, but 30% is still an outcome that wouldn't be surprising at all.

With things this close in so many states, the race really is still best characterized as too close to call.

People keep asking too much of polling. If someone is going to end up winning by 60/40, or even 55/45, polling and polling averages can do pretty decently at predicting the winner. But telling the difference between 52/48 and 48/52? That's hard. You have to get lucky, and will get it "wrong" a lot.

We just happen to be in a universe right now where the outcome depends on 7 states that are ALL potentially that close.

So the polling only ends up telling you that it is too close to predict accurately.

And with that, here is the new map:

22.6 days left. Gulp.

30 Days Out: Still Too Close To Call

It has been 12 days since my last post. I probably should be doing these weekly at this point, but other things still get in the way. I'm taking time off from the day job for the final two weeks before the election though, so I'll probably do more updates then.

Within reason. Even with updates 12 days apart like this, a lot of the "movement" may just be noise. Just changes within the inherent uncertainty of polling, and with which pollsters happened to be included in the averages at the time of the update. So even when we talk about week to week changes, it will be important to look at the longer term trends, because there is so much polling going on these days, that short term variations may not be "real".

So we'll try to do that, starting with the summary of where we are:

In the last 12 days, the Election Graphs state level polling averages in the critical states have moved toward Trump. Harris is now in the weakest position she has been in since the end of July.

That however still leaves us with a race that is too close for polling to be able to reliably predict a winner. The range of reasonable possibilities goes from a healthy Harris win to a healthy Trump win, and anything in between.

At this very moment, Trump would be favored by a bit (EG currently gives Trump a 70% to 75% chance of winning), but the tipping point is close enough that the next batch of swing state polls could change that dramatically.

Polling is so close to the tie line, that tiny differences in the most recent polls can change who is "ahead". It is just too close for us to be able to tell who is "really" ahead with these kinds of poll averages, and the day to day or week to week changes may not be "real", and it is best to look at longer term trends.

And the longer term trend is that this "right on the line, could go either way" scenario has been where we have been since the end of July.  There has been some back and forth in the numbers week to week, but that overall conclusion has not changed substantially since shortly after Harris took over from Biden.

OK, with that out of the way, let's look at some of those short term changes I just told you to ignore.

On 2024-09-25 the spectrum of states with margins under 10% looked like this:

And as of 01:00 UTC on 2024-10-07 when I started this blog post:
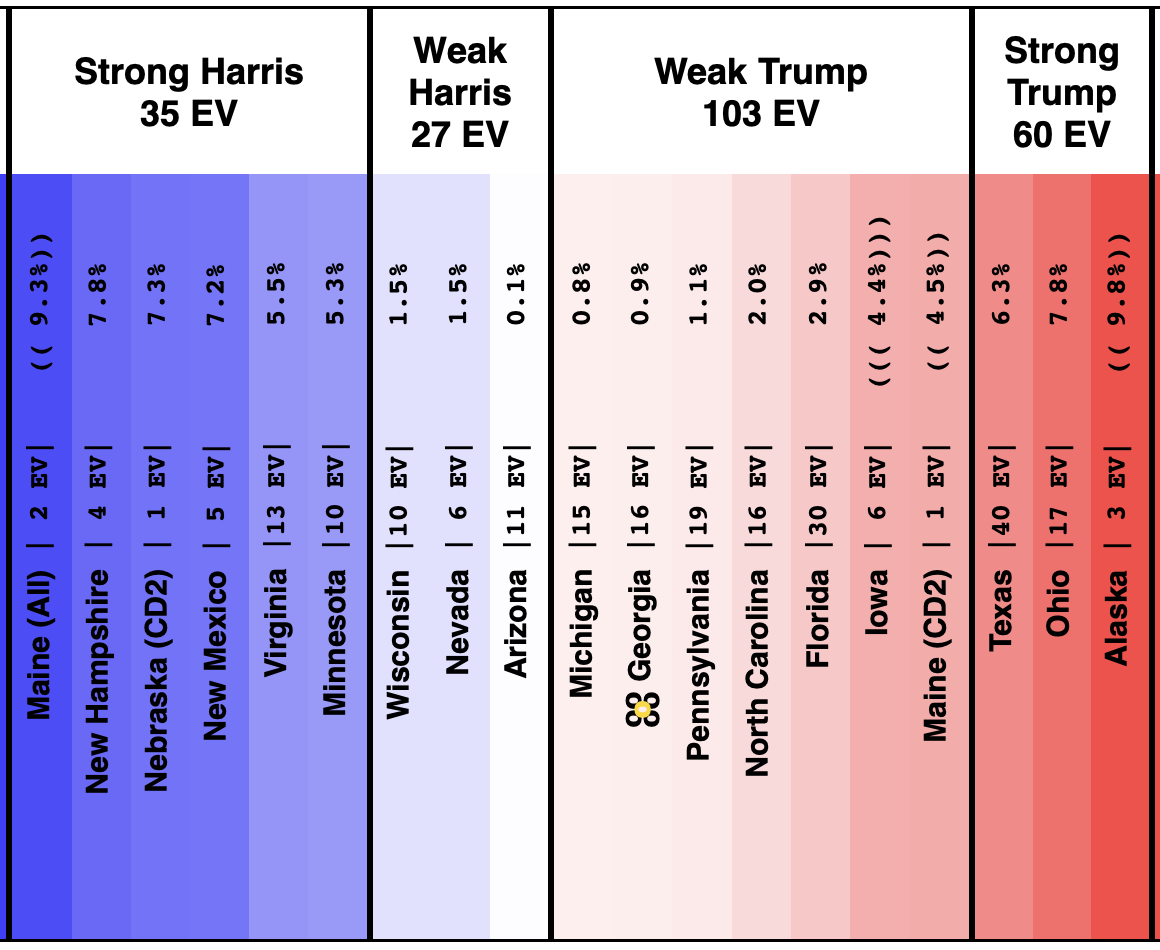
So lets look at the changes:

Movement toward Trump:

  • Michigan (10 EV): Harris by 2.8% -> Trump by 0.8% (Trump+3.6%)
  • Iowa (6 EV): Trump+1.3% -> Trump+4.4% (Trump+3.1%)
  • Pennsylvania (19 EV): Harris by 0.5% -> Harris by 1.1% (Trump+1.6%)
  • Virginia (13 EV): Harris by 7.0% -> Harris by 5.5% (Trump+1.5%)
  • North Carolina (16 EV): Trump by 0.8% -> Trump by 2.0% (Trump+1.2%)
  • New Mexico (5 EV): Harris by 7.9% -> Harris by 7.2% (Trump+0.7%)
  • Minnesota (10 EV): Harris by 5.8% -> Harris by 5.3% (Trump+0.5%)
  • Texas (40 EV): Trump by 5.9% -> Trump by 6.3% (Trump+0.4%)
  • Wisconsin (10 EV): Harris by 1.7% -> Harris by 1.5% (Trump+0.2%)

No Movement:

  • Maine-All (2 EV): Harris by 9.3%
  • Nevada (6 EV): Harris by 1.5%
  • Maine-CD2 (1 EV): Trump by 4.5%

Movement toward Harris:

  • Georgia (16 EV): Trump by 1.0% -> Trump by 0.9% (Harris+0.1%)
  • New Hampshire (4 EV): Harris by 7.4% -> Harris by 7.8% (Harris+0.4%)
  • Florida (30 EV): Trump by 3.7% -> Trump by 2.9% (Harris+0.8%)
  • Alaska (3 EV): Trump by 10.8% -> Trump by 9.8% (Harris+1.0%)
  • Colorado (10 EV): Harris by 9.8% -> Harris by 10.9% (Harris+1.1%)
  • Arizona (11 EV): Trump+1.2% -> Harris by 0.1% (Harris+1.3%)
  • Ohio (17 EV): Trump+9.4% -> Trump+7.8% (Harris+1.6%)
  • Nebraska-CD2 (1 EV): Harris by 4.3% -> Harris by 7.3% (Harris+3.0%)

Some changes in both directions. Arizona does move from Trump to Harris, but both Michigan and Pennsylvania move from Harris to Trump, and they outweigh Arizona, and the tipping point moves from Harris by 0.5% in Pennsylvania to Trump by 0.9% in Georgia.

Lets take a close up look at the tipping point state, along with three states on each side:
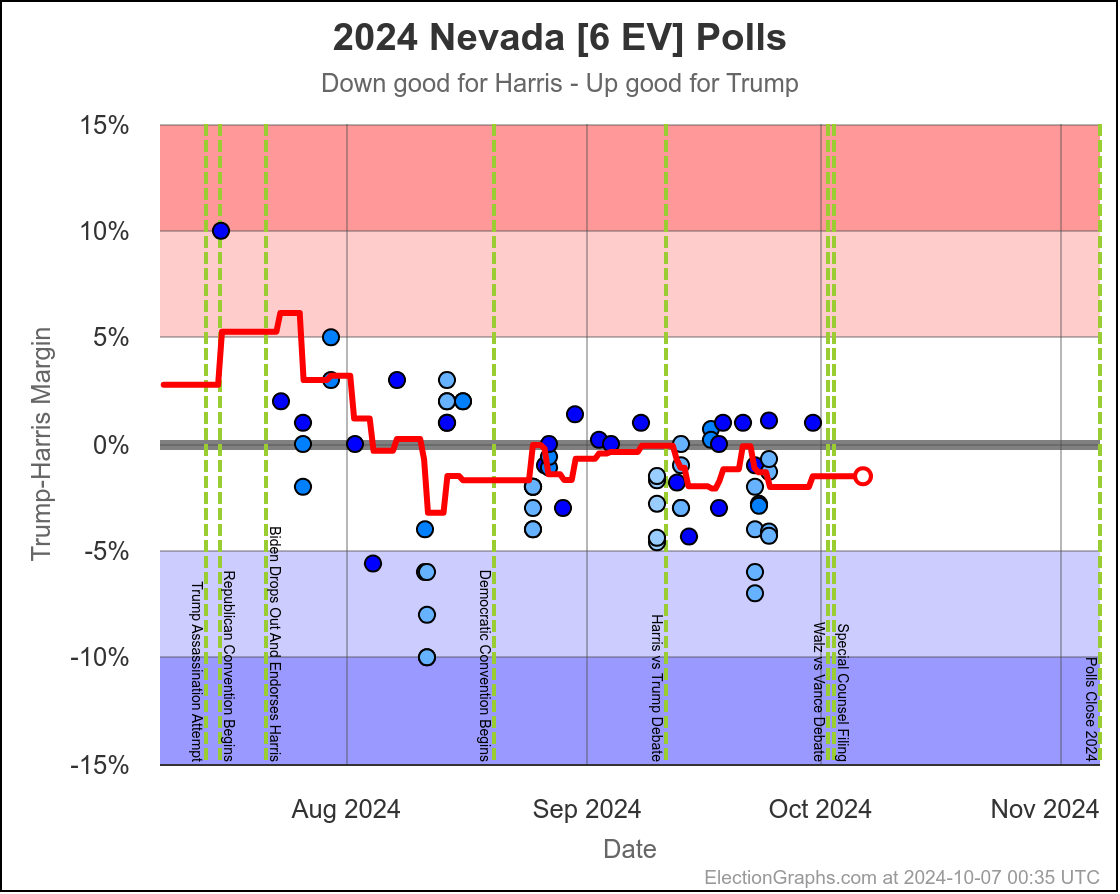
In the last two months the average in Nevada has ranged from Harris by 3.2% to Trump by 0.2%. Right now we have Harris by 1.5%, which is pretty close to the middle of that range. Looking at the longer term trend, Nevada looks like a pretty consistent narrow Harris lead.
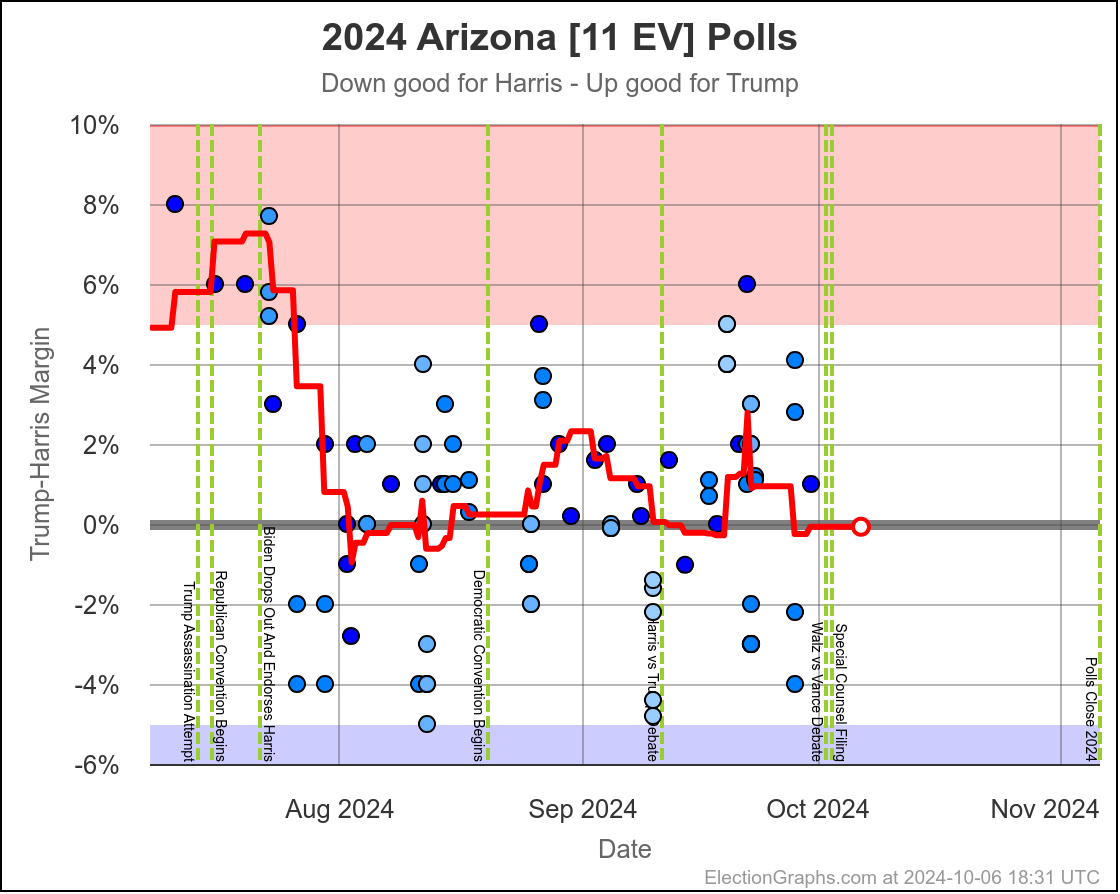
The two month range in Arizona is from Harris by 0.6% to Trump by 2.8%, with Harris currently leading by 0.1%. While there have been occasional very narrow Harris leads here, most of the time Trump has led in Arizona. There is always the possibility of polls just systematically underestimating Harris, or a last minute change, but Arizona looks like a Trump state at the moment, despite the current tiny lead by Harris.
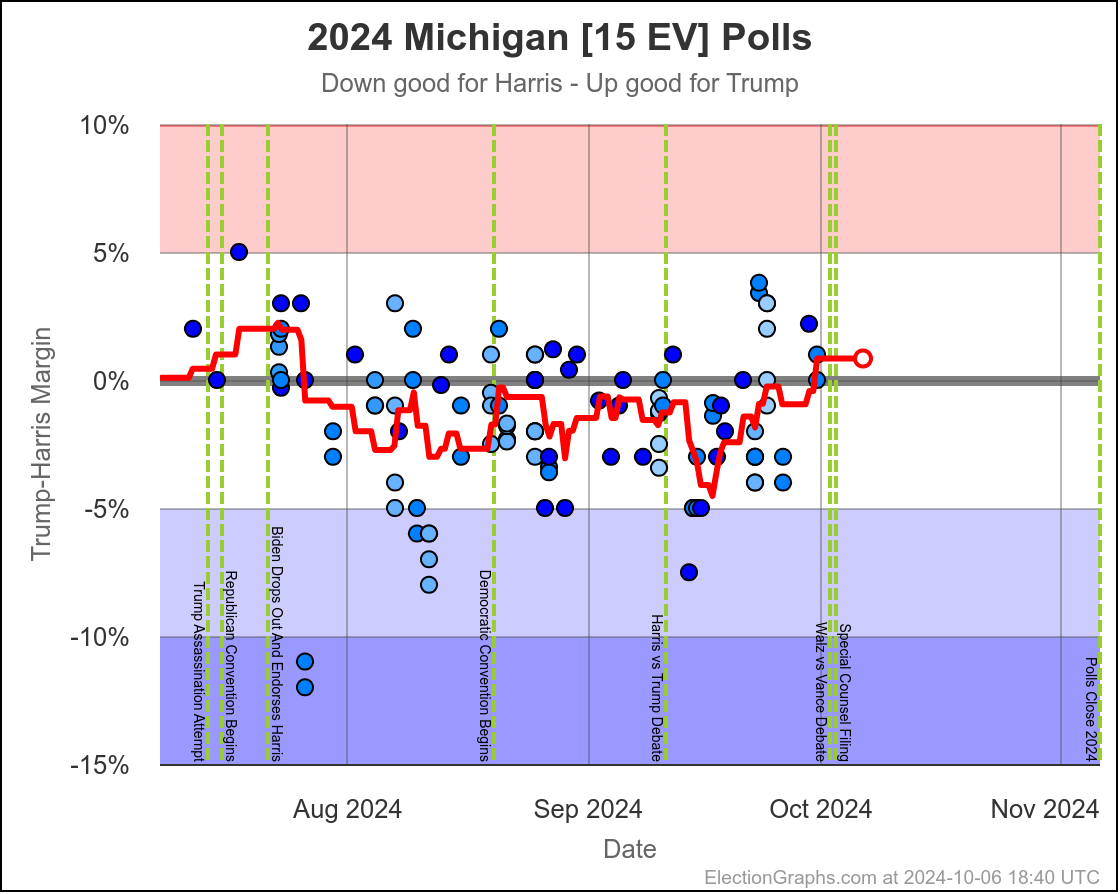
Michigan ranges from Harris by 4.5% to Trump by 0.8%, which is where it is right now. Almost the entire time Harris has been leading, but RIGHT NOW Trump is leading. The question is if this is an actual trend, or just that Trump has had a few good polls recently, and there will be a reversion to the mean with the next batch of polls.

Since there haven't really been any news events that you would think would move the polls, it seems reasonable to think Michigan is "really" a very narrow Harris lead. But it is worth paying close attention to the next few polls we see to see if this pops back to the Harris side of the center line.
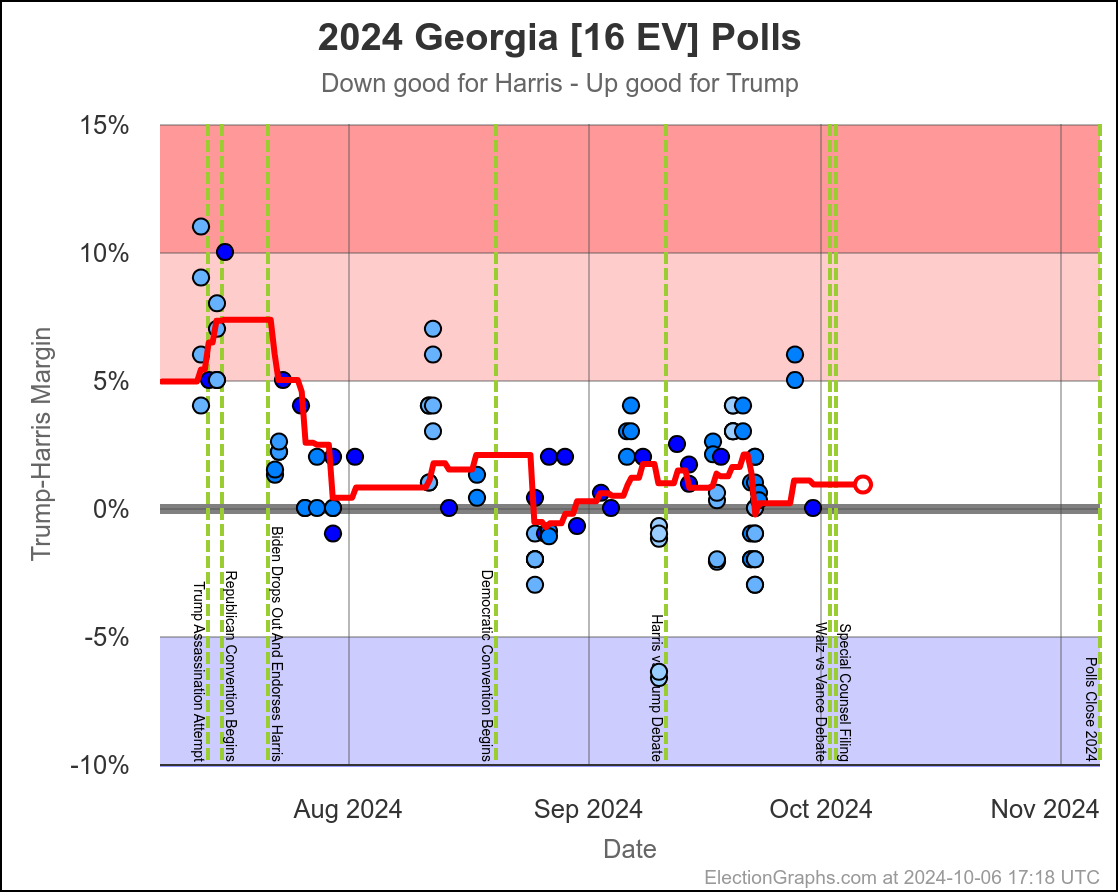
Harris by 0.6% to Trump by 2.1%. Currently Trump by 0.9% and this is the tipping point state. Georgia has almost always been Trump. It is probably really a narrow Trump win minus systematic polling error or a last minute move.
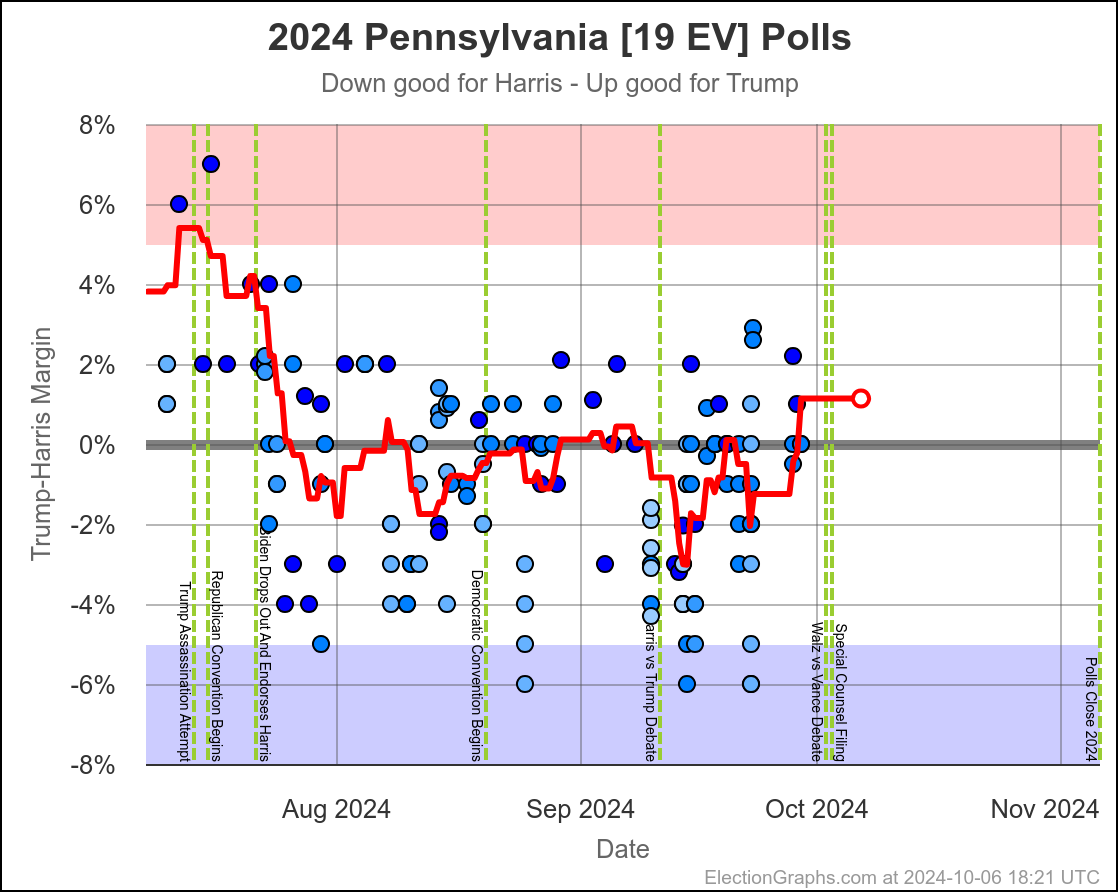
Harris by 3.0% to Trump by 1.1%, which is where things are now. Very similar to Michigan, almost all the time in the last two months, Harris has held a small lead in Pennsylvania. But at this very moment things have moved toward Trump and he is better off there than he has been since July.

The question is if this is a "real" move, or one that is just driven by a handful of outlier polls, where Trump's lead will disappear as soon as the next batch of polls comes in. We will see soon enough.

If I had to bet though, Pennsylvania is really still a very narrow Harris lead and this is a blip rather than a new trend.
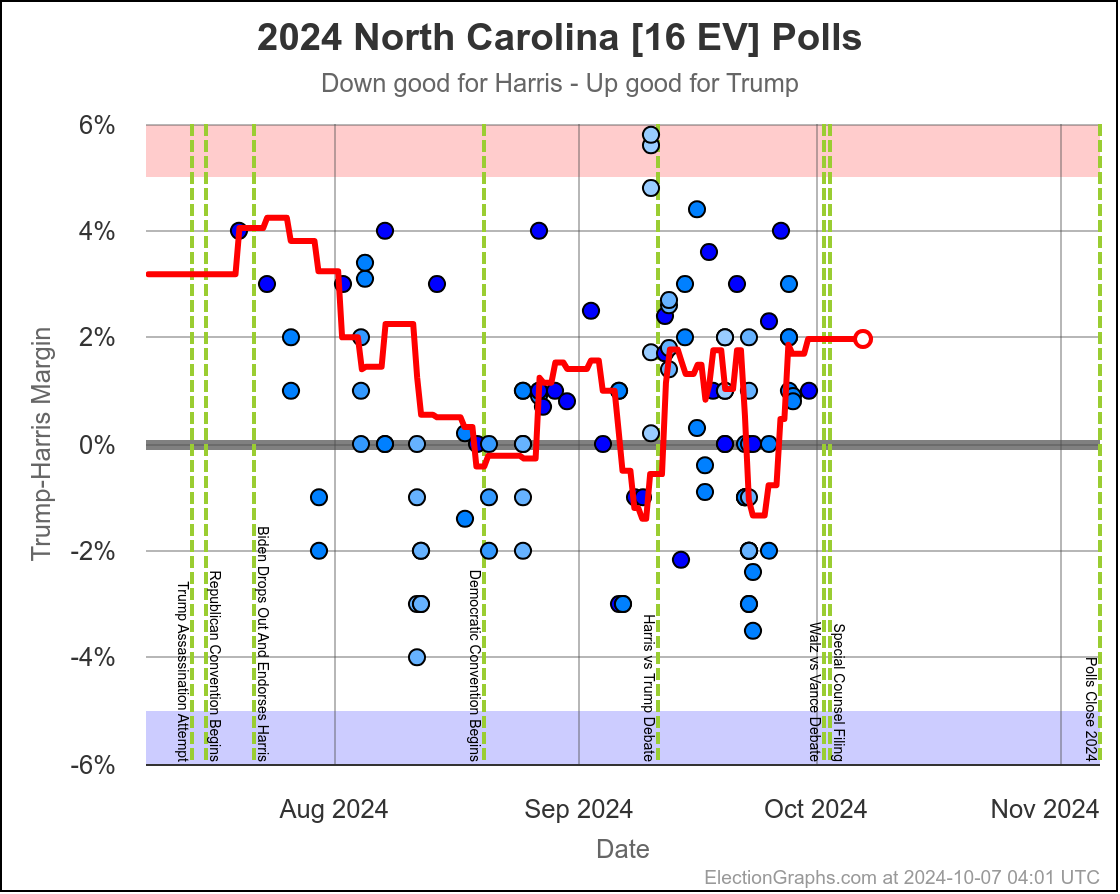
North Carolina has ranged from Harris by 1.4% to Trump by 2.3%, and is currently Trump by 2.0%. Trump seems to be at the upper end of his range here, but Harris has only briefly taken the lead here. If I had to guess, I would say this is really just bouncing around Trump up by 1%.
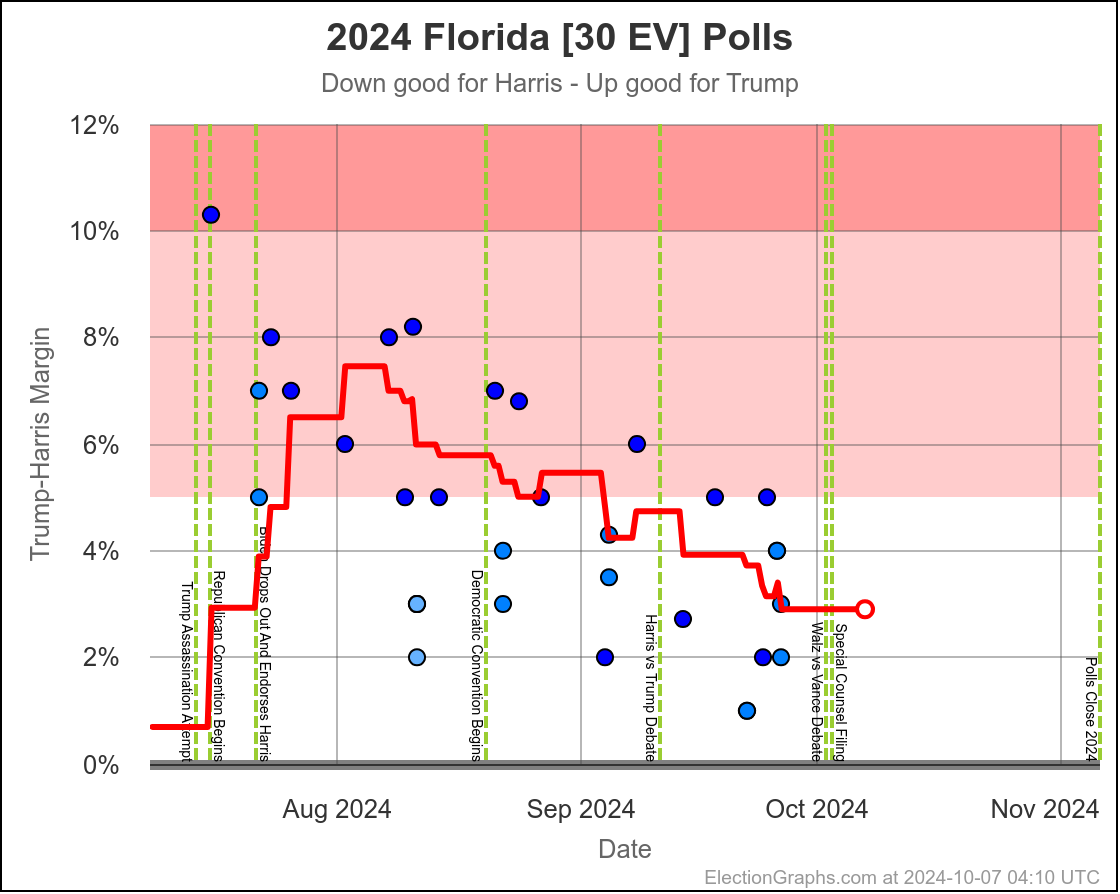
Of all seven states we are looking at here, Florida is the ONLY one where there appears to be an actual trend, rather than just bouncing around a range as individual polls come in and out of the average, with no "real" movement.

In Florida two months ago Trump was ahead by 7.0%, but now he is only ahead by 2.9%. That's a 4.1% movement toward Harris. Trump is still leading Florida though, and a Harris win would still be an upset.

OK, that is all seven.

So, the point of all that was to try to classify all of these key states by the longer term trends rather than by the poll values at this exact moment.

Doing this, you would give Nevada, Michigan, and Pennsylvania to Harris, but Arizona, Georgia, North Carolina, and Florida to Trump. (To round out the under 5% places, also Wisconsin to Harris, plus Iowa and Maine-CD2 to Trump.)

This would leave you with Harris 276 to Trump 262, a 14 electoral vote Harris win, which is a bit different than the straight up trust the averages summary currently on the site, which has Trump by 32 electoral votes:
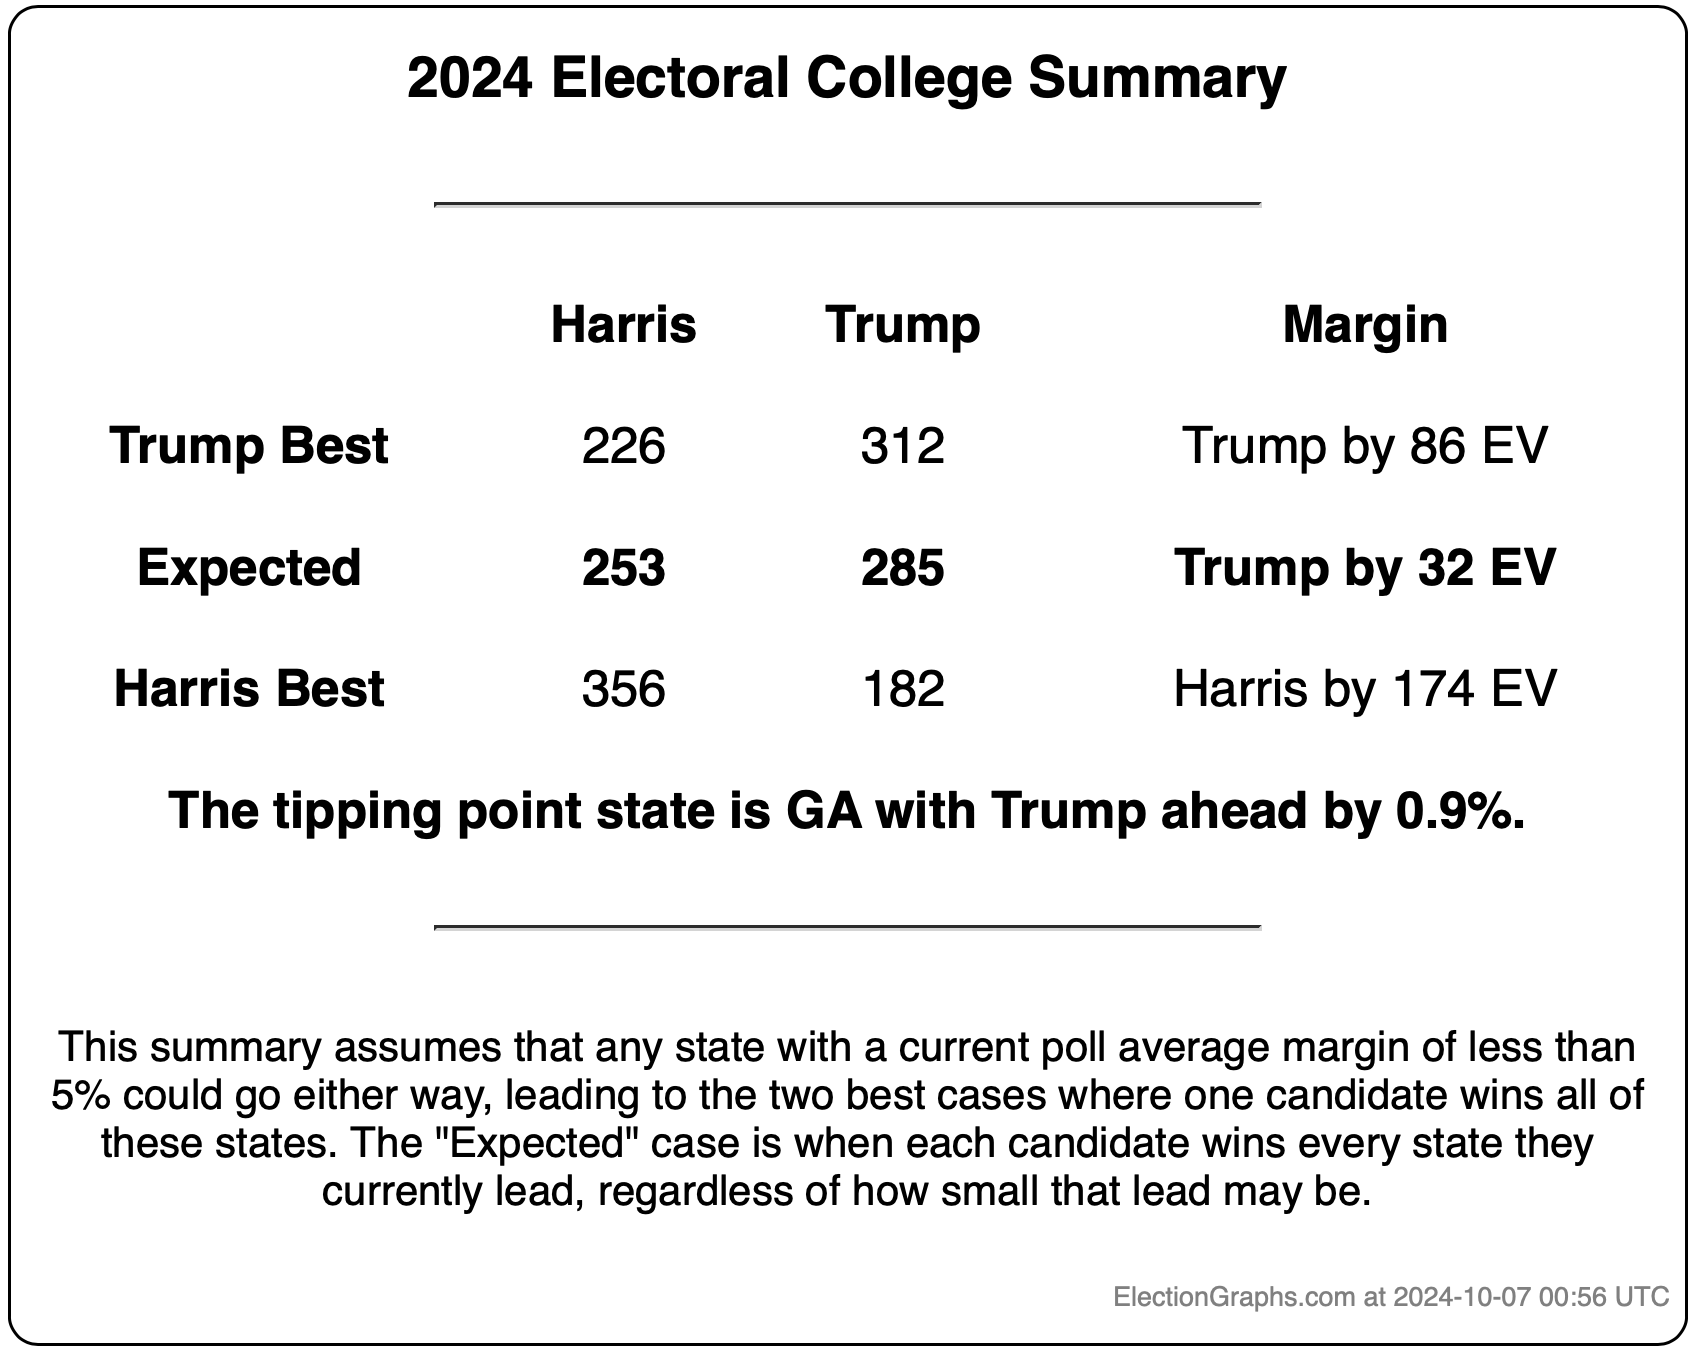
Here is the thing though, ALL of the states reviewed above are close enough that if there is a systematic polling error favoring one side or the other, that they might not actually even be close.

Is my argument that "well, even though right now this state is on one side of the line, it has usually been on the other side and there is no clear trend, so therefore it is probably really on the other side" which I used on Arizona, Michigan, and Pennsylvania plausible? Well yes. It is plausible.

It is also plausible that the straight "trust the current poll averages" number is closer to right than the exercise I just did above. Maybe the recent moves in Arizona, Michigan, and Pennsylvania aren't just short term spikes, but represent a real change that will last.

But it would also be plausible to suppose that the poll averages are systematically underestimating Trump in all or most of the close states, much as they did in 2016 and 2020, and therefore Trump may actually be ahead in all seven of these states (and maybe Wisconsin too).

And it would also be plausible to argue that lots of pollsters are overcompensating for their misses in 2016 and 2020 (see this Nate Cohn article for one possible mechanism) and so maybe Harris is really actually leading in most or all of these states.

And of course, there is always the possibility of an "October Surprise" news event that will change things completely in the last few weeks.

You could look at the tipping point the same way we have looked at the close states:
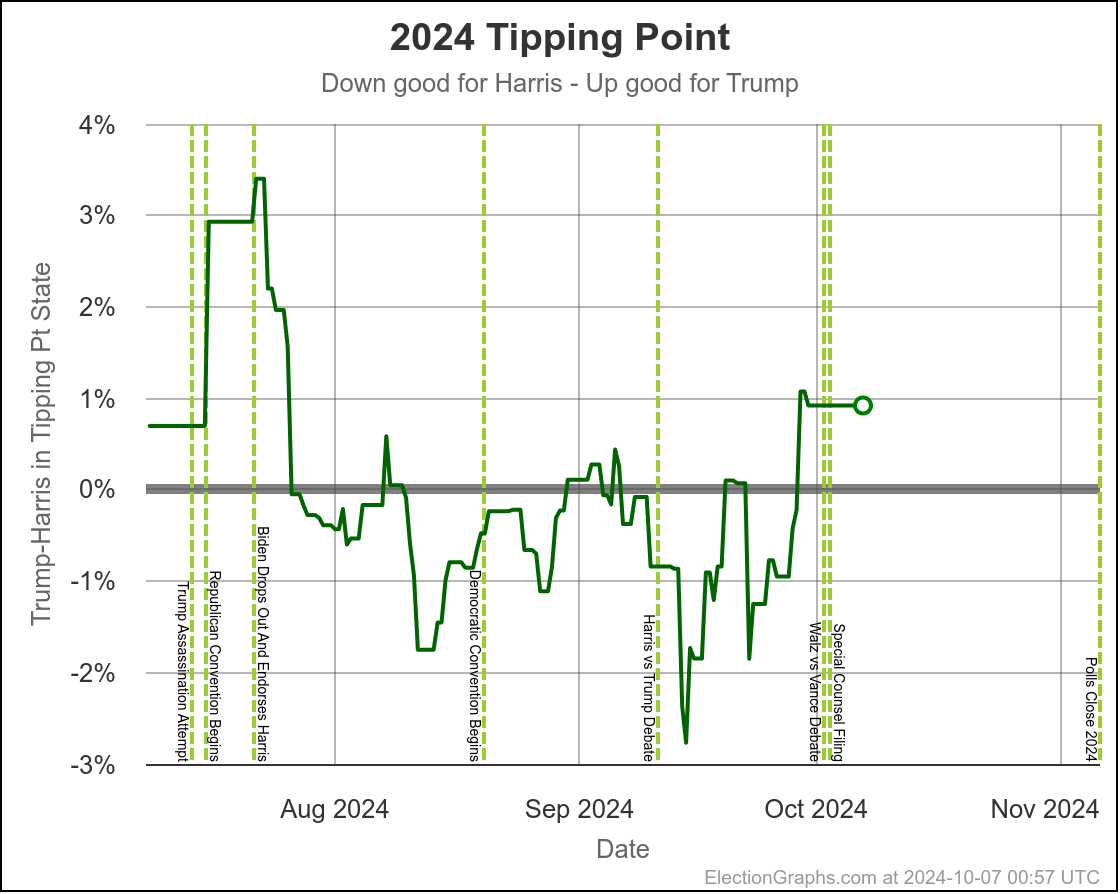
Using the same sort of logic, you'd say the tipping point has ranged from Harris by 2.8% to 1.1% over the last two months, with Trump currently ahead by 0.9%.

You'd say that this is mostly just bouncing around, and the center of attraction is probably just Harris ahead by maybe 1% or so. But you'd wonder about the recent move toward Trump, and watch the next polls in Michigan and Pennsylvania pretty closely to see if this just bounces back toward Harris.

The bottom line is we don't know. There are just too many states near the tipping point that are too close to call. To feel we could feel pretty confident about a winner, I'd want a tipping point over 5%, or at least close to 5%. But we are at a tipping point of 0.9%. So we just don't know.

This is where the probabilistic views I do here at Election Graphs come into place. I use data from 2008 through 2020 to compare final election results in those years to my poll averages X days before the election, and in turn use that to simulate the current election with the same levels of variation that were seen historically.

Originally, I had only done "If the election was today" with these simulations. But because until Election Day, that just isn't true, earlier this year I added a view taking into account the amount of time left.

At a super high level, the more time left, the higher the chances that the person behind in a state would be able to win after all. Also, on average over the last four elections, the final election graphs average underestimated the Republican by about 1.3% in the close states. (That simplifies things, but close enough.) But with more time left, how far off the close states were was different.

With only 30 days left, the "with X days left" view and the "if the election was today" views have gotten much much closer together. Which is of course what you expect. When we get to the very end, they will match exactly, because the election WILL be today.

But at this point they are already pretty close, basically indicating that the time left for things to change dramatically is disappearing quickly, and the probabilities are starting to be dominated by how the polling error will work out, where earlier the probabilities were dominated by the chances of "things changing" in the time left before the election.

So where are we right now?

  • With 30 days left:
    • Harris odds between 23.5% and 30.4%
  • If the election was today:
    • Harris odds between 20.7% and 25.0%

Here are the charts for the 30 days left view:
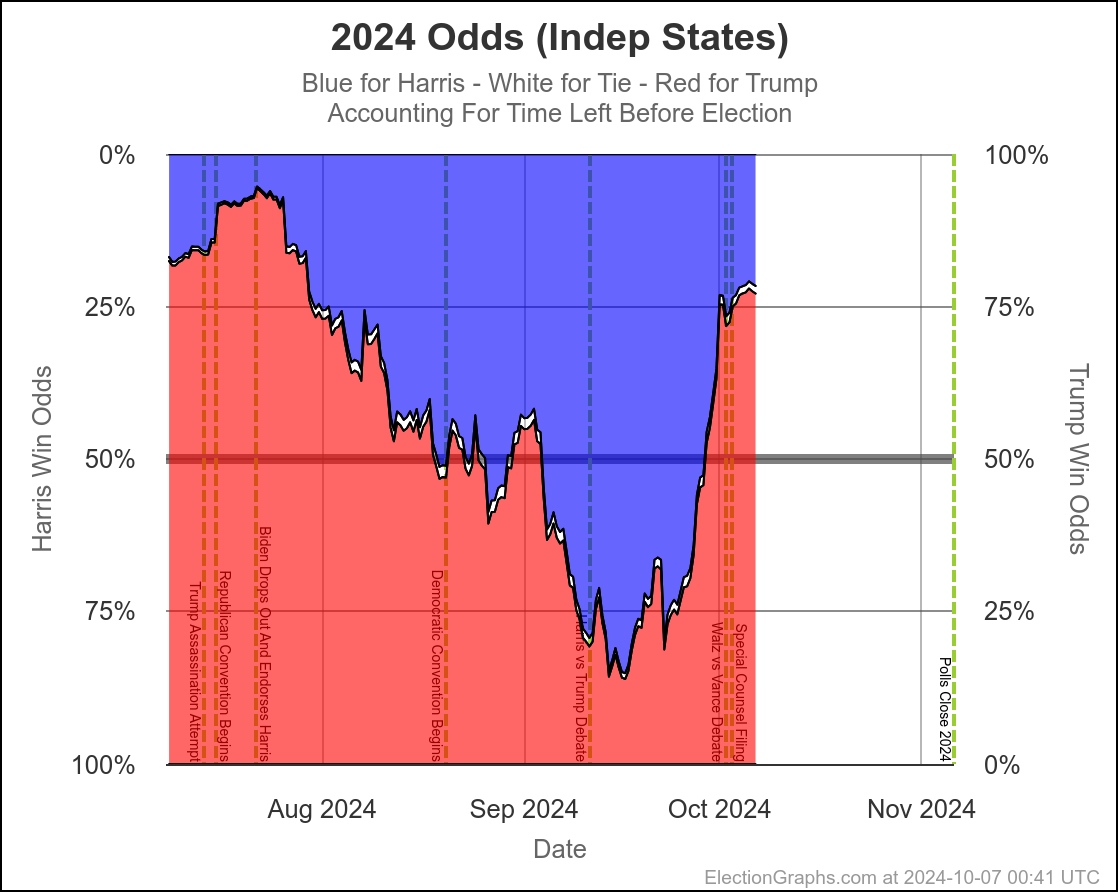
So wait, what's the deal here? Didn't I spend most of the first part of the post describing the race as a toss up where there was a decent chance either side could win by a decent margin?

Well yes. Yes I did. And this is NOT inconsistent with that. I also said that currently it would be a tossup with Trump favored. And this is exactly what this shows.

Rounding to big fractions, at the moment we're talking Trump favored over Harris by roughly 75/25. This is still a "toss up". We're not talking about a world where the underdog has a 1% chance, or a 0.1% chance or something else that is essentially miniscule. 25% can happen easily. There are many different scenarios you can imagine that get you to the person with a 25% chance winning.

I often use 2016 as an example here. Election Graphs did not have a probabilistic view in 2016, but the median of sites I could find that did have probabilities gave Trump a 14% chance of winning. And he won. That was a long shot underdog win, and it still happened.

A 25% chance is a much bigger chance than that, and is very possible. I still consider that in the toss up zone, although admittedly on the edge of it.

This is lower than the big guys have Harris at this point. Here is a sampler:

So why do I have it so much lower? It really comes down to the following:

  • The Election Graphs odds are based on how far off the EG polling averages were from 2008 to 2020. On average over these four cycles, in close states the polls underestimated the Republican by 1.3%. So we essentially (again a simplification) don't give the Democrat a 50/50 shot at winning a state unless they are ahead by at least 1.3%. So we are essentially assuming the pols are going to underestimate the Republican, meaning that a small Trump lead has a bigger impact on the odds than you might think otherwise.
  • At this exact moment, the last week or two so has been full of polling showing Trump ahead in key states. One week ago, we had Harris odds between 53.4% and 57.5%. The dip in the last week is very specifically due to these recent polls moving the tipping point from Harris ahead by 1.2% to Trump ahead by 0.9%. If the next set of polls pops averages back in Harris's direction, the odds will go back up quite a bit. With things so close, a move of 1% or 2% has a huge impact on the odds.
  • My polling averages are intentionally designed to be much more reactive to short term changes as polls get more frequent as the election gets closer. The "big guys" average over longer time periods, and so are less reactive to each individual poll. On the one hand, this makes EG susceptible to false movements due to outliers. On the other, it let us catch the last minute swing toward Trump in 2016 that many others did not.
  • If this last week of polls are actually the start of a new trend, then my numbers are just a leading indicator, and the others will follow as more polls come in. If they are just outliers, my numbers will revert to the mean as the next few polls come in.

My argument when I went through the 7 key states was essentially that Arizona, Michigan, and Pennsylvania are probably just being pushed around by outliers right now and will revert to the mean, probably bringing the EG probabilistic numbers back closer to 50/50 as more polls come in.

Of course that is just a gut feel. An educated guess looking at the long term trends and also at which pollsters are currently included in the averages. Maybe the next polls will confirm the recent move toward Trump instead.

We will know soon enough.

The first bullet above… the direction of historical polling errors, can also be shown by this chart:
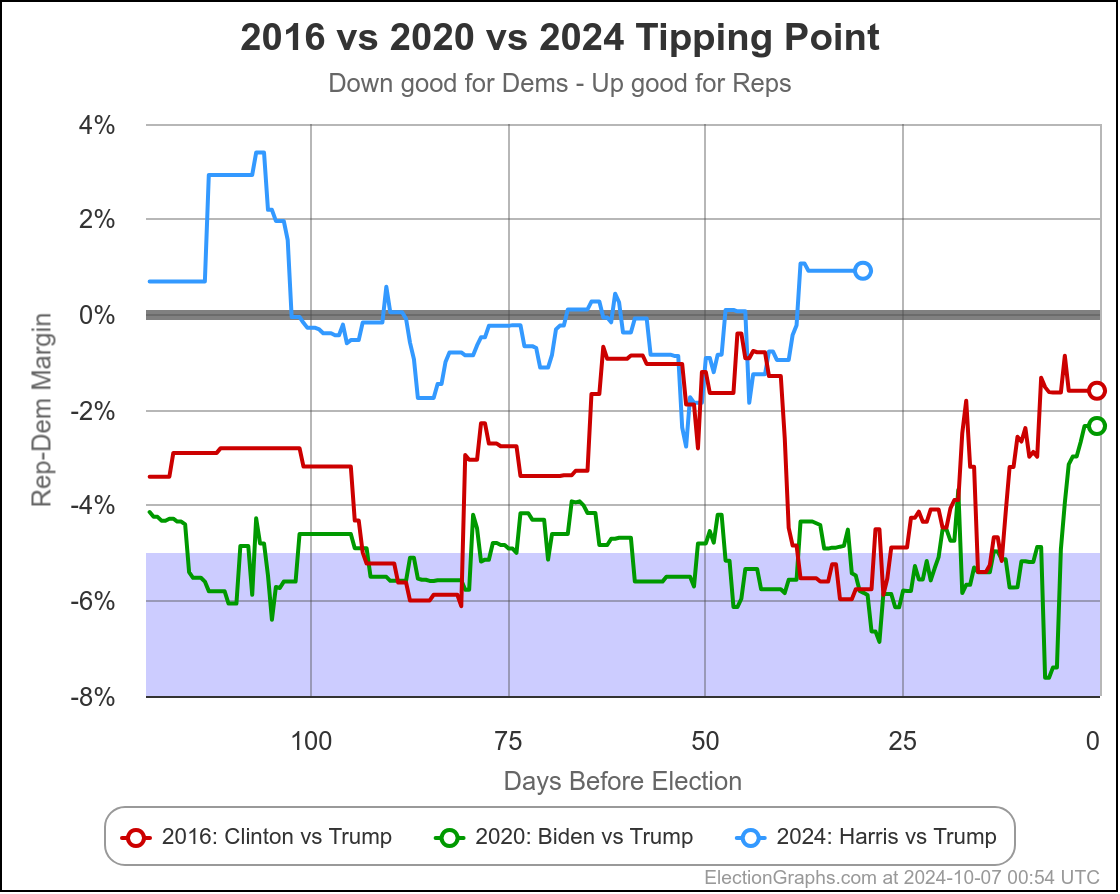
This only shows 2016 and 2020, not the previous elections, but it shows very clearly how much better Trump is doing in the state polling in 2024 than he did in 2020 when he lost, but also how much better he is doing than in 2016 when he won.

Almost the entire time, Trump has been polling better in 2024 than he did not only in 2020, but than he did in 2016, when he won.

Given that context, 25% odds for Harris don't seem that unreasonable. For a Harris win, we either need a big move in the next few weeks, or for the polling error to be in the opposite direction than it has been the last couple cycles.

Now, there are a variety of good reasons to think the polling error might indeed be the opposite direction this time. But we won't really know until after the election.

And this comes to another point. The fact that all the averages and the tipping point are close does not necessarily mean the actual election will be close. It might be. But it also might not be.

Here are charts based on my two models (Independent States and Uniform Swing) showing the range of reasonable possibilities given current polling and the probabilistic model based on historical data:
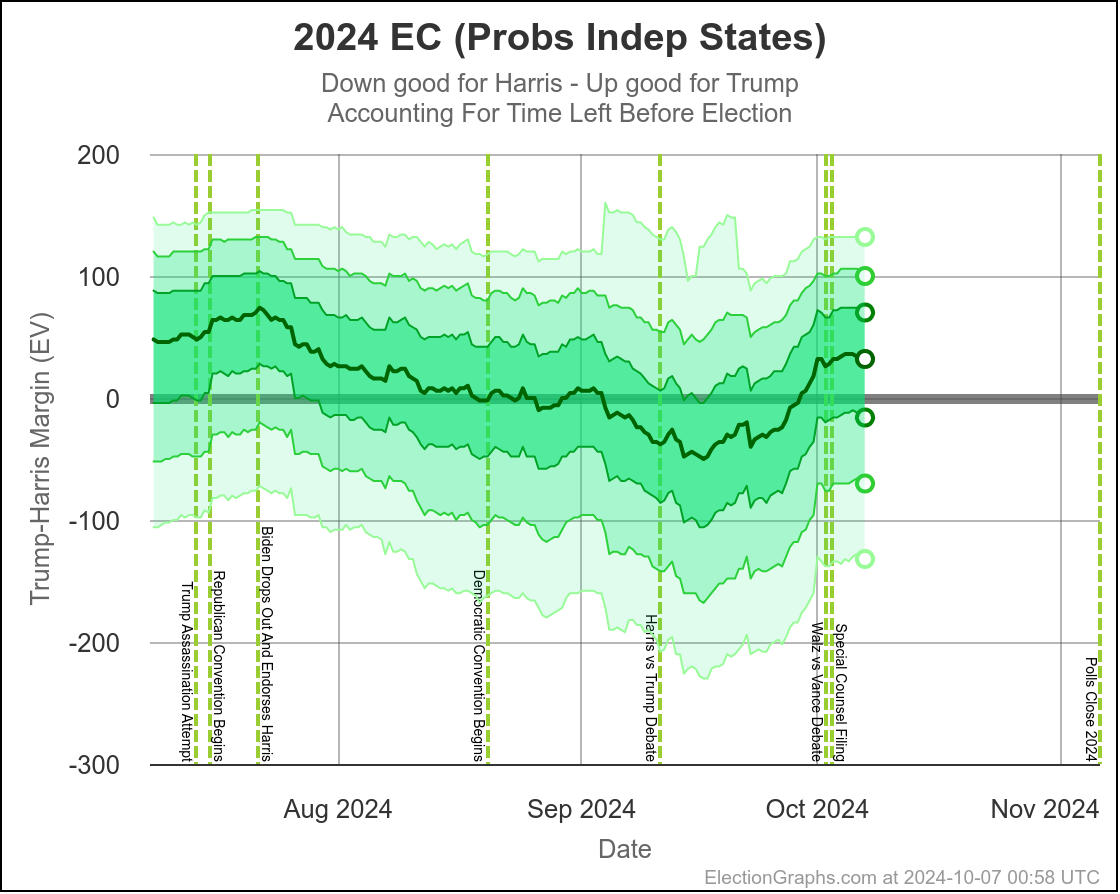
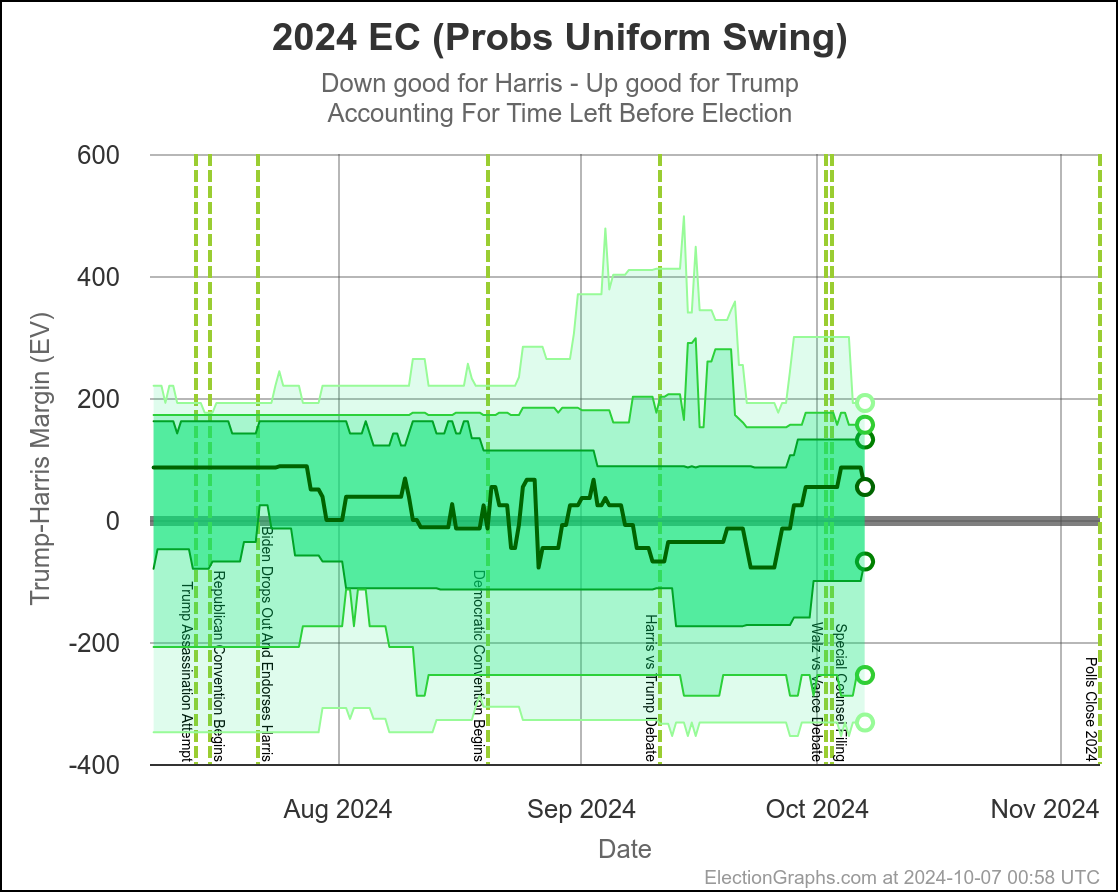
With Independent States, the 2σ (95.45%) range goes from Harris by 70 to Trump by 100.

With Uniform Swing that 2σ (95.45%) range increases to Harris by 254 to Trump by 156.

That second range is probably a bit too wide. As I've said before the "real" numbers are probably somewhere between the two models. But even the narrower of these two is still a really wide range.

Yes, it might end up close, we could end up waiting a week to find out who won the election. But it is also very reasonably possible that EITHER of the two candidates will end up winning by a healthy margin in the Electoral College and we will know the winner on Election Night. Landslides on either side are even still possible, although less likely.

We just don't have the precision in polling data to have a reliable prediction of who will win.

It may not be close in the end, but it IS too close to call.

Finally, the current map:
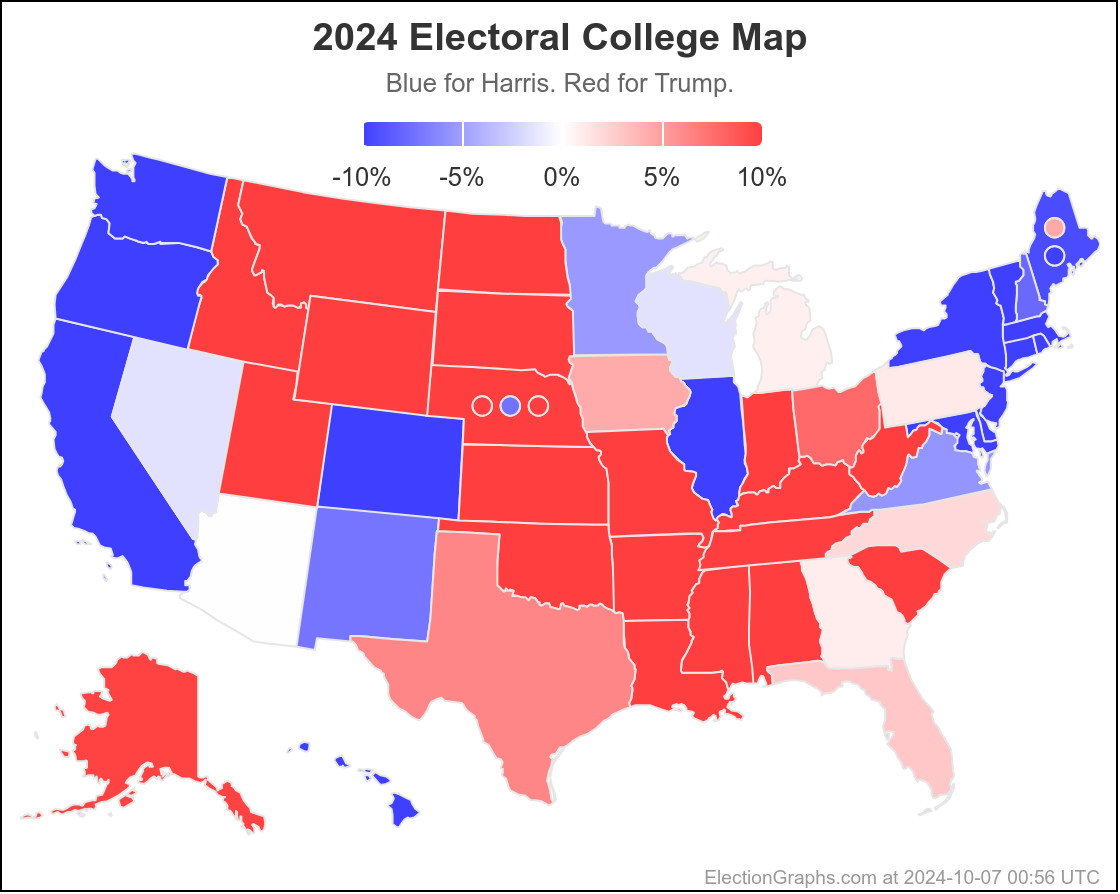
29.6 days until polls start to close on Election Night.

Keep watching.

[Edited 2024-10-07 15:21 UTC to correct one place where I flipped Harris and Trump, and spacing in one other place.]

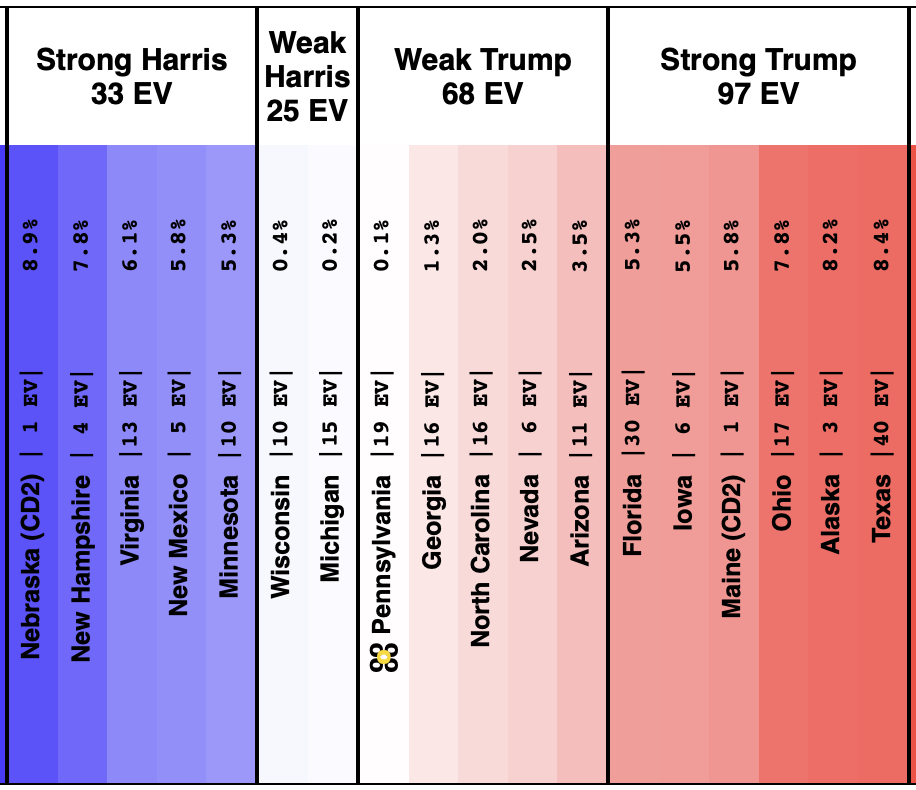
42 Days Out: The Home Stretch

It has only been 14 days since my last post. The 42 days we have left is only 6 weeks. It is time to do these posts more often. So here we go.

Last time our summary line was "a toss up situation, but one where Harris had the momentum".

This time I'd say "a toss up situation, where Harris has a slight edge, but the race is pretty static".

If a summary is all you want, there you go. If you want to dig in to more of the changes since last time, keep going.

As we have before, I'll start by seeing how the spectrum of states has changed since last time.

On 2024-09-10 things looked like this:

And as now of 2024-09-25:

Last time there were 144 electoral votes in the "weak" categories where things could very reasonably go either way. Now there are only 131 electoral votes in that category, but that is still huge.

Narrowed from the states with a margin under 5%, to just those under 2%, there are STILL 84 electoral votes that are too close to call. 78 if you remove Iowa (which has only had one Harris vs Trump poll and is likely redder than is indicated here).

And the tipping point state is right in the middle of those close states.

This is all just to say that this race remains "too close to call".  Every single one of the models on Election Graphs show both a Harris win and a Trump win to be reasonably possible.

OK, now how have the states moved since last time?

Movement toward Trump:

  • Maine-CD2 (1 EV): Trump by 1.4% -> Trump by 4.5% (Trump+3.1%)
  • North Carolina (16 EV): Harris by 0.5% -> Trump by 0.8% (Trump+1.3%)
  • Maine-All (2 EV): Harris by 10.6% -> Harris by 9.3% (Trump+1.3%)
  • Minnesota (10 EV): Harris by 6.6% -> Harris by 5.8% (Trump+0.8%)
  • Iowa (6 EV): Trump by 0.6% -> Trump by 1.3% (Trump+0.7%)
  • New Mexico (5 EV): Harris by 8.0% -> Harris by 7.9% (Trump+0.1%)
  • Arizona (11 EV): Trump by 1.1% -> Trump by 1.2% (Trump+0.1%)

No Movement:

  • Nebraska-CD2 (1 EV): Harris by 4.3%

Movement toward Harris:

  • Georgia (16 EV): Trump by 1.2% -> Trump by 1.0% (Harris+0.2%)
  • Colorado (10 EV): Harris by 9.5% -> Harris by 9.8% (Harris+0.3%)
  • Wisconsin (10 EV): Harris by 1.4% -> Harris by 1.7% (Harris+0.3%)
  • Pennsylvania (19 EV): Harris by 0.2% -> Harris by 0.5% (Harris+0.3%)
  • Ohio (17 EV): Trump by 9.8% -> Trump by 9.4% (Harris+0.4%)
  • Florida (30 EV): Trump by 4.2% -> Trump by 3.7% (Harris+0.5%)
  • Michigan (15 EV): Harris by 1.9% -> Harris by 2.8% (Harris+0.9%)
  • Texas (40 EV): Trump by 6.8% -> Trump by 5.9% (Harris+0.9%)
  • Nevada (6 EV): Harris by 0.4% -> Harris by 1.5% (Harris+1.1%)
  • New Hampshire (4 EV): Harris by 6.1% -> Harris by 7.4% (Harris+1.3%)
  • Virginia (13 EV): Harris by 4.3% -> Harris by 7.0% (Harris+2.7%)

More have moved toward Harris (11) than toward Trump (7).

But the one state that flipped sides was North Carolina, which moved from Harris to Trump.

And the tipping point only moved by 0.1% (from Harris by 0.4% in Nevada, to Harris by 0.5% in Pennsylvania).

All this together means that while there has been lots of churn, the overall picture hasn't changed that much in the last two weeks.

Here are the charts for the tipping point state and the three states on either side. This corresponds to the "seven swing states" that get talked about most often these days.

Every single one of these seven states shows the same high level pattern. A rapid move toward Harris after she became the nominee, but then they just essentially bounce around within a range.

Michigan, Wisconsin, Nevada, and Pennsylvania have all MOSTLY stayed on the Harris side of the center line, with only brief ventures onto the Trump side.

North Carolina, Georgia, and Arizona are the opposite, staying MOSTLY on the Trump side of the center line, with only brief ventures onto the Harris side.

If the current leader in each of these states win, then you end up with a narrow Harris win. (Harris 276 to Trump 262)

All of these states are close states though. They are all close enough that both outcomes are reasonably probable.

We're talking about the "underdog" in one of these states having a 30% to 40% chance of winning, even in the ones of these states with the largest margins.

Looking at the tipping point (the margin in the state that would put the winner over the top) you can see this closeness in another way:

Basically, ever since late July, the tipping point has just bounced around between the tie line and a 2% Harris lead (with a couple very brief forays outside that zone).

Harris has been behind where Clinton was 8 years previously except for a couple very brief moments, and has NEVER been even close to where Biden was 4 years ago.

Even taking the high end of this range for Harris, a 2% lead can easily disappear in a few days with the wrong news cycle, and of course we have seen polling errors larger than that.

  • 2008: Obama's  tipping point was 3.45% better than predicted by EG.
  • 2012: Obama's tipping point was 0.89% better than predicted by EG.
  • 2016: Trump's tipping point was 2.36% better than predicted by EG.
  • 2020: Biden's tipping point was 1.41% worse than predicted by EG.

The EG tipping point underestimated the Democrat in 2008 and 2012.

The EG tipping point underestimated the Republican in 2016 and 2020.

Which will happen this time?

You can easily come up with a lot of reasons to think this time polls are underestimating Harris. Poll performance in 2022 and special elections and referenda since then. A potential enthusiasm gap. Pollsters overcompensating for errors in 2016 and 2020. Etc.

But you can also come up with reasons polls may still be underestimating Republicans. Trump supporters still don't trust or respond to pollsters, just as they didn't in 2016 or 2020. Or pollsters just aren't properly modeling turnout and are underestimating turnout of Trump demographics. Etc.

Honestly, my gut is that polls may be underestimating Harris this time. But that is nothing more than a gut feeling, and could easily be wrong.

We know there will be polling error. There is always polling error. It is inevitable. There are fundamental limits to polling techniques.

If one candidate is winning convincingly, it doesn't matter. The difference between a candidate winning by 12% or by 14% is a difference not many people care about. Either way the candidate wins.

But if that is a difference between one candidate winning by 1% or the other candidate winning by 1%, it makes a huge difference.

So, we're once again just saying the race is too close to call, but in a different way. Lets try to quantify that:

Right now looking at my two probabilistic models that account for the amount of time left before the election (one that assumes the polling errors in the states will be independent, and one that assumes the polling error will be the same everywhere) you get Harris's chance of winning ranging from 53.6% (uniform swing) to 68.8% (independent states).

I don't know where within this range reality is, but my gut is that it is closer to uniform swing simply because the same big pollsters are polling all the close states, and thus any methodological issues they have will likely be similar across all those states.

So with this, Harris is favored a little bit at the moment, but not a lot. Even taking the high end of this range, 70/30 odds give a non-trivial chance for Trump to win.

In 2016 this site did not have probabilistic models yet, but the average of all the sites I could find that gave election odds averaged out to a 14% chance of a Trump win, and Trump won. We're looking at odds for Trump that are more than double his chances in 2016.

But looking at the "if the election was today" numbers gives an important additional caveat to that:

If we had the exact same polling on Election Day as we do today, Harris's range of chances drops to 39.4% to 41.9%.

So rather than being too close to call with a Harris advantage, it would be too close to call with a Trump advantage.

This is quite simply because on average from 2008 to 2020, the polling error  between the final Election Graphs averages and the actual election results underestimated the Republican by about 1.3% in the close states. And right now Harris's tipping point lead is only 0.5%.

I give her better odds given 42 days left until the election essentially because there is still plenty of time to improve those numbers.

(More precisely, on average from 2008 to 2020, the Democrat being ahead by this much 6 weeks out from the election was a bit more correlated with an eventual victory than having a lead like this on Election Day is.)

The detailed math is more complicated of course, but given the history of polling errors from 2008 to 2020 that I've used to build the Election Graphs probabilistic models, to have a better than 50/50 chance of winning in my models when we get to Election Day, Harris will need to be ahead on the tipping point metric by more than 1.3% when we get there.

If either the Democratic Convention or the Harris vs Trump debate had any impact, it was small and short lived. Any ups and downs in August and September may in fact just be based on which pollsters were in the field in any given week rather than actual changes in public opinion.

If you smooth things out, the race has actually been pretty static since Harris's initial surge.

Right now things are a tossup with a slight Harris edge.

If Harris wants to keep it that way though, she needs to improve her poll numbers a bit more in the next six weeks.

If she wants to actually be more confident of a win, she has to improve them quite a bit, not just a little bit.

If she slips any, or even just holds steady, when we get to Election Day it will be a toss up with Trump slightly favored.

So… bottom line, we're still in a "too close to call" situation, and absent something big happening, it is quite likely we still will be in six weeks.

Of course, "something big" sometimes happens. Both 2016 and 2020 had points in the last 100 days where the tipping point moved in one direction or the other by more than 4% in just a week or two.

A 4% move in either direction would massively change what the race looks like. A candidate leading by 4% in the tipping point would be strongly favored. An upset wouldn't be impossible, but would be much more of a surprise.

Things SEEM more sticky this time around, but you never know when those "big events" may happen.

There are new polls almost every day at this point. Sometimes there are days with LOTS of new polls.

I try to get the new polls included in the site quickly whenever they come out. I've just booked time off from the day job for the last two weeks before the election just to keep up with the inevitable deluge of polls at the end.

So don't wait for these blog posts. Check out electiongraphs.com regularly in between posts too. And follow us on Mastodon.

Lets close things out with the current map:

41.8 days until polls close in the first states on election night.

Stay tuned!

56 Days Out: Before the Second Debate

It has been 23 days since my last post.

At that time, things had moved from "Trump is heavily favored, but it is still possible for Harris to catch up" when Biden first dropped out, to a toss up situation, but one where Harris had the momentum.

Lets see how the polls have moved since then.

The bottom line for those who don't want to read further, is that while lots of states have moved in Harris's direction, some critical ones have moved toward Trump as well, and so on balance, it is still a toss up.

Now more details for those who want them.

Here's where the close states were back on 2024-08-18:

And now as of 2024-09-10:

The first thing to note is just the massive volume of really close states.

There are a full 144 electoral votes where the margin is under 5%. We have seen multiple examples of states with margins under 5% go to the other candidate in previous elections. Any of these states are legitimately "close" and the candidate that is behind has a non-trivial chance of winning the state.

When this site does "best cases" for both candidates based on just trusting the polls, we consider the possibility that all 144 of these electoral votes could go to one of the candidates. That gives this massive range of possibilities:

Even if you narrow this and only look at places with margins under 2%, you still have 100 electoral votes in play.

Well, Iowa is in here because there have been no polls at all there so we are looking at previous elections to generate the average, and it is probably actually redder than it appears. Take it out and there are still 94 electoral votes in play, and the election could very easily go either way.

So lets compare the before and after on those states and how things changed in the last 23 days:

Movement toward Trump:

  • Ohio (17 EV): Trump by 7.1% -> Trump by 9.8% (Trump+2.7%)
  • New Mexico (5 EV): Harris by 10.3% -> Harris by 8.0% (Trump+2.3%)
  • Arizona (11 EV): Harris by 0.8% -> Trump by 1.1% (Trump+1.9%)
  • Wisconsin (10 EV): Harris by 3.2% -> Harris by 1.4% (Trump+1.8%)
  • Pennsylvania (19 EV): Harris by 1.9% -> Harris by 0.2% (Trump+1.7%)
  • Maine-CD2 (1 EV): Trump by 0.2% -> Trump by 1.4% (Trump+1.2%)

No Movement:

  • Iowa (4 EV): Trump by 0.6%

Movement toward Harris:

  • Georgia (16 EV): Trump by 1.6% -> Trump by 1.2% (Harris+0.4%)
  • Michigan (15 EV): Harris by 1.5% -> Harris by 1.9% (Harris+0.4%)
  • Minnesota (10 EV): Harris by 6.2% -> Harris by 6.6% (Harris+0.4%)
  • Nevada (6 EV): Trump by 0.7% -> Harris by 0.4% (Harris+1.1%)
  • Virginia (13 EV): Harris by 3.2% -> Harris by 4.3% (Harris+1.1%)
  • Texas (40 EV): Trump by 8.2% -> Trump by 6.8% (Harris+1.4%)
  • Florida (30 EV): Trump by 6.0% -> Trump by 4.2% (Harris+1.8%)
  • North Carolina (16 EV): Trump by 1.5% -> Harris by 0.5% (Harris+2.0%)
  • New Hampshire (4 EV): Harris by 3.0% -> Harris by 6.1% (Harris+3.1%)
  • Colorado (10 EV): Harris by 5.6% -> Harris by 9.5% (Harris+3.9%)
  • Nebraska-CD2 (1 EV): Trump by 4.7% -> Harris by 4.3% (Harris+9.0%)

So we have a mixed bag. More states moved toward Harris than moved toward Trump, but some of those states that have moved toward Trump are important.

Here are the charts of the tipping point state at the moment (Nevada) and the two states on either side (ignoring Iowa since there have been no polls there). Really, all of the states under 5% are battleground states, but these five states are currently the center of that battleground, and the ones the race is pivoting around at the moment:

The thing to note is that in all of these key states when looking at the trend (rather than just comparing to the last blog post) it seems like Harris peaked, followed by movement back toward Trump.

As of now, in North Carolina and Arizona a move back toward Harris has started. But things look pretty flat lately in Nevada and Pennsylvania. And it looks like things may still be trending toward Trump in Wisconsin.

All of these are incredibly close states. So to see how this looks in terms of the overall impact on the national race, lets look at the tipping point, which is the margin in the state that would put the winner over the edge:

There have been ups and downs along the way as polls in various close states have jittered, but the high level trend is that Harris peaked at a 1.8% lead in the tipping point, but has since lost ground, and at the moment is at a 0.4% lead in the tipping point.

This is an incredibly narrow lead. Let me add in the comparison lines for 2016 and 2020:

Although there was a moment like it looked like it might happen, so far Harris has never been doing better than Clinton was doing the same number of days before the election, let alone Biden.

So the fact that Harris is narrowly ahead, should not give Democrats a whole lot of confidence. Right now this race is on a knife's edge.

But we can quantify this. Lets look at my probabilistic models for a moment.

First the charts that try to take into account how much time is left before the election, by comparing how far off Election Graphs poll averages at this same amount of time before the election were to the actual election results in 2008, 2012, 2016, and 2020.


I have two models based on the extremes of how correlated the polling errors in the states are. To explain this a bit more:

The Independent States model says that it is perfectly reasonable to think that Harris might do a lot better than expected in Florida at the same time that she does a lot worse than expected in Virginia. The error in one state tells you nothing about the errors in other states.

Meanwhile, the Uniform Swing model says, no, if the polls have been underestimating Trump in one state, they are probably underestimating him everywhere. So you basically only have to worry about the nationwide bias in the polling averages.

The actual truth is somewhere in between, but I don't know where. So I present both models and the range of possibilities they represent.

First thing I'll note, since last time the chances of a 269-269 tie have plummeted. On August 18th I had that as 1.8% to 10.8% depending on the model. I now have the chance of a tie as between 0.0% and 1.6%. Which is probably for the best. A tied electoral college would be a very chaotic scenario.

Since ties would most likely go to Trump given how those are resolved, let's look at Harris odds.

Last time Harris's win chances were between 49.8% and 52.9%. Despite the move toward Trump in the tipping point, this has now increased to between 60.1% and 73.5%.

Why?

Um, I'm honestly not entirely sure. It might take a deep dive into the data that I don't have time to do to really understand fully, but here are three possibilities:

  • There is less time left before the election for things to change, so even though the lead is smaller, it is more likely to stick.
  • The specific configuration of exactly how far ahead in each state each candidate is means that even though her tipping point is less, there are a lot more "paths to victory" for Harris than before, and the path for Trump is narrower.
  • Quite simply historically Democrats being slightly up in early September has correlated with them doing well in November more than being slightly up at the end of October does.

One interesting thing though, is that things look very different in the "if the election was now" view that I have been mostly ignoring since I introduced the models that take into account the remaining time:

Here Harris's odds are only 34.5% to 40.7%. This is much lower.

Explaining this is easier. Basically, on average for the last four election cycles the FINAL Election Graphs averages in close states have underestimated the Republican a bit. So in states where the Democrat has a lead, but a very narrow lead there at the very end, the models still give the Republican a very good chance of wining. In a 50/50 situation the Republican is favored a bit.

Now, we won't know until after Election Day if the poll averages once again underestimate the Republican, or if this time they underestimate the Democrat.

But IF polls are underestimating the Republican again, the difference between the "if the election was now" and "with 56 days left" models essentially means that if Harris still had these same numbers on Election Day, Trump would be favored, but right now she still has plenty of time to improve the situation further, so her odds right now are higher. To feel good about the election, Harris needs to further improve her numbers as Election Day approaches. Where she is right now isn't "good enough".

And there we have it. Lets close it out with the current map:

As I type this, there have been about a dozen new state level polls since I started this blog post. They would have changed some of the data here a bit, but I have to make a cutoff somewhere when I make one of these posts, and as we approach the election, the number of polls per day is increasing dramatically. So things change every day. Multiple times a day in fact.

So don't wait for these blog posts. Check out electiongraphs.com regularly in between posts. Or follow us on Mastodon.

For now though, the Harris vs Trump debate starts in less than an hour, and I'm going to be watching it. We'll see in a week or two if it makes any difference. Debates usually don't. But the last one sure did!

56.0 days until the polls in the first states start closing on Election Day.

It will be a wild ride!

79 Days Out: Harris Surges to a Tie

It has been 21 days since my last post, but it has been an eventful 21 days.

The last post was about a week after Biden dropped out. There had only been a small number of Harris vs Trump polls that reflected the reality of Harris actually being the nominee rather than just a hypothetical replacement.

At that point polls already showed Harris doing noticeably better against Trump than Biden had been doing.

Three weeks later polls have continued to move dramatically toward Harris.

In fact Harris has taken the lead in the electoral college if you just take the poll averages at face value.

If you look at the probabilistic views that use information about how far off Election Graphs averages were from actual election results from 2004 to 2020, Harris is now over 50% to win in one of my four models. Specifically she's ahead in the one of the four I think best represents reality.

All of the Election Graphs views now show a very close race. This is by no means a "Harris is definitely winning" scenario. But things have shifted very quickly from a "Trump is heavily favored, but it is still possible for Biden to catch up" situation a month ago, to a true toss up situation, and one where Harris has the momentum.

Now, let's get into some details:

There's the new map to start with. Lots more blue than there was three weeks ago.

But let's hit some graphs.

This is the tipping point, the margin in the state that would put the winning candidate over the top in the Electoral College. When Biden dropped out, he was behind by 5.0% to Trump in this metric. (That includes straggler Biden vs Trump polls that were released after he dropped out.)

Harris started behind by only 2.9%. It took longer for us to know it, because polls are released with a lag, but it now seems that within 4 days, Harris had already erased that 2.9% lead by Trump and the tipping point was now in her favor.

Since then the movement toward Harris has been slower, and there was a short time where the tipping point moved back toward Trump for a few days due to a few polls in Pennsylvania, but that quickly reversed and Harris has continued to strengthen, with the tipping point now being 1.1% (in between MI and AZ).

Let's look more specifically at the states.

Here were the close states as of my post on 2024-07-28:

And here they are as of 2024-08-18:

There are still a bunch of states with one or more pair of parentheses, indicating there are still not five actual Harris vs Trump 2024 polls, and the poll average is augmented by previous election results, but we have good data in a lot more states than we did.

Here are the movements in the last three weeks:

Movement toward Trump:

  • Ohio (17 EV): Trump by 4.3% -> Trump by 7.1% (Trump+2.8%)
  • Maine-CD2 (1 EV): Harris by 1.6% -> Trump by 0.2% (Trump+1.8%)
  • Florida (30 EV): Trump by 4.3% -> Trump by 6.0% (Trump+1.7%)
  • New Hampshire (4 EV): Harris by 3.4% -> Harris by 3.0% (Trump+0.4%)

No Movement:

  • Nebraska-CD2 (1 EV): Trump by 4.7%
  • Iowa (4 EV): Trump by 0.6%
  • Virginia (13 EV): Harris by 3.2%
  • Colorado (10 EV): Harris by 5.6%

Movement toward Harris:

  • Minnesota (10 EV): Harris by 5.5% -> Harris by 6.2% (Harris+0.7%)
  • New Mexico (5 EV): Harris by 8.7% -> Harris by 10.3% (Harris+1.6%)
  • Texas (40 EV): Trump by 10.1% -> Trump by 8.2% (Harris+1.9%)
  • North Carolina (16 EV): Trump by 4.2% -> Trump by 1.5% (Harris+2.7%)
  • Georgia (16 EV): Trump by 4.5% -> Trump by 1.6% (Harris+2.9%)
  • Michigan (15 EV): Trump by 1.6% -> Harris by 1.5% (Harris+3.1%)
  • Pennsylvania (19 EV): Trump by 1.3% -> Harris by 1.9% (Harris+3.2%)
  • Wisconsin (10 EV): Trump by 0.2% -> Harris by 3.2% (Harris+3.4%)
  • Nevada (6 EV): Trump by 6.1% -> Trump by 0.7% (Harris+5.4%)
  • Arizona (11 EV): Trump by 5.8% -> Harris by 0.8% (Harris+6.6%)

The four states with no movement are states where there have been no new polls since the last update. In some of the cases there are no Harris vs Trump polls at all, so these are just averages of elections from 2008 to 2020.

In others, there are a handful of Harris vs Trump polls, but they are all from before Biden dropped out. In either case, we really need new polling.

In the four cases where Trump increased, ALL of them were where actual Harris vs Trump polling was replacing old election results in the average, reflecting that these places are more Republican than they had been in 2008 and 2012 for instance.

So these movements are less about measuring something that really changed in the last 3 weeks, and more about just getting enough data to understand the current situation.

As the most dramatic example, let's look at Florida:

The red line for the polling average was moving toward Trump until very recently. But this is because the new polls were replacing old elections in the average that were very close, as well as a couple of really good Harris results in 2021 and 2022.

But if you look just at the new polls in July and August, you can see them clearly trending toward Harris. With the last couple of polls, the average is now moving that direction again too.

The average still doesn't show Harris as particularly competitive in Florida. EG gives her an 8.2% chance of winning the state given this average this long before the election.

But even here, there does seem to be a trend toward Harris, with the most recent polls indicating a close race.

This kind of thing was happening in all of the areas moving toward Trump, including the one that flipped from blue to red:

We just had our first 2024 Harris vs Trump poll in Maine's 2nd Congressional District.

Before that our average had Harris up by 1.6%. Democrats had won ME-CD2 in 2004, 2008, and 2012. But Republicans won in 2016 and 2020. On average, these come out to a small Democratic lead. But the trend has been toward the Republicans.

So as a real 2024 poll replaces the 2004 results in the average, this moves toward Trump, and flips to the red side of the line. The new poll's two results average to Trump up by only 3% though, which is a lot less than Trump's 10.3% and 7.4% wins in 2016 and 2020 respectively.

Let's quickly look at all other jurisdictions crossing the center line:

All of these mirror the initial tipping point chart I showed, with an initial rapid movement toward Harris right after Biden dropped out, which has slowed down since then but has not yet stopped.

So yes. Harris has made lots of progress in a few weeks.

Now let's talk about how close things still are, looking at this in a bunch of different ways.

First up, the categorization view. This just looks at all the states where the margin is less than 5%, and shows the range of results that can happen if all those states end up going to one side or another.

In the end, 5% is a pretty small margin. With the right poll errors, or the right news events that change the race, a 5% margin can disappear pretty quickly.

Considering all of these electoral votes as "could go either way" you can get results from Trump by 122 EV all the way to Harris by 114 EV. Quite simply, even though the middle line, where each candidate wins all the states where they lead the polls, gives you a 22 EV Harris win, either candidate can still easily win.

Of course, "every state with a margin under 5% could go either way" is an oversimplification. Let's look at how this comes out in my probabilistic views that take into account how long there is before the election.

(I'm only going to look at the two that take into account the amount of time left before the election, ignoring the "if the election was now" ones.)

Basically, these look at the Election Graphs averages in 2008 to 2020 at the same amount of time before the election at various margins, then compares to how often those averages ended up picking the winner, and uses that information to run simulations of the electoral college given the current polling.

Since on average from 2008 to 2020, the Election Graphs poll averages have underestimated the Republican in close states, this effectively means that when states are tied, we still give the Republican a small advantage. For our probabilities to be showing a 50/50 situation, the Democrat has to be ahead by a little bit.

Which is where we are today.

One of these simulations assumes the eventual poll errors in each state are completely independent, the other assumes the poll error is uniform across all states. Obviously the reality is somewhere in between. My guess is closer to the uniform swing side of these ranges, but let's look at the full range between these two models.

On the day Biden dropped out, Harris's chances were between 7.4% and 18.1%.

As of this post, this has increased to being between 49.8% and 52.9%.

Huge improvement from where things were before… to now being essentially a coin toss.

But wait, what is that white bit?

Well, that is the chances for a 269-269 tie, which would throw the election into the House of Representatives, where the NEW House would decide the President, but voting by state delegations, which even if Democrats retake the House would probably still be Republican dominated. So ties would most likely end up going to Trump. But only after a lot of additional drama.

Right now the states are lined up such that if Harris wins every state she leads EXCEPT Arizona (where she lead by only 0.8% at the moment) then you end up with that 269-269 tie.

Right now, Election Graphs gives odds for that between 1.8% and 10.8%. Still an unlikely scenario, but a pretty big chance for an outcome that would be chaotic at best.

Contingent elections for President have only happened twice in US history. That would be the 1800 and 1824 elections. (For 1836 there was a contingent election for Vice President only.) If this were to happen, it would be the first time in 200 years.

These odds would essentially go away if either Maine's 2nd or Nebraska's 2nd end up on the blue side of the line. We discussed ME-CD2 above. There have been zero Harris vs Trump polls for NE-CD2 yet. It went Republican in 2004, 2012, and 2016. But the Democrat won in 2008 and 2020. On average over the last 5 cycles, it is R+4.7%. But in 2020 it was D+6.5%.

We really need more polls in ME-CD2 and NE-CD2. This is the kind of close year where they could be the difference between having a clear winner, and having a 269-269 tie that throws the election into the House.

Back to the tipping point for one last view on the "lots of movement toward Harris, but Democrats should not be feeling confident yet" theme:

Right now, for the first time since Biden dropped out, Harris is doing better than… where Clinton was when she had worst polling she ever had.

Just barely.

And of course we all know Clinton ended up losing.

Harris is still running behind where Clinton usually was in 2016, and even further behind where Biden usually was in 2020.

This may still change. The DNC is about to start. We have Trump's sentencing for the NY case on the calendar soon after that. And debates coming up that may end up favoring Harris. Or the poll errors could underestimate the Democrat this year, after a couple of cycles of underestimating the Republican.

So Harris has plenty of opportunity to pull further ahead.

But things could go the other way too.

Trump's campaign may eventually figure out ways to effectively attack Harris. They may get their stride back after, as JD Vance said, being "sucker punched" by the shift from Biden to Harris. Or there may be news events that reflect badly on the Biden/Harris administration. Or Harris may make some mistakes that cost her, or be hit by some currently unknown October surprise scandal.

You never know.

We really are in coin toss territory right now.

Every day is going to matter.

So pay attention.

78.9 days until the first polls close on election night 2024.